

Top 3 Price Prediction Bitcoin, Gold, Silver: Correction Risks Rise Amid Momentum Slowdown
Bitcoin, gold, and silver prices are trending on shaky grounds as bullish momentum weakens, progressively putting BTC, XAU, and XAG at the cusp of corrections.
Analysts say Bitcoin is acting as if it has found its IPO price, with original sellers exiting, venture capital liquidity drying up, and fear rising. If this is the case, the pioneer crypto could very well be looking for a bottom.
Support at $100,300 Remains the Lifeline for Bitcoin Price
Researcher Jordi Visser says Bitcoin appears to have found its IPO price, signaling early signs of a market bottom. The tongue-in-cheek post aligns with remarks from other analysts suggesting a shift to market maturity.
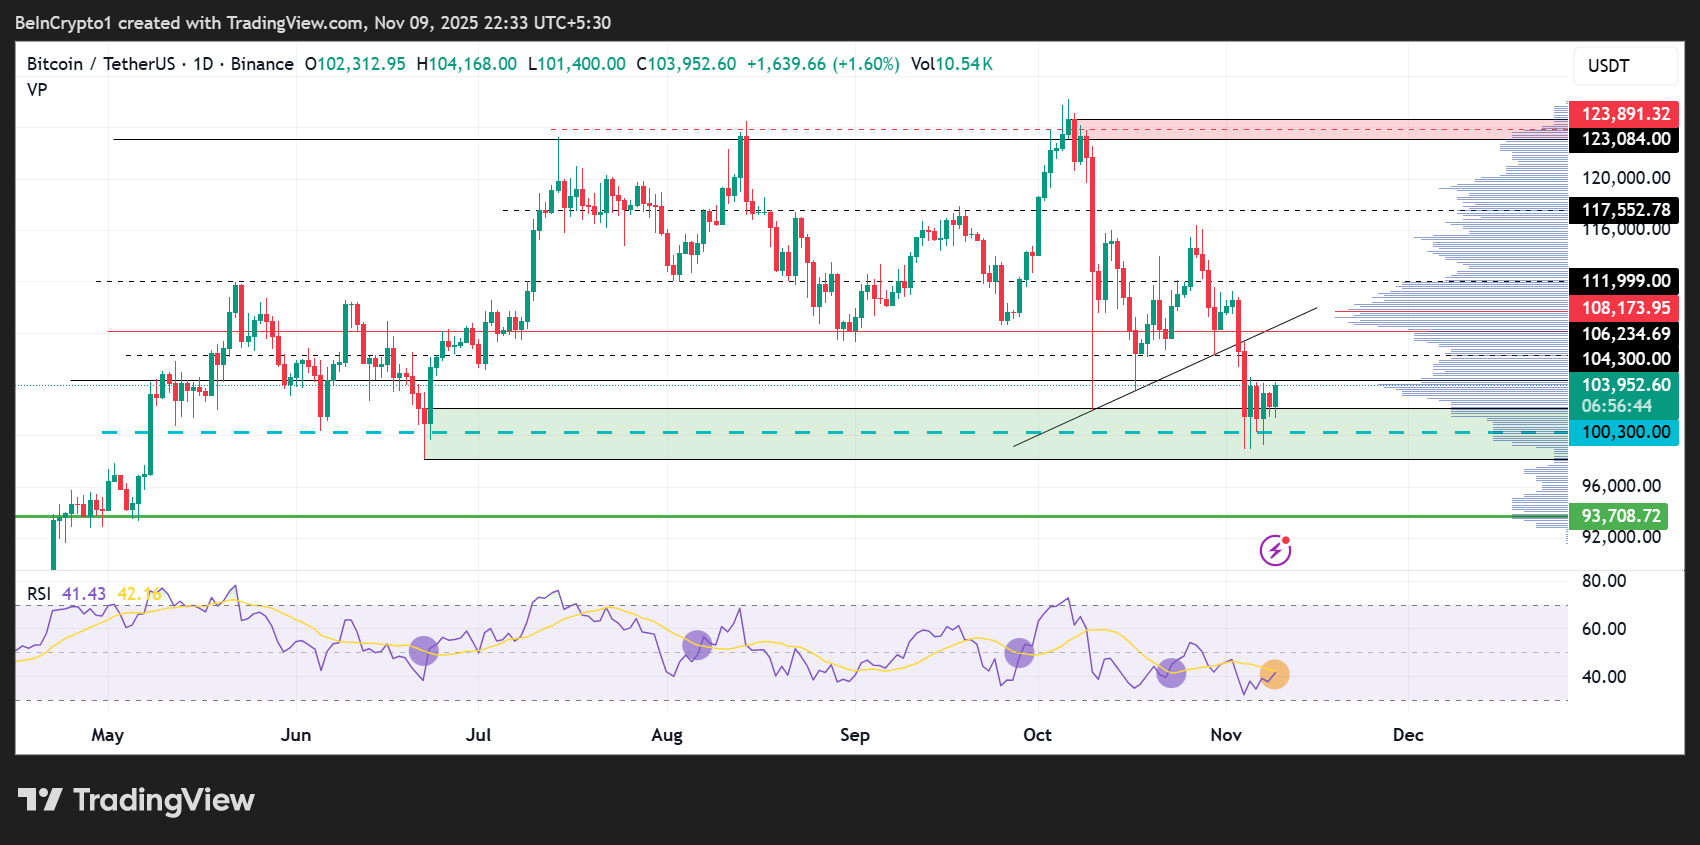
From a technical standpoint, however, the pioneer crypto risks a breakdown before the next bullish wave. After breaking below the ascending trendline, BTC dropped to test the $100,300 support level.
The $100,300 support level is critical, serving as the mean threshold or midline of the demand zone between $102,120 and $98,200. A break and close below it on the daily timeframe, therefore, would confirm the continuation of the downtrend. Traders looking to take short positions on BTC/USDT should consequently wait for confirmation below $100,300.
With the RSI (Relative Strength Index) below 50, buyer momentum remains weak, and the price could pull back. Below $100,300, the BTC price could drop to $93,708, which is nearly 10% below current levels.
 Bitcoin (BTC) Price Performance. Source: TradingView
However, as $100,300 continues to hold as a support level, the Bitcoin price could push north, potentially breaking above immediate resistance at $104,300. To confirm an uptrend, however, bulls are already waiting above $108,173 to interact with the BTC price.
The ensuing buyer momentum above the aforementioned level could see the Bitcoin price rise to $111,999. In a highly bullish case, BTC could ascend to flip $117,552 into support. For a shot at a new all-time high, however, BTC must record a daily candlestick close above $123,891.
The RSI is also showing signs of an imminent buy signal, which will be executed once the purple line (RSI) itself) crosses above its signal line (yellow).
Gold Price Failed Every Time It Tested This Resistance
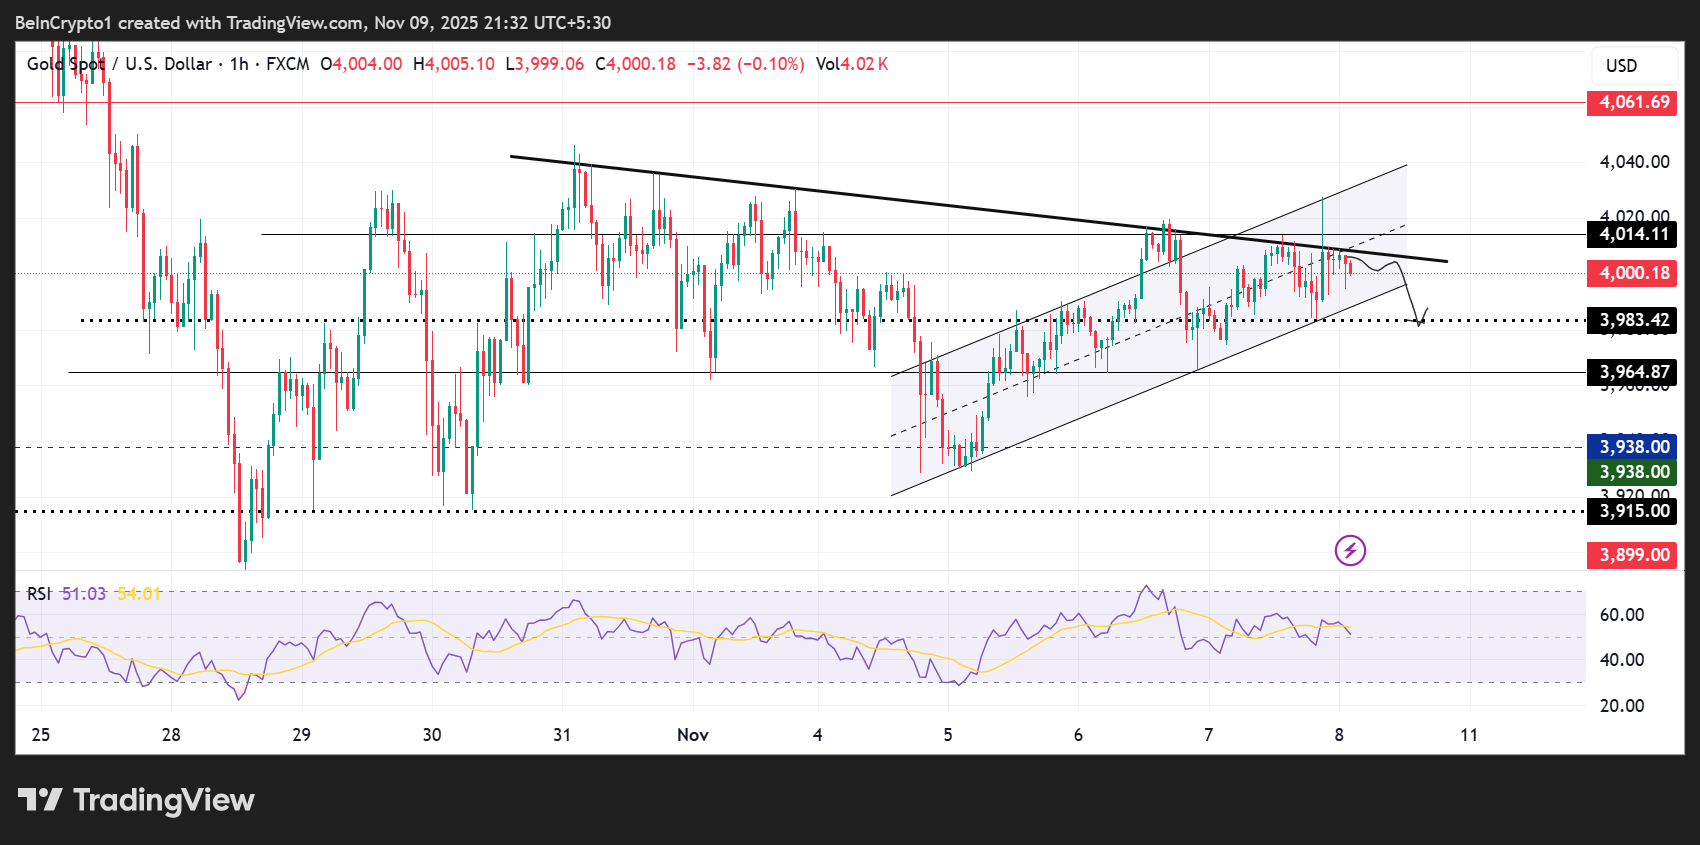
The gold price has tested this falling trendline since late October, and each time it has, it has corrected. Based on this history, the recent test may not be any different, and the XAU price could fall to $3,983.
If the $3,983 support level fails to hold, the gold price could extend a leg south to $3,964, or in the dire case, fall to $3,938.
Bearish sentiment for the gold price was exacerbated by the sell signal executed when the RSI crossed below its signal line.
 Gold (XAU) Price Performance. Source: TradingView
Conversely, if bullish momentum increases at current levels, the gold price could break above the midline of the ascending parallel channel, which confluences with the descending trendline.
This breakout, confirmed with a one-hour candlestick close above $4,014, would put the XAU/USD trading pair back on course for more gains, defined within this ascending parallel channel.
Such a directional bias could see the gold price reclaim the $4,040 threshold, levels last tested in late October. In a highly bullish case, the XAU/USD pair could rise to $4,061.
Silver’s Two-Week Support Faces Stress Test
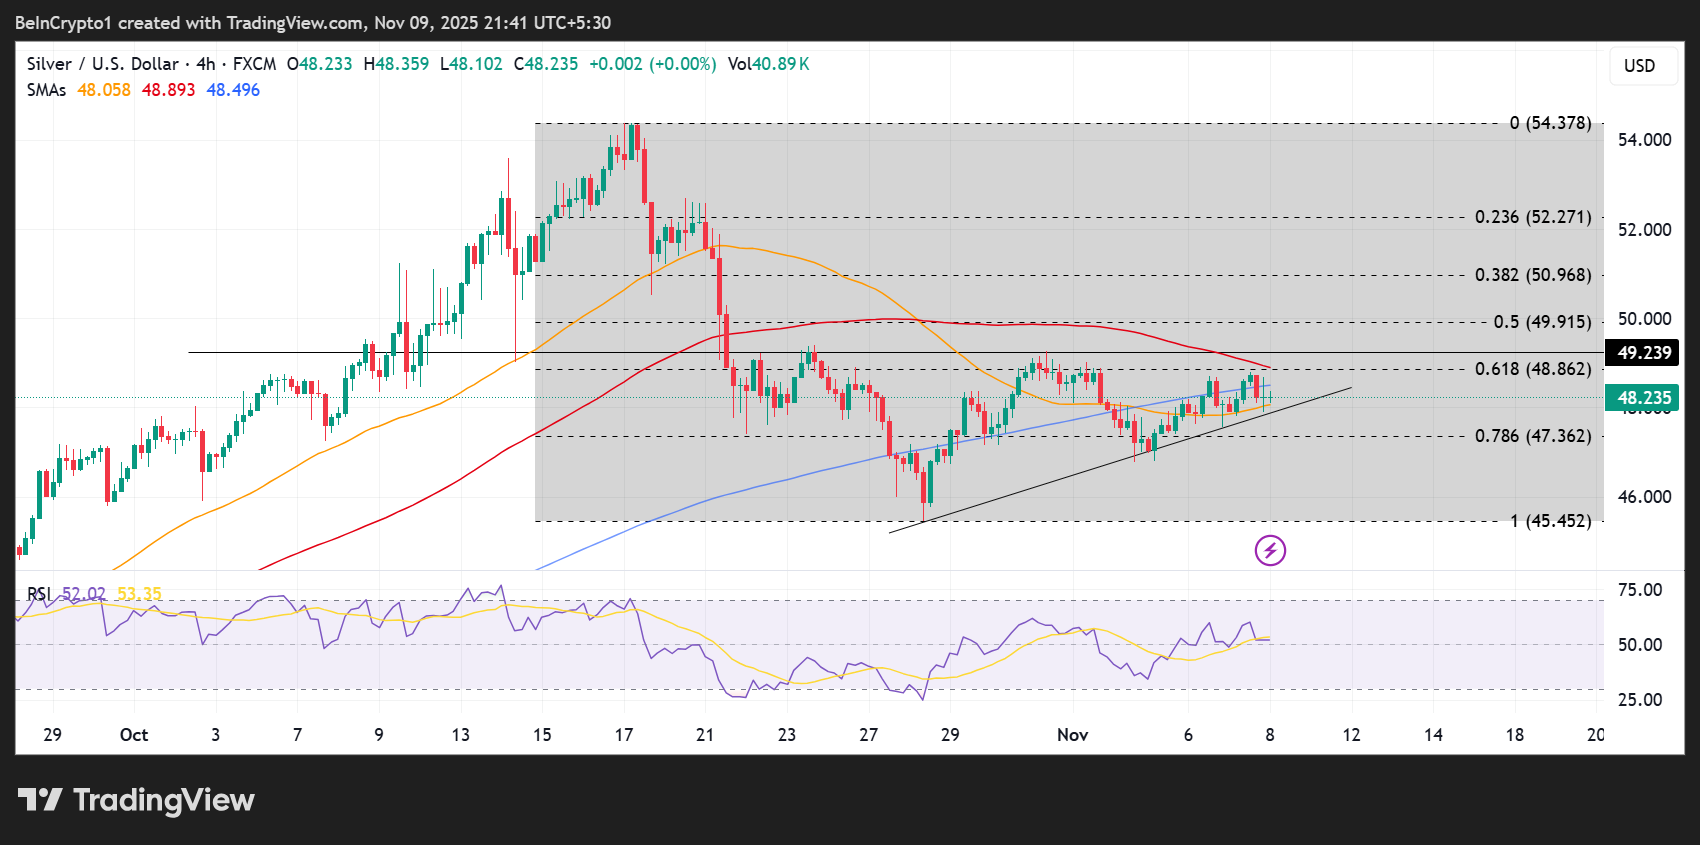
Since October 25, the ascending trendline has provided significant support for the silver price, which has consolidated along it as it pushed higher. Now, with multiple resistances looming, this longstanding support is subjected to what can only be a stress test.
While the 50-day SMA (Simple Moving Average) offers initial support at $48.05, overhead pressure due to the 100- and 200-day SMAs at $48.89 and $48.49, respectively, could cap silver’s short-term upside potential.
If the ascending trendline breaks as support, the silver price could provide another buying opportunity at $47.36, which coincides with the 78.6% Fibonacci retracement level. The dire case is a fall off the cliff to $45.45, nearly 6% below current levels.
The RSI position at 52 also suggests not-so-strong buying pressure, increasing the odds of a pullback.
 Silver (XAG) Price Performance. Source: TradingView
On the other hand, if the 50-day SMA at $48.05 serves as a buyer congestion level, buying pressure from this support could catalyze further upside.
A decisive break and close above the resistance confluence at $48.86, earmarked by the most critical Fibonacci retracement level of 61.8%, could encourage more buy orders, sending XAG/USD above $49.23.
Recommended Articles


