

DUSK Price Forecast: DUSK extends rally with network activity surging to 20-month highs
- DUSK price extends its gains on Friday after rallying over 60% so far this week.
- On-chain metrics indicate strengthening momentum, with daily active addresses and network growth rising to their highest levels since March 2024.
- Technical indicators point to further upside potential, with bulls eyeing the $0.10 target next.
DUSK (DUSK) price continues its strong upward momentum, trading above $0.078 at the time of writing on Friday, extending gains of over 60% so far this week. On-chain data shows a sharp rise in daily active addresses and network growth, reaching levels not seen in 20 months, signaling renewed investor interest. Meanwhile, bullish technical indicators suggest DUSK is set for another leg higher, potentially targeting $0.10.
DUSK’s on-chain and derivatives data show bullish bias
Santiment’s Daily Active Addresses index, which tracks network activity over time, paints a bullish picture for DUSK. A rise in the metric signals greater blockchain usage, while declining addresses point to lower demand for the network.
In DUSK’s case, Daily Active Addresses rose from 59 on Monday to 312 on Friday, the highest level since March 2024. This indicates that demand for DUSK’s blockchain usage is increasing, which bodes well for DUSK’s price.
 [09-1762493314536-1762493314538.56.08, 07 Nov, 2025].png)
Santiment data show that DUSK’s network growth index — a key metric tracking user adoption and project traction — surged to 95 on Thursday from 13 on Monday, the highest level since March 2024. Although it has since stabilized around 32 on Friday, the elevated levels still highlight a broadly bullish outlook for DUSK.
 [09-1762493338640-1762493338642.55.54, 07 Nov, 2025].png)
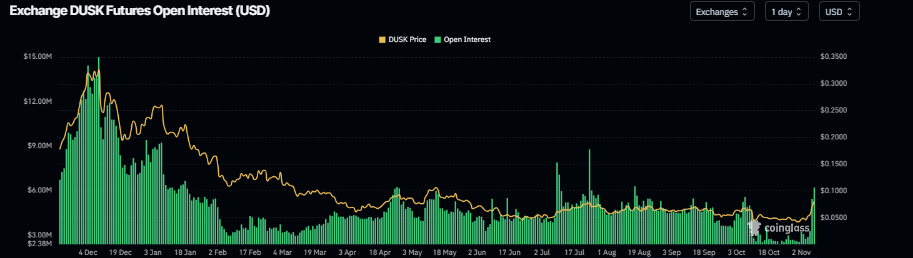
Still, when examining its derivatives data, the outlook for DUSK suggests a further rally ahead. CoinGlass’ data shows that DUSK futures OI at exchanges rose to $6.21 million on Friday from $2.77 million on Monday, the highest level since August 18. Rising OI represents new or additional money entering the market and new buying, which could fuel the current DUSK price rally.
DUSK Price Forecast: DUSK bulls aiming for $0.10 mark
DUSK price found support at the weekly level of $0.042 on Monday and rose by over 50% over the next three days, closing above the daily resistance at $0.055 on Thursday. At the time of writing on Friday, it continues to trade higher by 10% around $0.078.
If DUSK continues its upward trend and closes above the 61.8% Fibonacci retracement level at $0.077 on a daily basis, it could extend the rally toward the key psychological level at $0.10.
The Relative Strength Index (RSI) on the daily chart is 75, above the overbought threshold, indicating strong bullish momentum. Additionally, the Moving Average Convergence Divergence (MACD) showed a bullish crossover that remains intact, with rising green histograms above the neutral level, indicating the continuation of an upward trend.
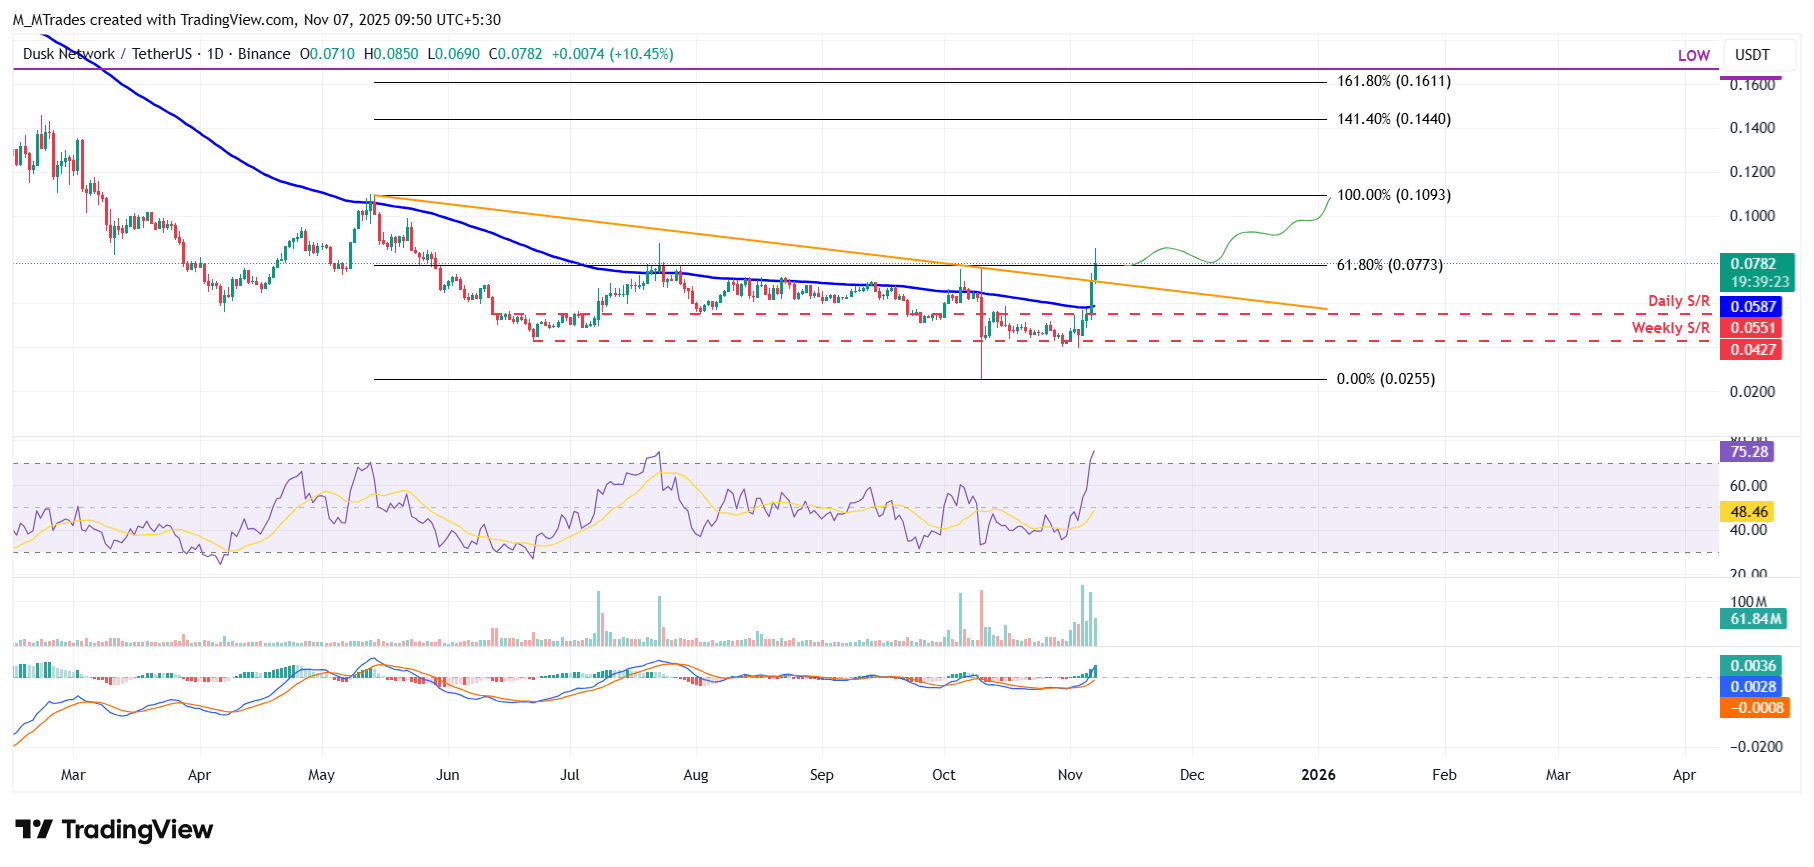
On the other hand, if DUSK faces a correction, it could extend the decline toward the 100-day EMA at $0.058.
Recommended Articles


