
XRP Indicator That Nailed Recent Reversals Has Flashed Again
A cryptocurrency analyst has explained how the TD Sequential has accurately spotted XRP trend reversals over the last three months, and It has just flashed again.
TD Sequential Has Given Another Signal For XRP
In a new post on X, analyst Ali Martinez has discussed about the Tom Demark (TD) Sequential signal that has just formed for XRP. The TD Sequential is a technical analysis (TA) indicator that’s used for spotting points of trend reversal in a given asset’s price.
The indicator involves two phases. In the first of these, called the setup, it counts up nine candles of the same color on the asset’s chart. Once the nine candles are in, it signals that the price trend has reached a state of exhaustion. In other words, the asset has reached a point of turnaround.
Naturally, this signal is a bullish one if nine red candles led to the setup’s completion. Similarly, the signal is bearish if green candles were involved instead. When the setup is done, the second phase begins. This phase, known as the countdown, works much like the setup, with the only difference being that it lasts for thirteen candles. The countdown’s finish coincides with another top or bottom for the asset.
XRP has recently completed the former of the two TD Sequential setups on its daily price. Below is the chart shared by Martinez that shows this signal forming for the cryptocurrency.
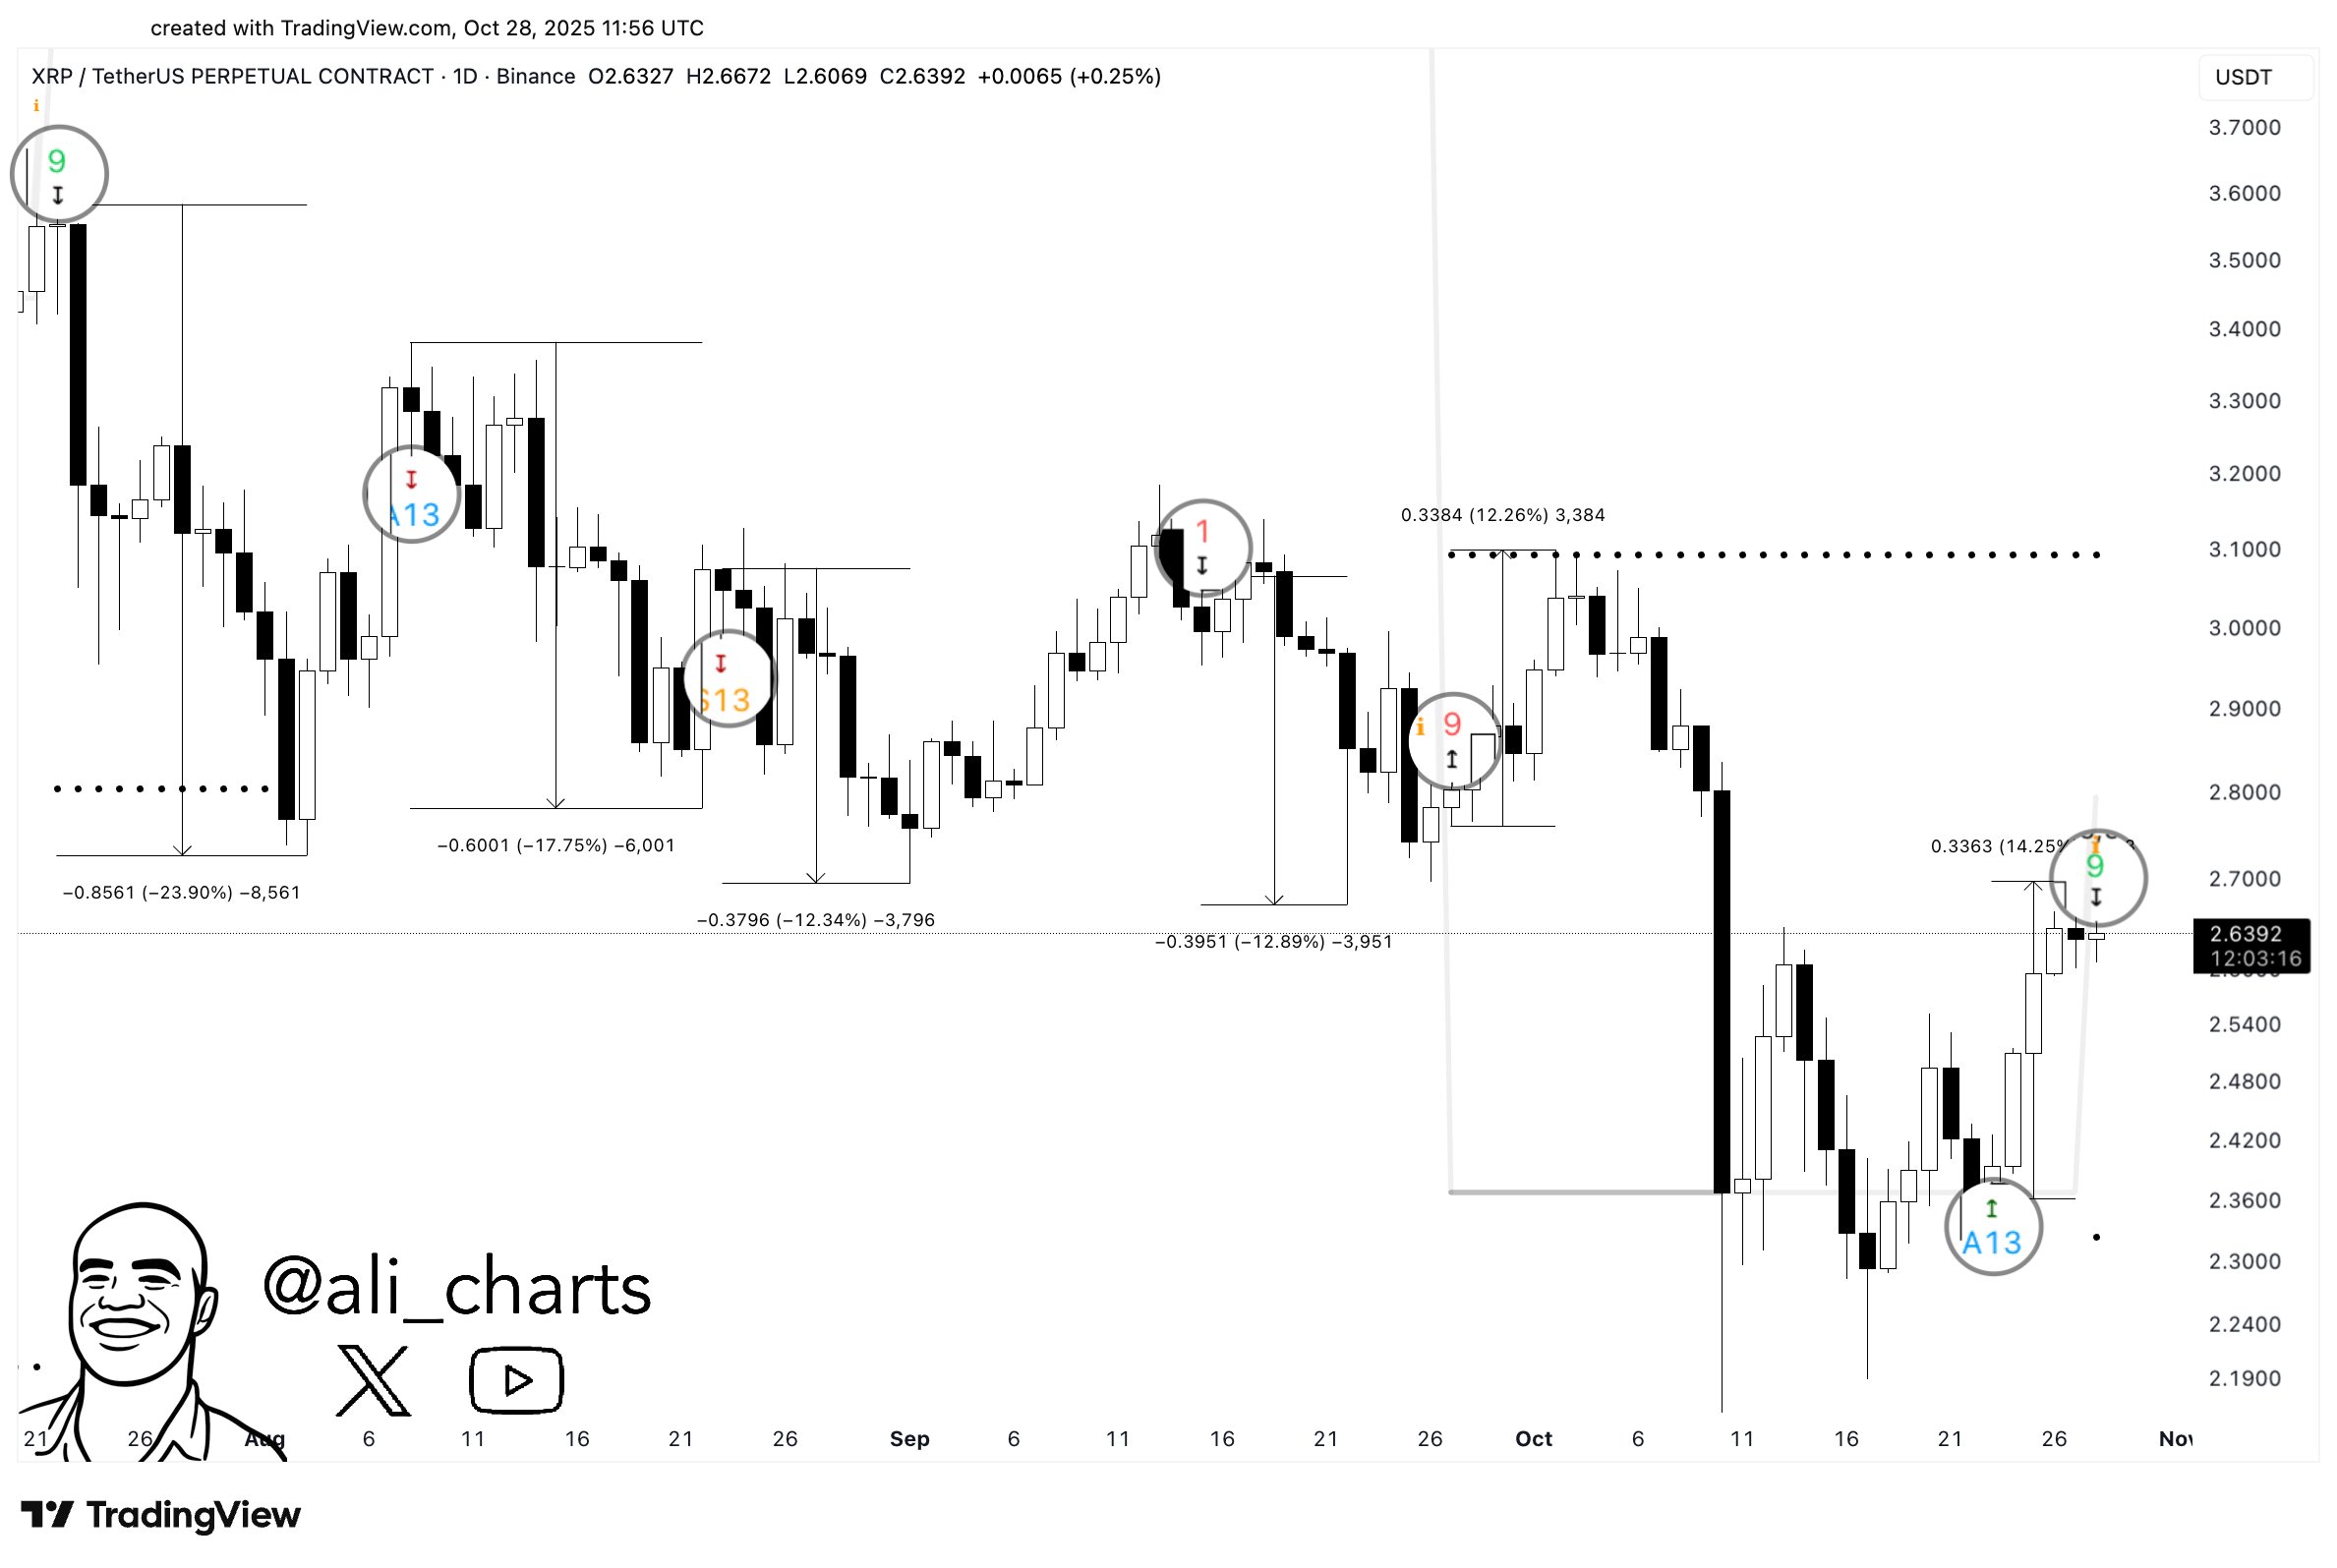
As displayed in the graph, the 1-day price of XRP has formed a TD Sequential setup with nine green candles. This means that the coin could be due a reversal to the downside, at least from the perspective of the indicator.
During the last few months, the TD Sequential has given several signals for the asset, and interestingly, they have coincided quite well with local tops and bottoms. Considering this trend, it’s possible that the latest sell signal may also lead to a drawdown for the coin.
XRP isn’t the only asset that the TD Sequential has lately been reliable for. As the analyst has explained in another X post, the indicator has also called the recent swings in the Bitcoin price.
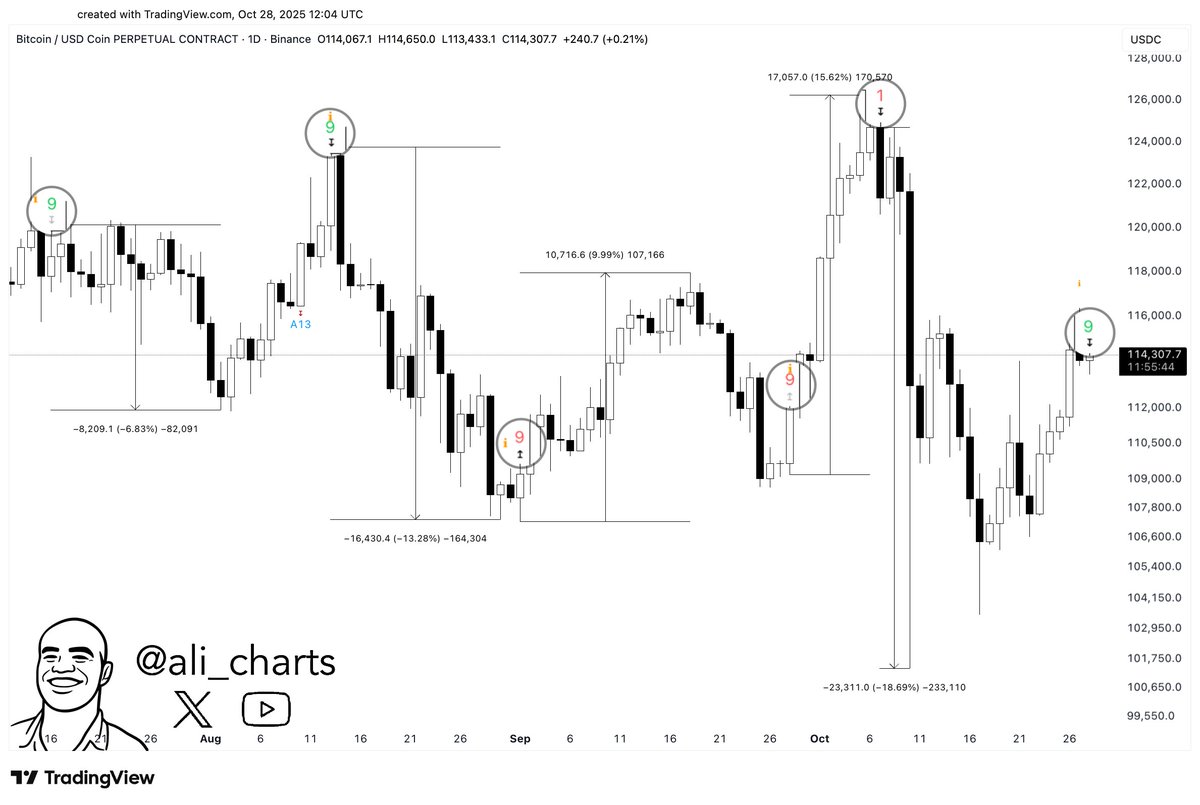
From the above chart, it’s apparent that the TD Sequential gave a sell signal for Bitcoin earlier in the day. Since then, the asset has witnessed a retrace, implying that the metric may have once again caught a trend reversal.
XRP Price
XRP has been trading sideways recently as its price is still floating around $2.62.
Recommended Articles


