

XRP, BNB, and SOL record major losses as Bitcoin slides to $105,000

- Gold Prices Under Pressure After Hitting $4,600, UBS: Safe-Haven Logic Unchanged But Only Delayed.
- US-Iran Rift Persists, Will Gold Rise or Fall Next?
- Gold rallies on hopes for US-Iran talks and falling US Treasury yields
- Gold Price Forecast: XAU/USD opens lower around $4,450 on fears of widening Iran conflicts
- USD/JPY Hits 160.00 Mark, Will Japanese Government Intervene? Will the Currency’s Rally Be Contained?
- Seesaw Effect Continues. US Pre-Market Three Major Index Futures Weaken, Oil Prices Rise, Bitcoin Drops Below 68,000 Mark

XRP holds at $2.30 after an 8% drop on Monday, risking further losses amid an impending Death Cross pattern.
BNB token drops below $1,000 as a bearish flag breakout extends losses.
Solana’s 10% drop on Monday breaks below the key support zone and trendline, despite strong ETF inflows.
Ripple (XRP), BNB (previously known as Binance Coin), and Solana (SOL) are trading in the red on Tuesday as the broader cryptocurrency market suffers a sell-off wave that has triggered $1 billion in liquidations over the last 24 hours. Bitcoin (BTC) has dropped to $105,000, with Ethereum (ETH) at $3,500 at the time of writing.
Technically, the altcoins are at a higher risk of further losses as selling pressure increases.
XRP holds at key support amid rising selling pressure
XRP recovers over 1% at press time on Tuesday, following a nearly 8% loss on the previous day. Despite a bearish start to the week, the XRP bulls hold a stronghold at the $2.30 support level marked by the October 11 low.
If XRP drops below $2.30, it could extend the decline to the $2.19 and $1.90 lows from October 17 and June 22, respectively.
The downward shift in the 50-day Exponential Moving Average (EMA) risks crossing below the 200-day EMA, which would trigger a Death Cross pattern. Typically, it is considered a sell signal as a short-term decline outpaces the longer-term trend.
The momentum indicators on the daily chart suggest a bearish shift in trend, as the declining Moving Average Convergence Divergence (MACD) converges with the signal line, indicating a fading of bullish momentum. Additionally, the Relative Strength Index (RSI) at 39 maintains a downward slope as selling pressure increases.
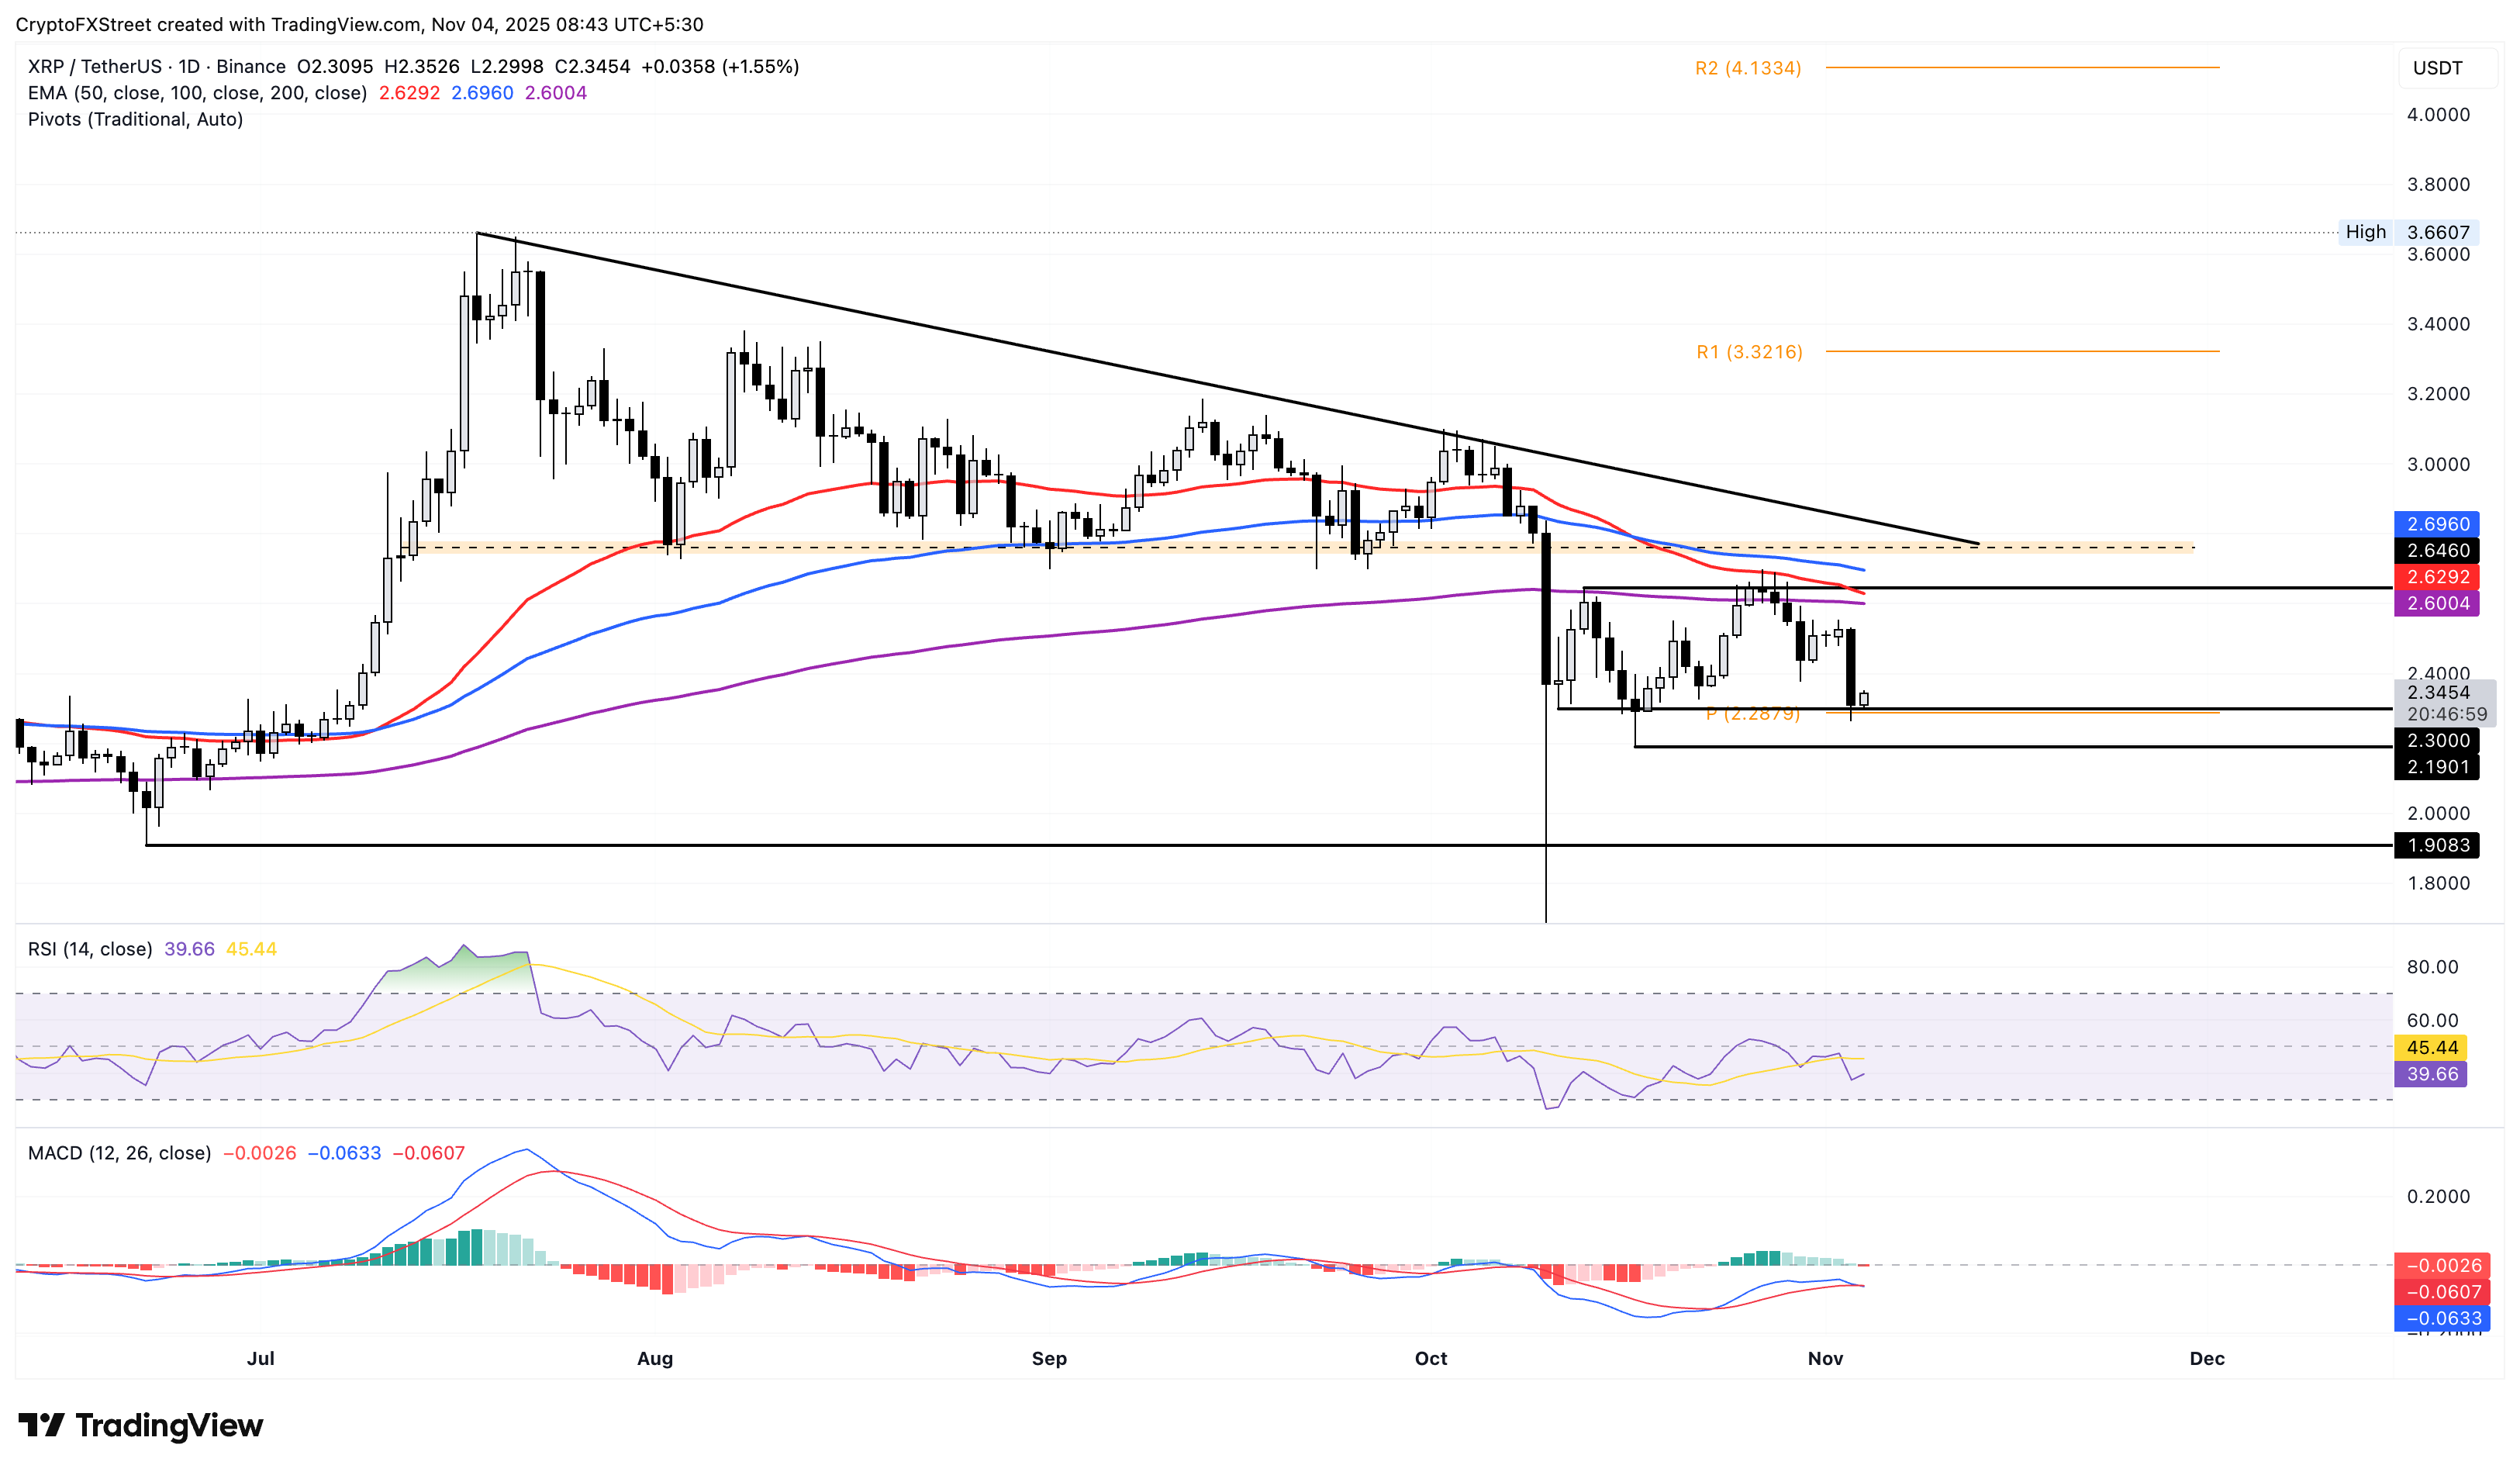
XRP/USDT daily price chart.
Looking up, a potential rebound could test the 200-day EMA at $2.60.
BNB extends the bearish flag breakout
BNB extends the downside breakout of a bearish flag pattern on the 4-hour chart. At the time of writing, BNB trades below $1,000 on Tuesday following the 8% decline on the previous day.
BNB bears aim for the $932 support level, marked by the September 26 low, as their immediate target. If the downtrend exceeds $932, it could extend the decline to $819, achieve the 25% downside target of the bearish flag.
Following a Death Cross pattern between the 50-period and 200-period EMAs on the 4-hour chart, the 100-period and 200-period EMAs converge for a bearish crossover. If the EMAs achieve a descending alignment, the BNB price trend on the shorter timeframe will turn bearish.
Corroborating the bearish dominance on the same chart, the MACD extends a downtrend in the negative territory. Furthermore, the RSI hovers in the oversold region, indicating high selling pressure.
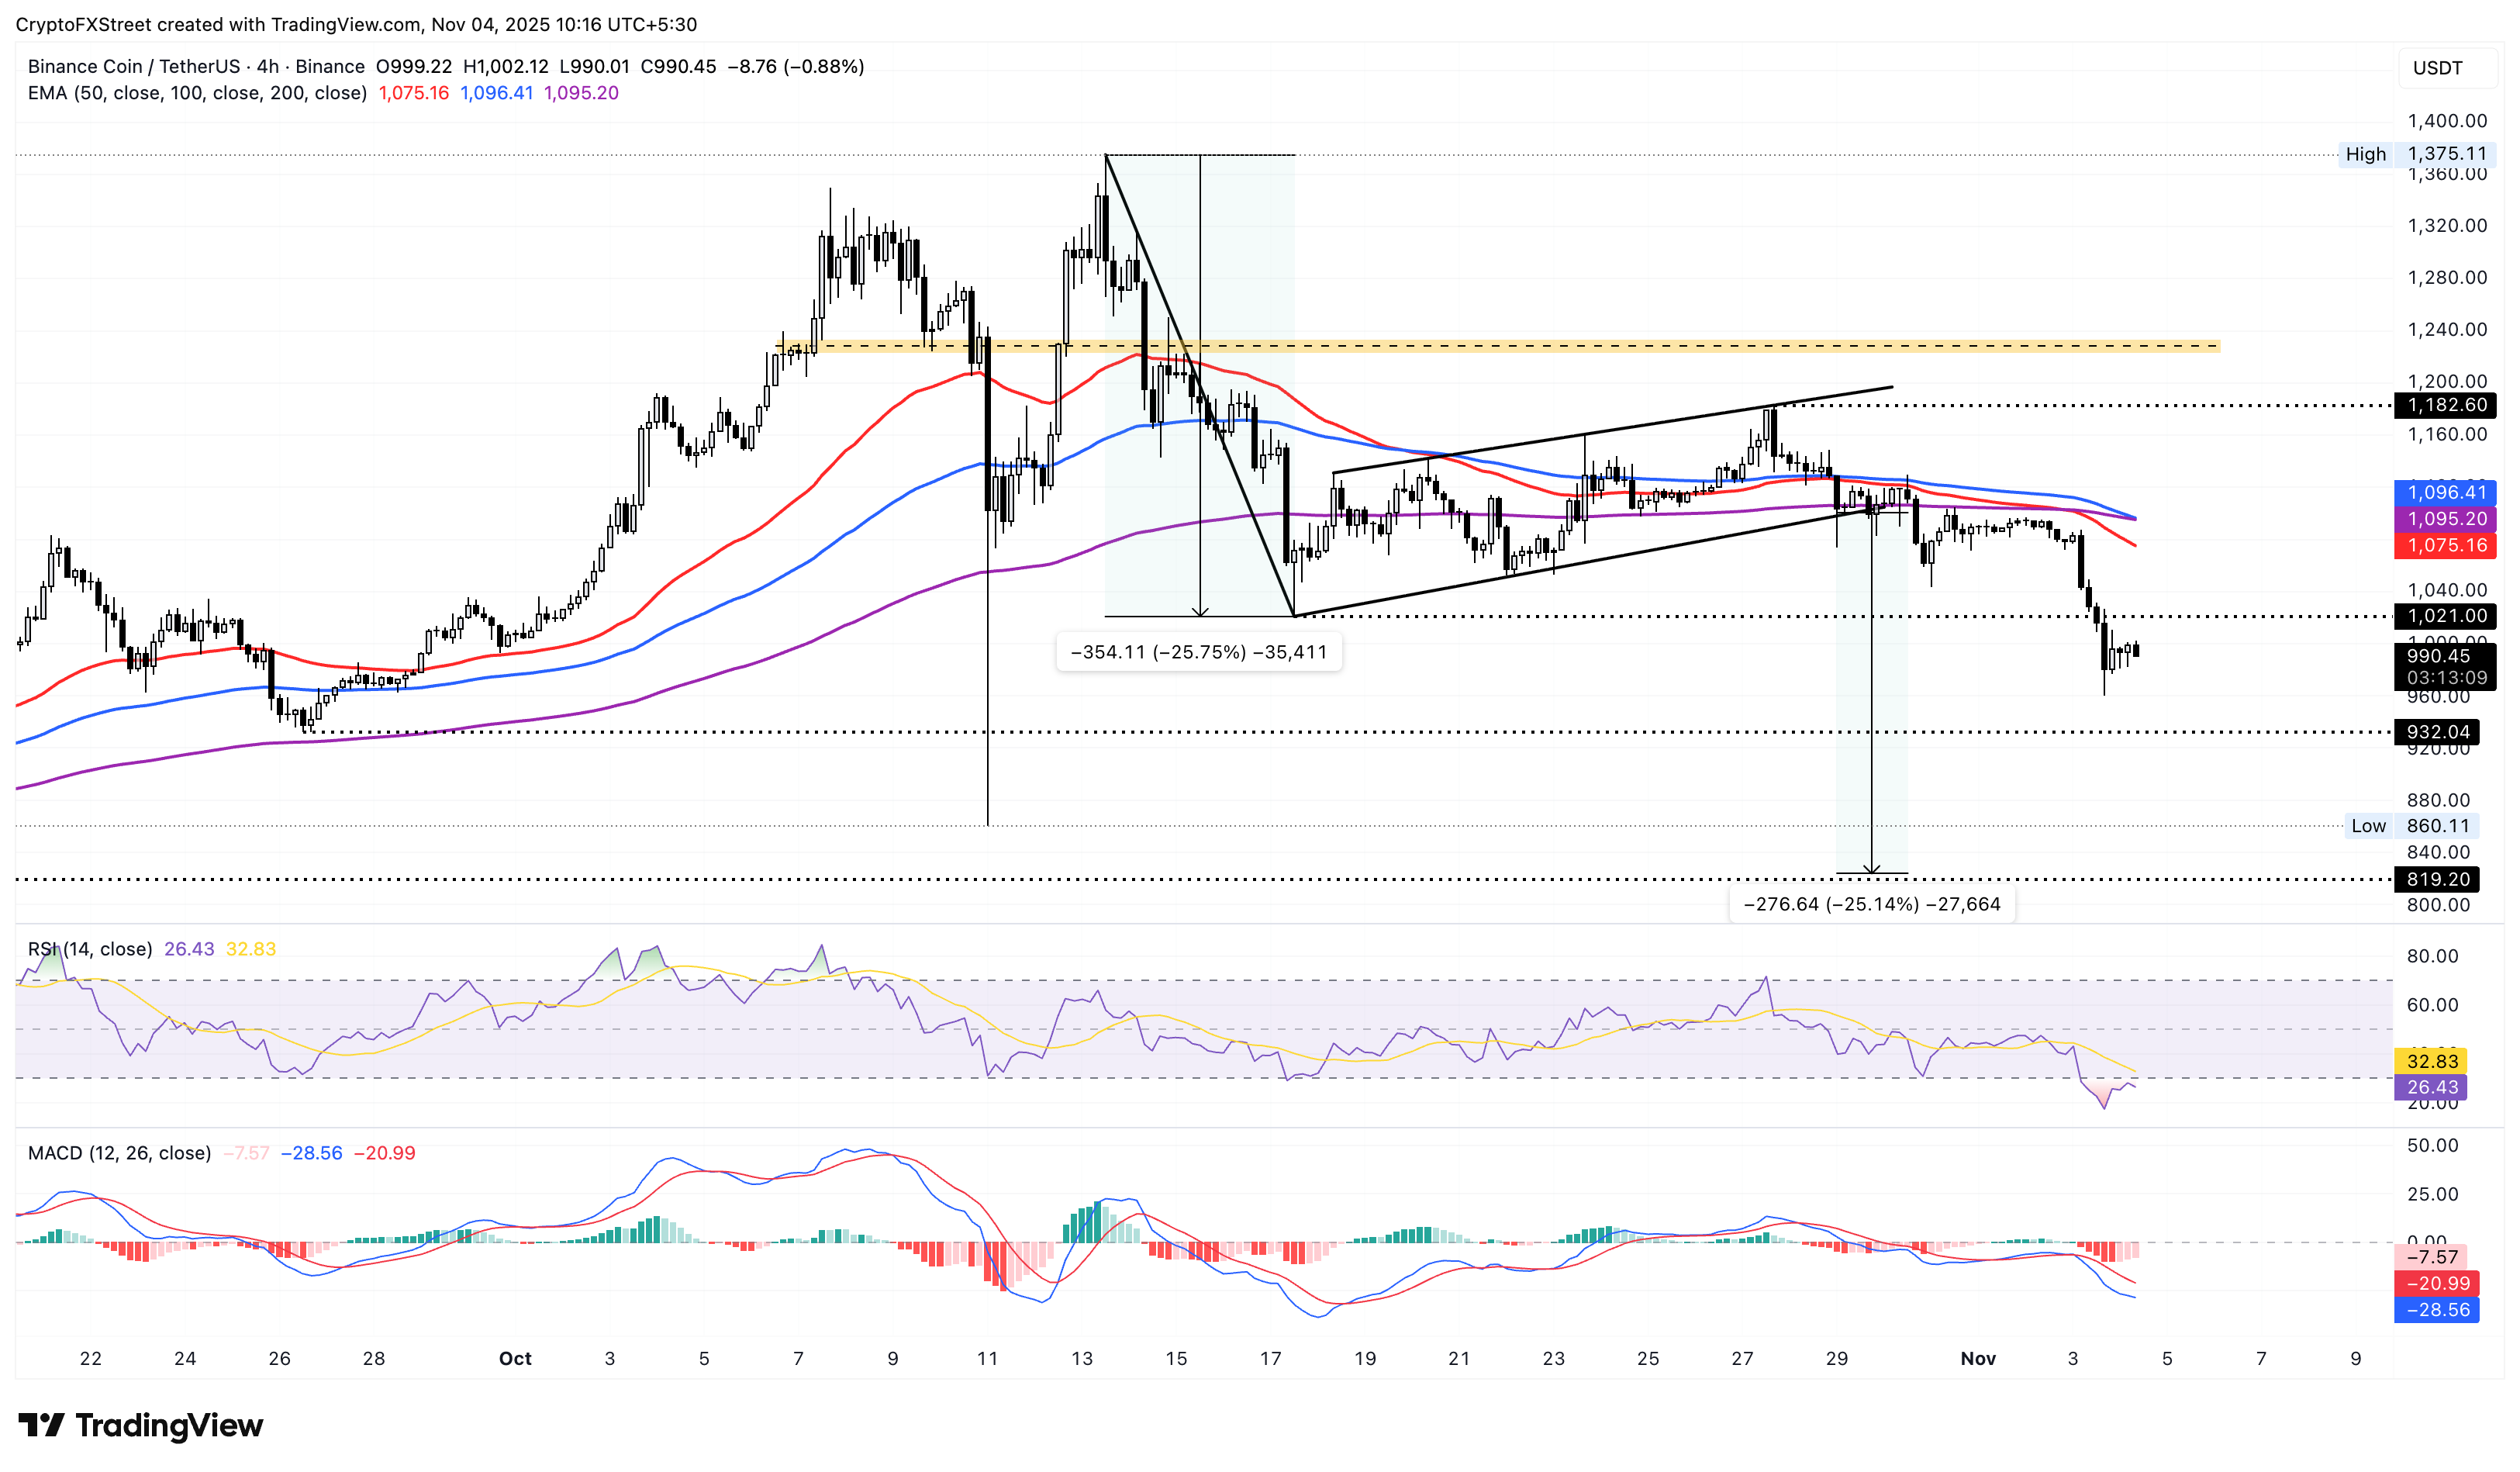
BNB/USDT 4-hour price chart.
If BNB manages to resurface above the $1,000 level, the 50-period EMA at $1,075 would act as the immediate resistance.
Solana declines despite institutional support
Solana drop nearly 4% at press time on Tuesday, extending the 11% decline from Monday. Despite the US spot Solana Exchange Traded Funds (ETFs) recording $70.05 million of inflows on Monday, marking the highest and fourth consecutive day of positive flow.
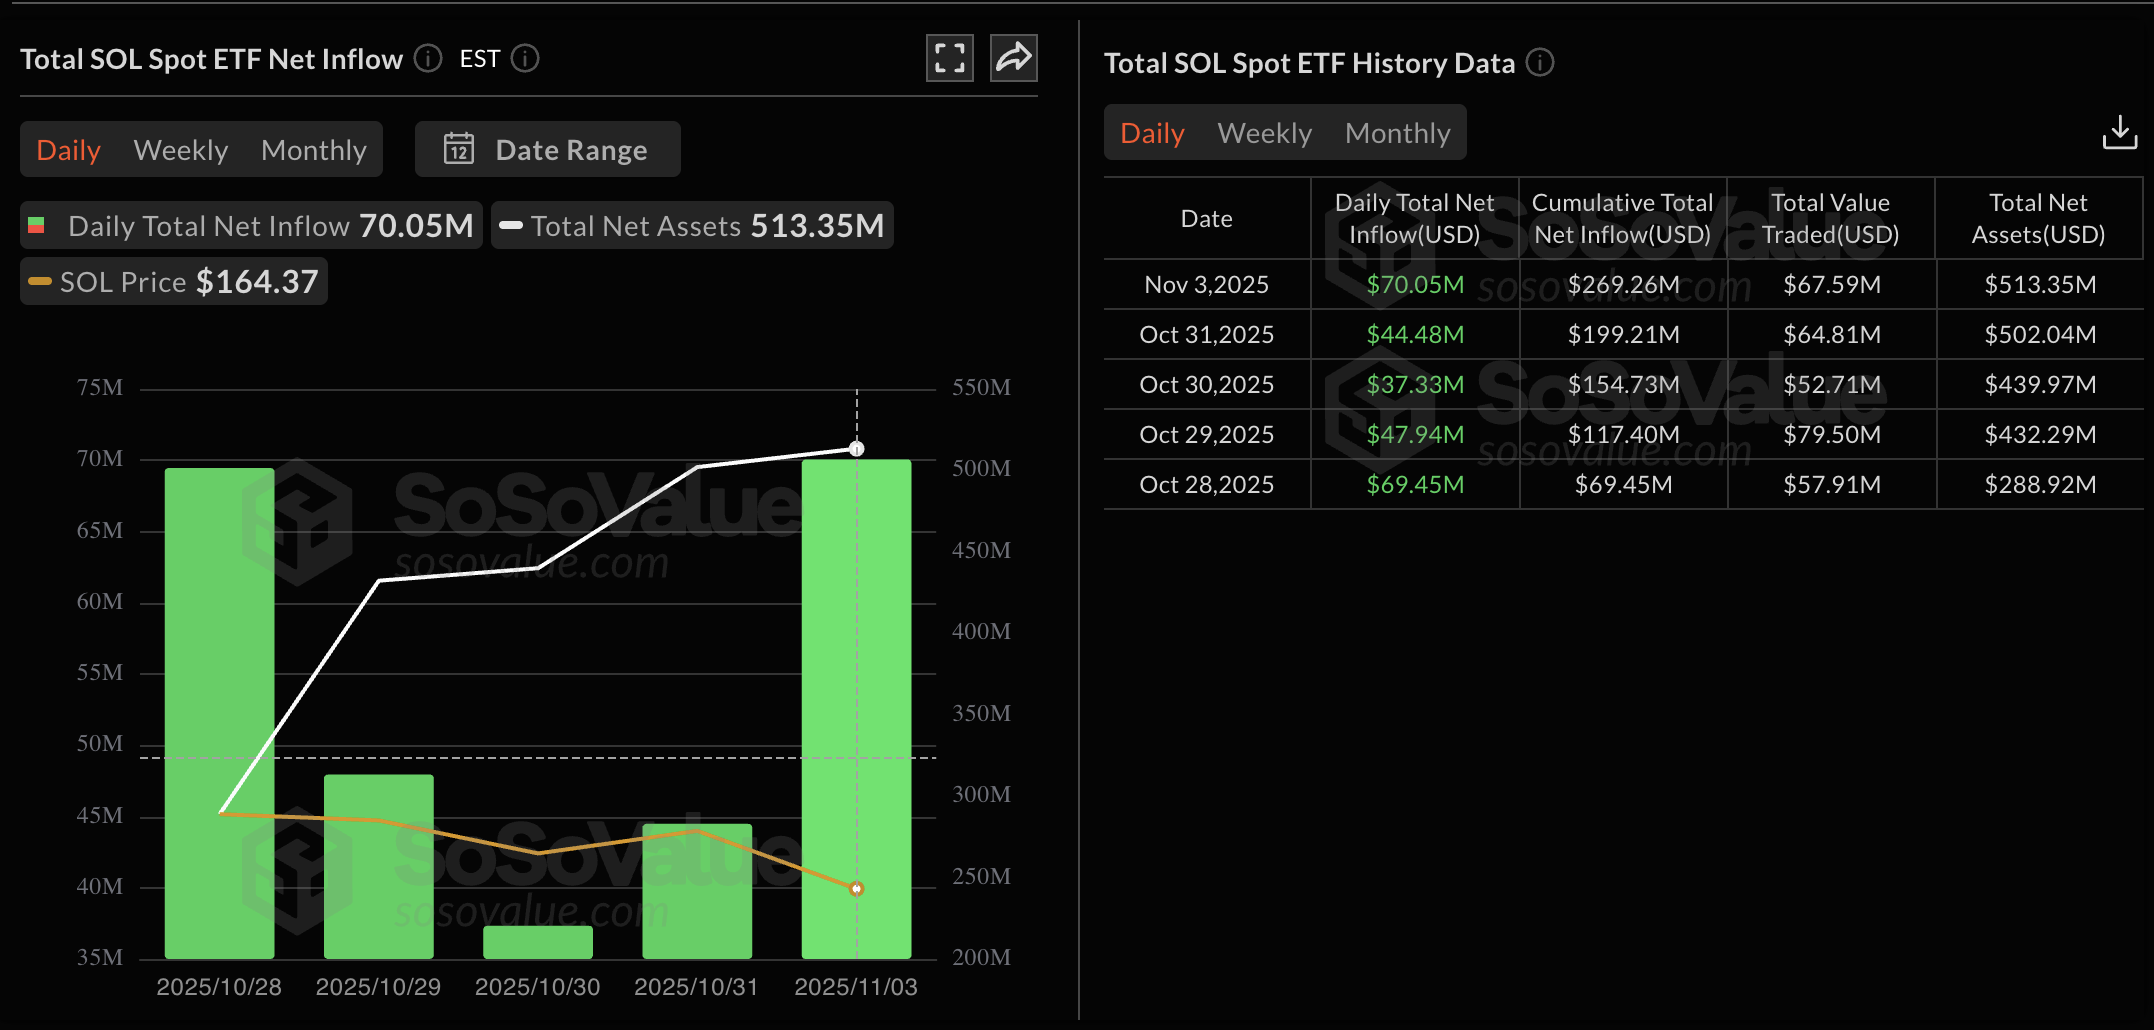
SOL spot ETFs inflows. Source: Sosovalue.
Still, the breakdown of a support trendline and the $174 zone on Monday warns of an extended correction to the $153 support zone.
Amid the decline, the 50-day EMA risks a bearish crossover with the 100-day EMA, considered a sell signal by the average lines.
Similar to XRP, the technical indicators suggest a renewed selling pressure in Solana, as the MACD crosses below the signal line and the RSI at 32 approaches the oversold zone.
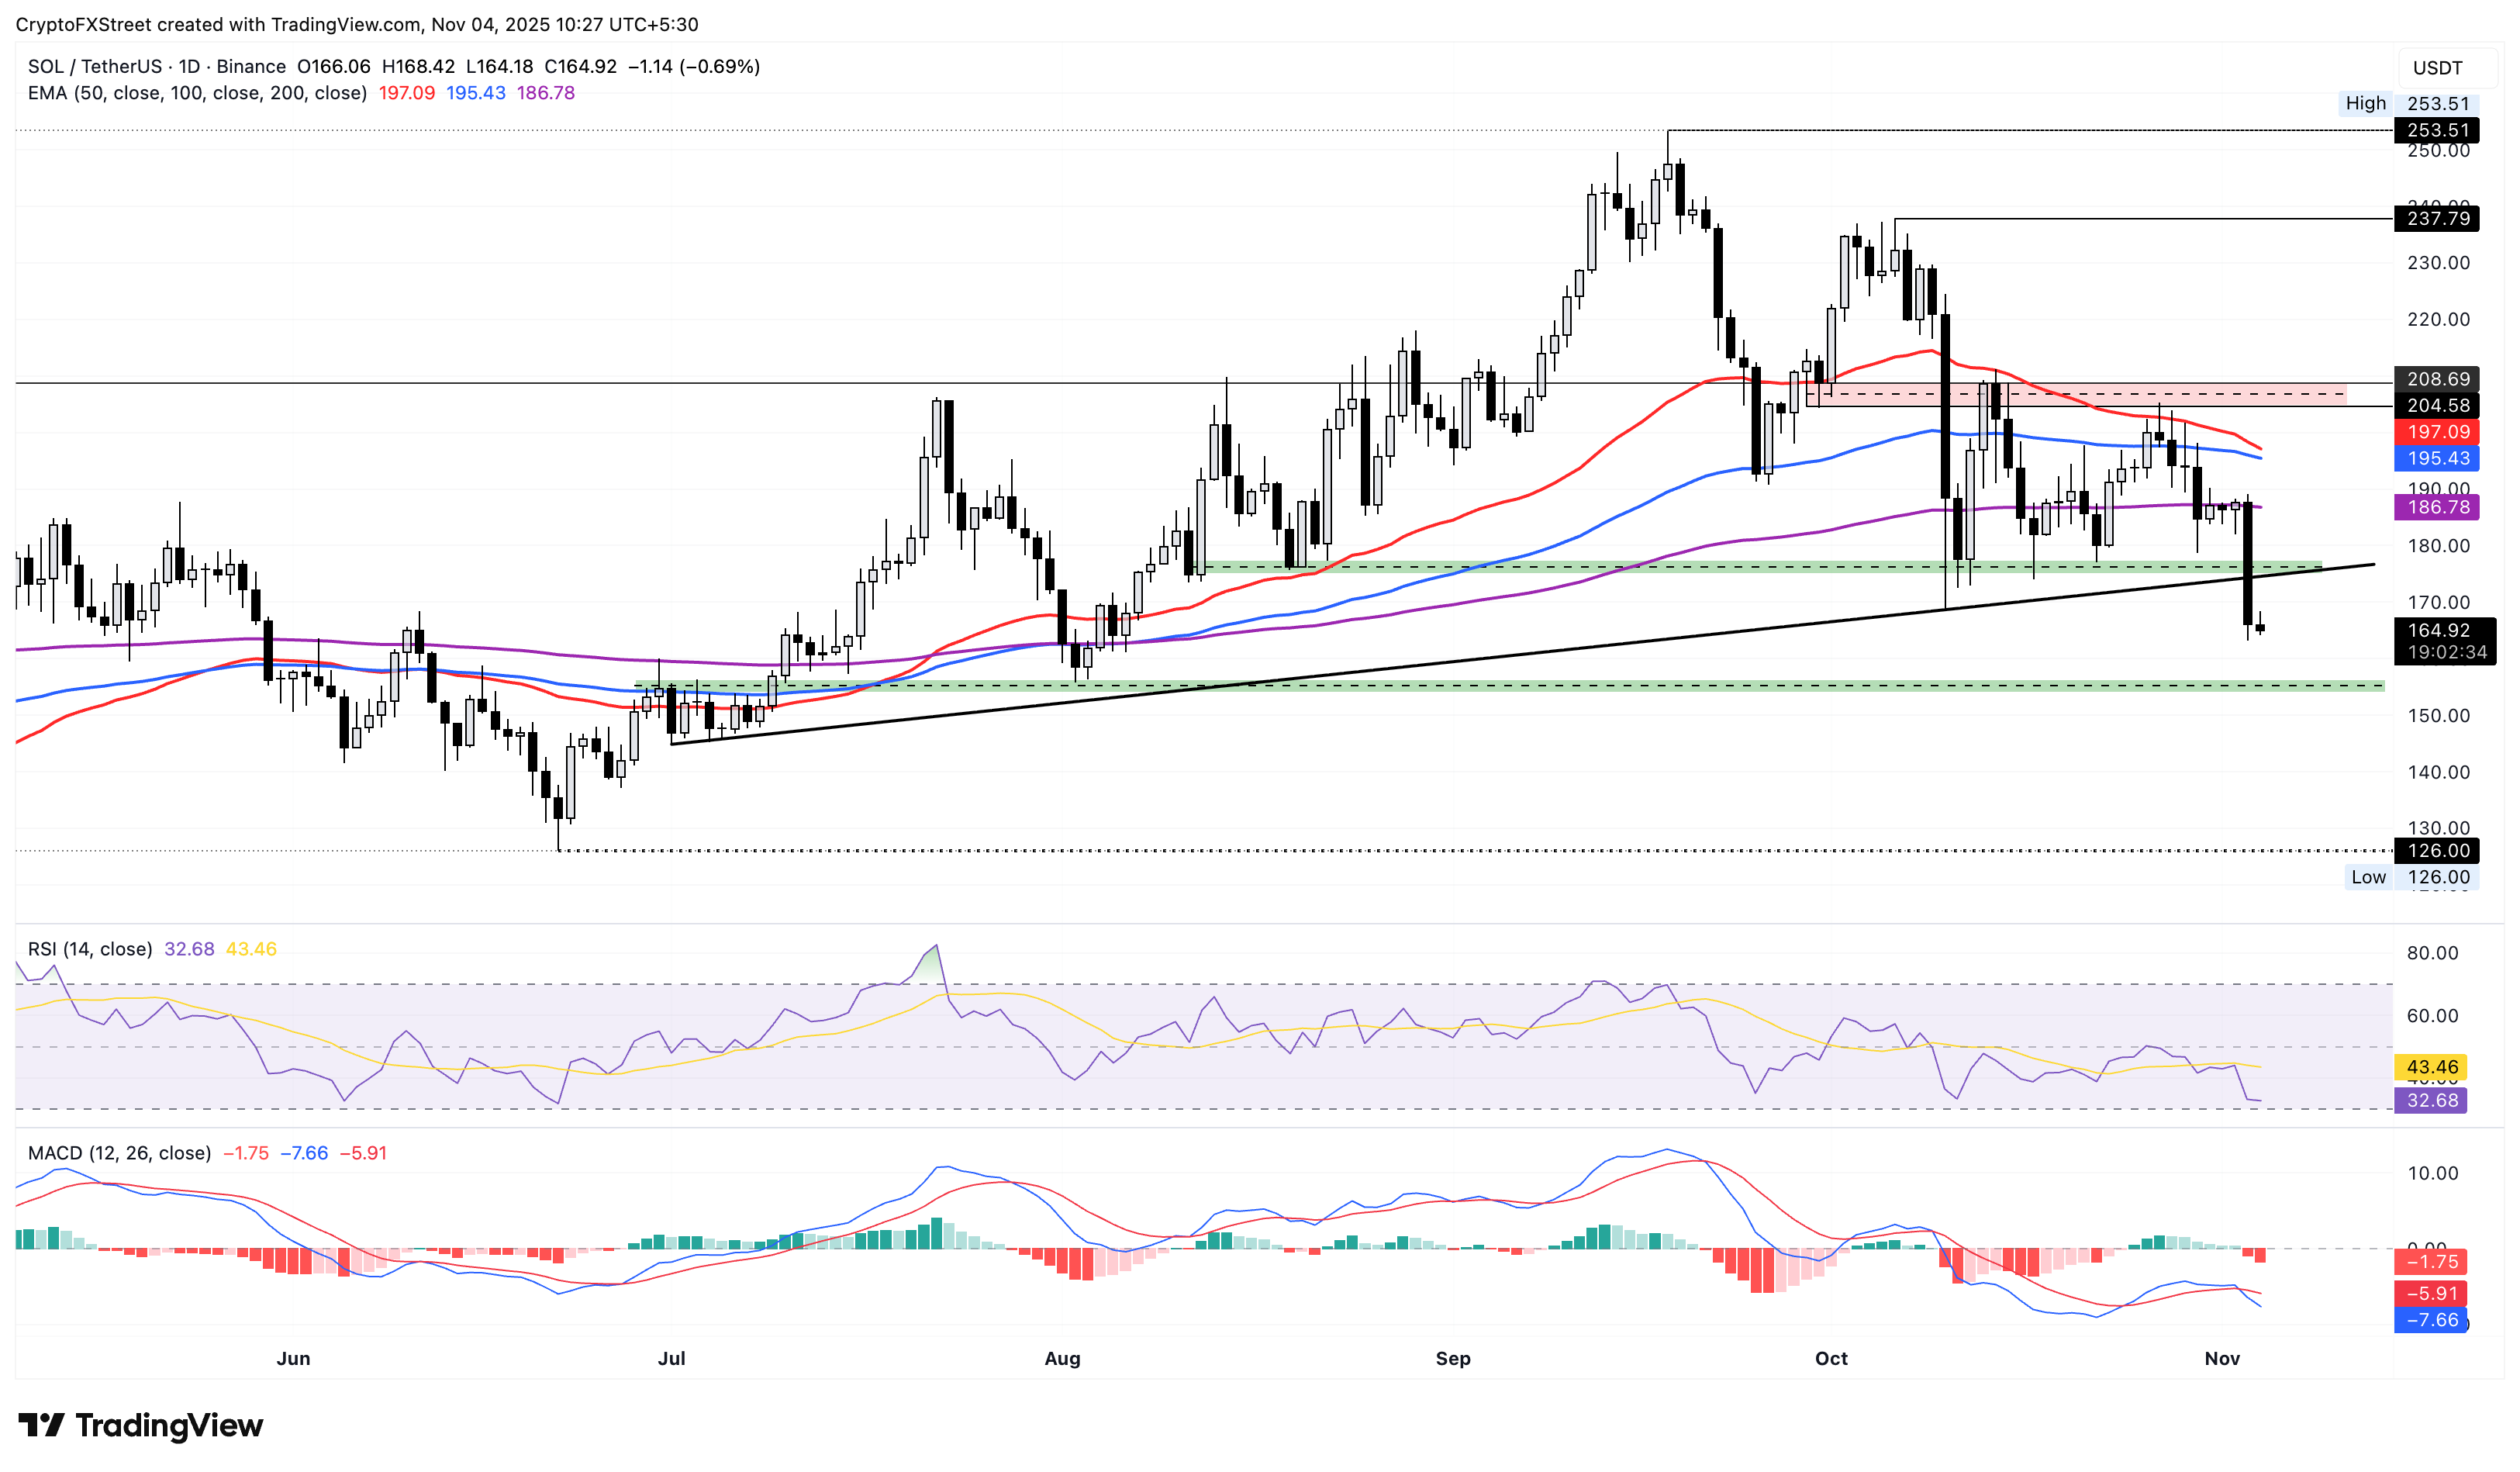
SOL/USDT daily price chart.
To reinforce an uptrend, SOL should surface above the $174 support-turned-resistance zone, potentially targeting the 200-day EMA at $186.
Read more
* The content presented above, whether from a third party or not, is considered as general advice only. This article should not be construed as containing investment advice, investment recommendations, an offer of or solicitation for any transactions in financial instruments.


