
Ripple Price Forecast: XRP bulls wake up as institutional, retail investors risk demand returns
- XRP reclaims $2.40, mirroring bullish sentiment across the cryptocurrency market.
- Whales buy XRP amid volatility, improving short to medium-term bullish outlook.
- Retail investors eye opportunities in the derivatives market as the XRP Open Interest weighted funding rate rebounds.
Ripple (XRP) shows signs of recovery, trading above $2.40 at the time of writing on Thursday. The current bullish outlook can be attributed to institutional and retail interest, which has gradually increased over the past two weeks despite volatility.
XRP whales increase risk exposure
Large-volume holders of XRP, particularly whales holding between 1 million and 10 million tokens, are piling into the token as the price fluctuates. Santiment data shows that this whale cohort began buying XRP before the October 10 deleveraging event, which liquidated $19 billion in crypto assets. The whales currently hold 12.65% of the total XRP supply, up from 12.16% on October 6.
The next whale cohort, with between 10 million and 100 million tokens, has gradually increased its holdings to 10.07% of the total supply from 9.97% on October 8. Steady demand for XRP is key to sustaining the uptrend, as buying pressure overshadows demand.
 [18-1761235856093-1761235856093.17.13, 23 Oct, 2025].png)
XRP Supply Distribution metric | Source: Santiment
Meanwhile, retail interest in XRP also expanded amidst price fluctuations. CoinGlass data shows that the futures Open Interest (OI)- weighted funding rate stood at 0.0042% on Thursday, up from -0.0007% on Wednesday.
The weighted funding rate plummeted to -0.2040% on October 11, reflecting extreme risk-off sentiment after the sell-off to $1.25 on October 10.
A sustained recovery in the OI Weighted Funding Rate metric suggests that more traders are increasing their risk exposure, piling into long positions.
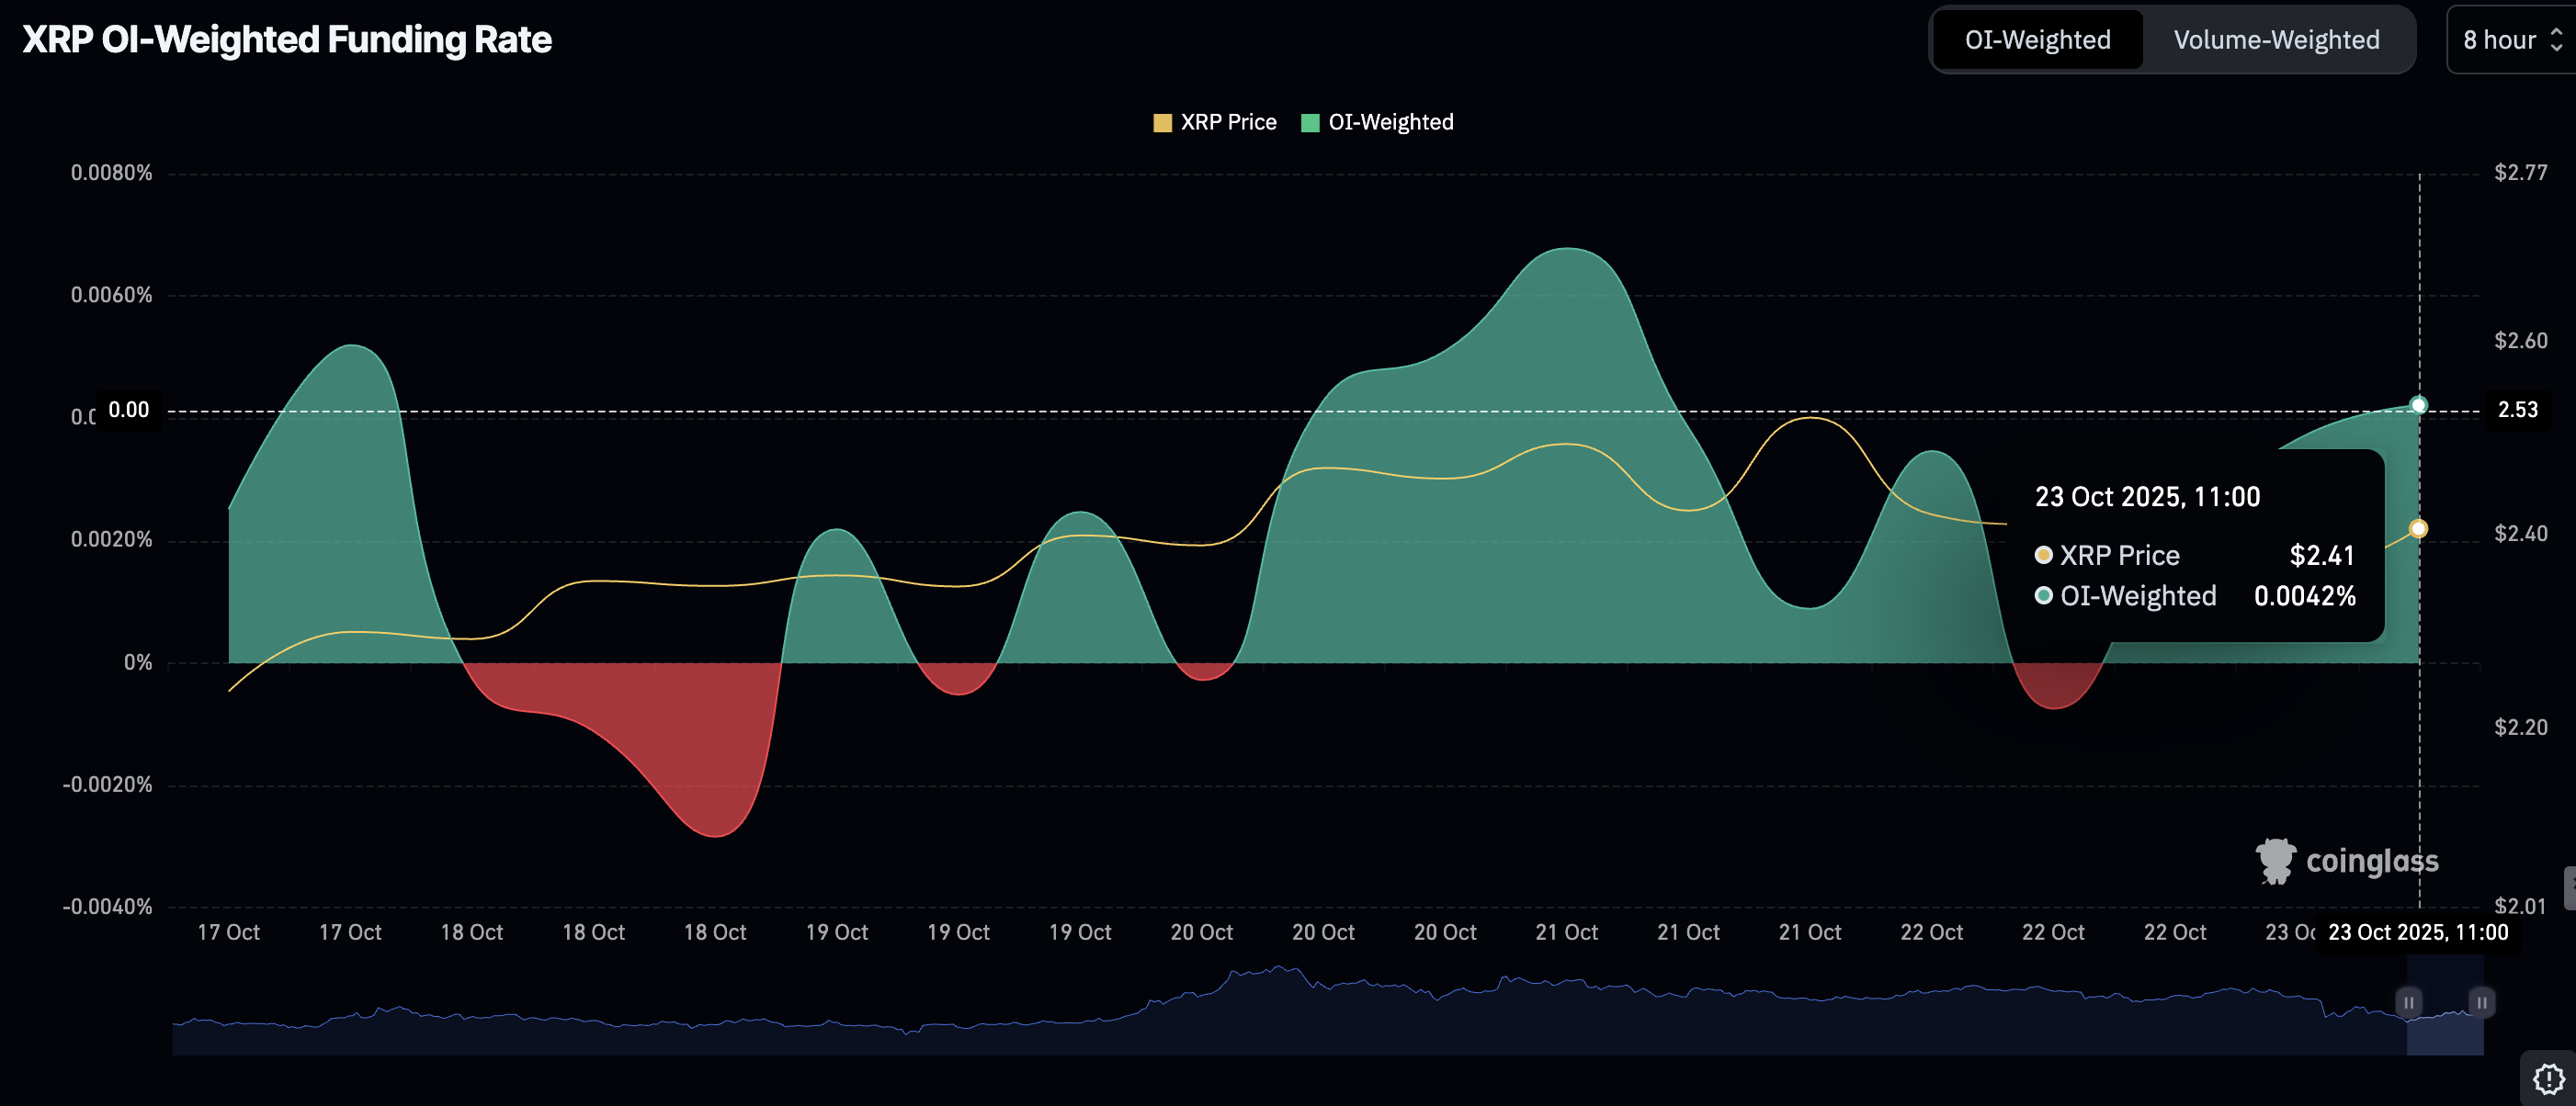
XRP Futures OI Weighted Funding Rate metric | Source: CoinGlass
Technical outlook: XRP eyes steady recovery
XRP is building on its short-term support at $2.40 as risk-on sentiment improves in the broader cryptocurrency market. An upward-trending Relative Strength Index (RSI) at 40 on the daily chart indicates that bullish momentum is increasing. Traders should monitor the RSI, as a recovery above the midline would indicate strong momentum.
The Moving Average Convergence Divergence (MACD) indicator on the same daily chart is on the verge of validating a buy signal. The blue MACD line must cross and settle above the red signal line as the indicator moves higher, encouraging traders to increase their risk exposure.
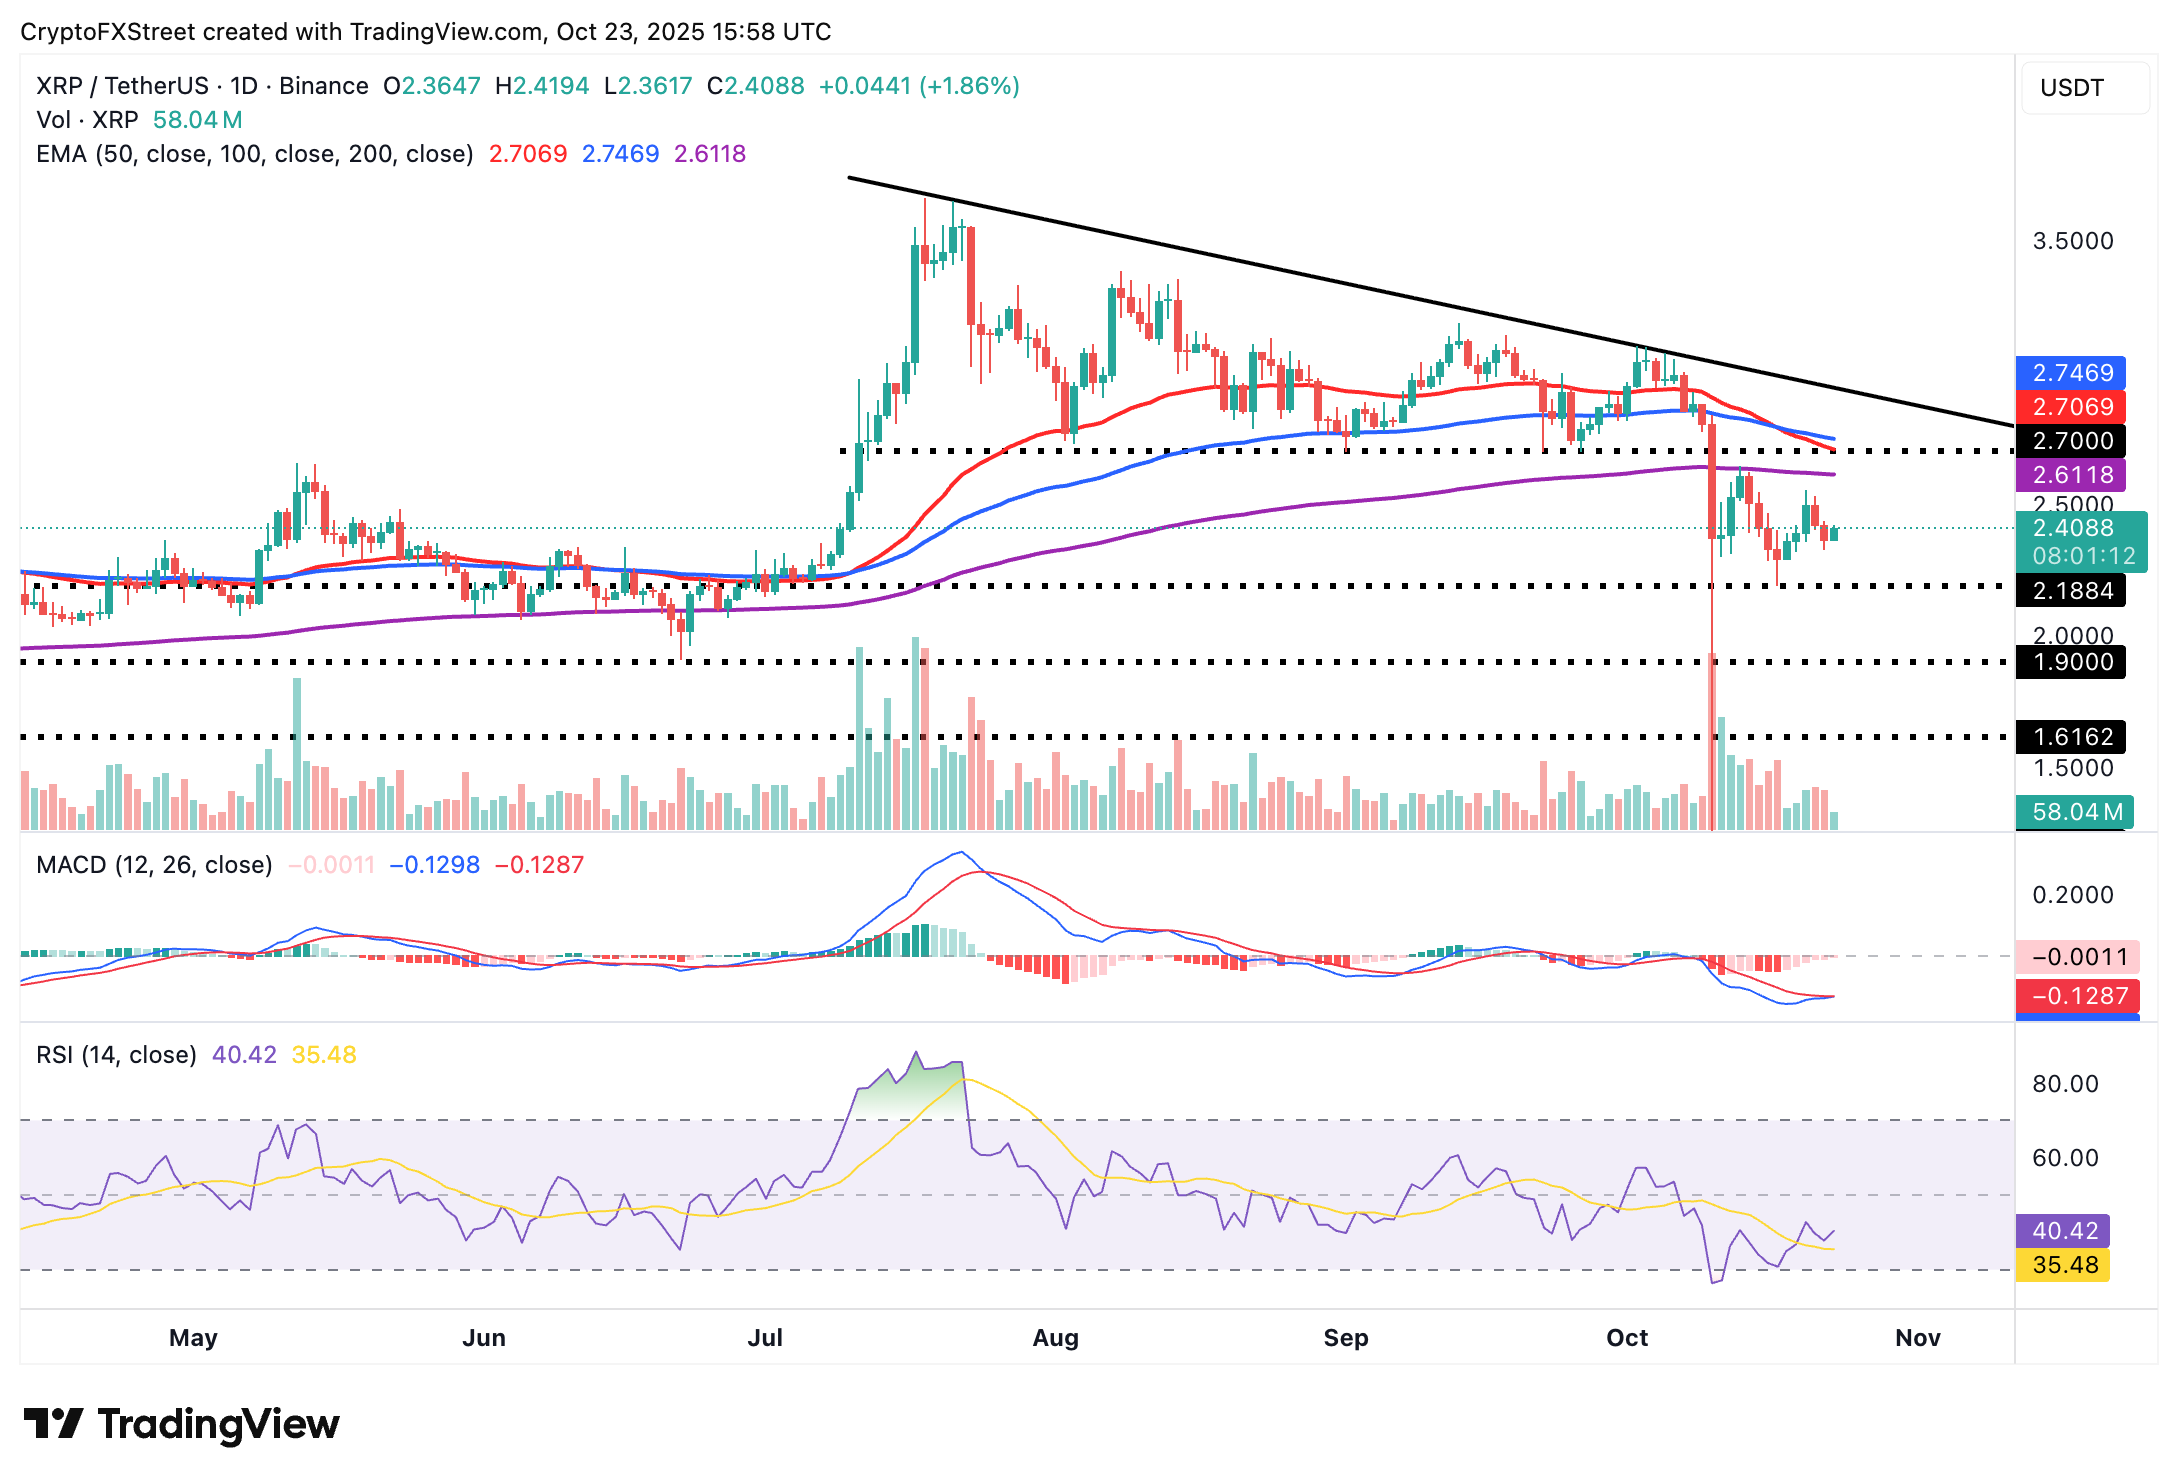
XRP/USDT daily chart
Key milestones include a sustained break above $2.50 round-number level, the 200-day Exponential Moving Average (EMA) at $2.61 and the 50-day EMA at $2.70, all of which could signal profit-taking if XRP shows weakness during the uptrend.
The short-term $2.40 support is key to a steady uptrend, likely preventing a reversal to the next demand area at $2.18, which was tested last Friday.
Cryptocurrency metrics FAQs
The developer or creator of each cryptocurrency decides on the total number of tokens that can be minted or issued. Only a certain number of these assets can be minted by mining, staking or other mechanisms. This is defined by the algorithm of the underlying blockchain technology. On the other hand, circulating supply can also be decreased via actions such as burning tokens, or mistakenly sending assets to addresses of other incompatible blockchains.
Market capitalization is the result of multiplying the circulating supply of a certain asset by the asset’s current market value.
Trading volume refers to the total number of tokens for a specific asset that has been transacted or exchanged between buyers and sellers within set trading hours, for example, 24 hours. It is used to gauge market sentiment, this metric combines all volumes on centralized exchanges and decentralized exchanges. Increasing trading volume often denotes the demand for a certain asset as more people are buying and selling the cryptocurrency.
Funding rates are a concept designed to encourage traders to take positions and ensure perpetual contract prices match spot markets. It defines a mechanism by exchanges to ensure that future prices and index prices periodic payments regularly converge. When the funding rate is positive, the price of the perpetual contract is higher than the mark price. This means traders who are bullish and have opened long positions pay traders who are in short positions. On the other hand, a negative funding rate means perpetual prices are below the mark price, and hence traders with short positions pay traders who have opened long positions.
Recommended Articles


