


Dow Jones Industrial Average pares losses on Thursday as markets stop the slide
- The Dow Jones rose back above 46,600 on Thursday, trimming the previous session’s losses.
- The Dow still remains in the green for the week, after a brief pullback from fresh record highs.
- Key US CPI inflation data is in the barrel to end the week, and could complicate market hopes for rate cuts.
The Dow Jones Industrial Average (DJIA) found slim gains on Thursday, climbing around 150 points and clawing back some of the losses that pummeled the major equity index the previous session. Investors remain leery of a fresh steepening of the ongoing trade spat between the US and China, but another bumper earnings season and hopes for additional Federal Reserve (Fed) interest rate cuts are keeping investors on the bullish side.
Crude Oil prices surged on Thursday after China announced it would be suspending Oil purchases from Russia in the face of fresh sanctions from the US targeting major Russian Oil distributors. A rapid surge in Oil costs has sparked fresh concerns that inflation could develop into a complex problem for the Federal Reserve (Fed), which is actively seeking to deliver another two quarter-point interest rate cuts before the end of the calendar year. However, a sharp rise in energy costs could waylay the central bank as the US inflation landscape
US-China trade war worries remain in play
The move comes at a time when China stands to gain from handing a fig leaf to the Trump administration, which is still actively saber-rattling against China over trade disputes both real and imagined. Barring any last-minute changes or further social media proclamations from President Donald Trump, the US is heading into imposing another 155% tariff on Chinese goods imported into the US, as well as new export controls on Chinese purchases of US-produced software, to begin on November 1.
Earnings season continues to bolster investor confidence despite a few key misses. Tesla (TSLA) dropped 4% after a messy third-quarter earnings report, but around 80% of all S&P-listed companies that have posted Q3 earnings thus far have exceeded analyst expectations.
Next up: US CPI inflation
US Consumer Price Index (CPI) inflation is due on Friday and could add further pressure to rate cut hopes if the numbers come out hot. A general uptick in inflation has been brewing in the data for several months, complicating the Fed’s desired path toward its 2% inflation target and further interest rate cuts.
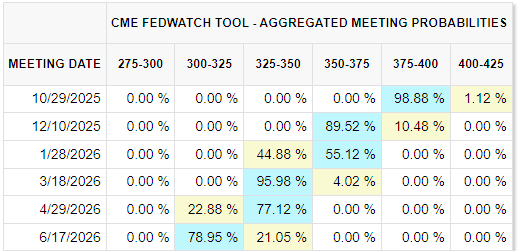
For the time being, rate watchers are still firmly entrenched in their faith in two more rate cuts through the end of the year. At the current cut, the CME’s FedWatch Tool shows that rate betters see a scant 1% chance that the Fed will keep interest rates unchanged at its upcoming rate-setting meeting, which concludes on October 29.
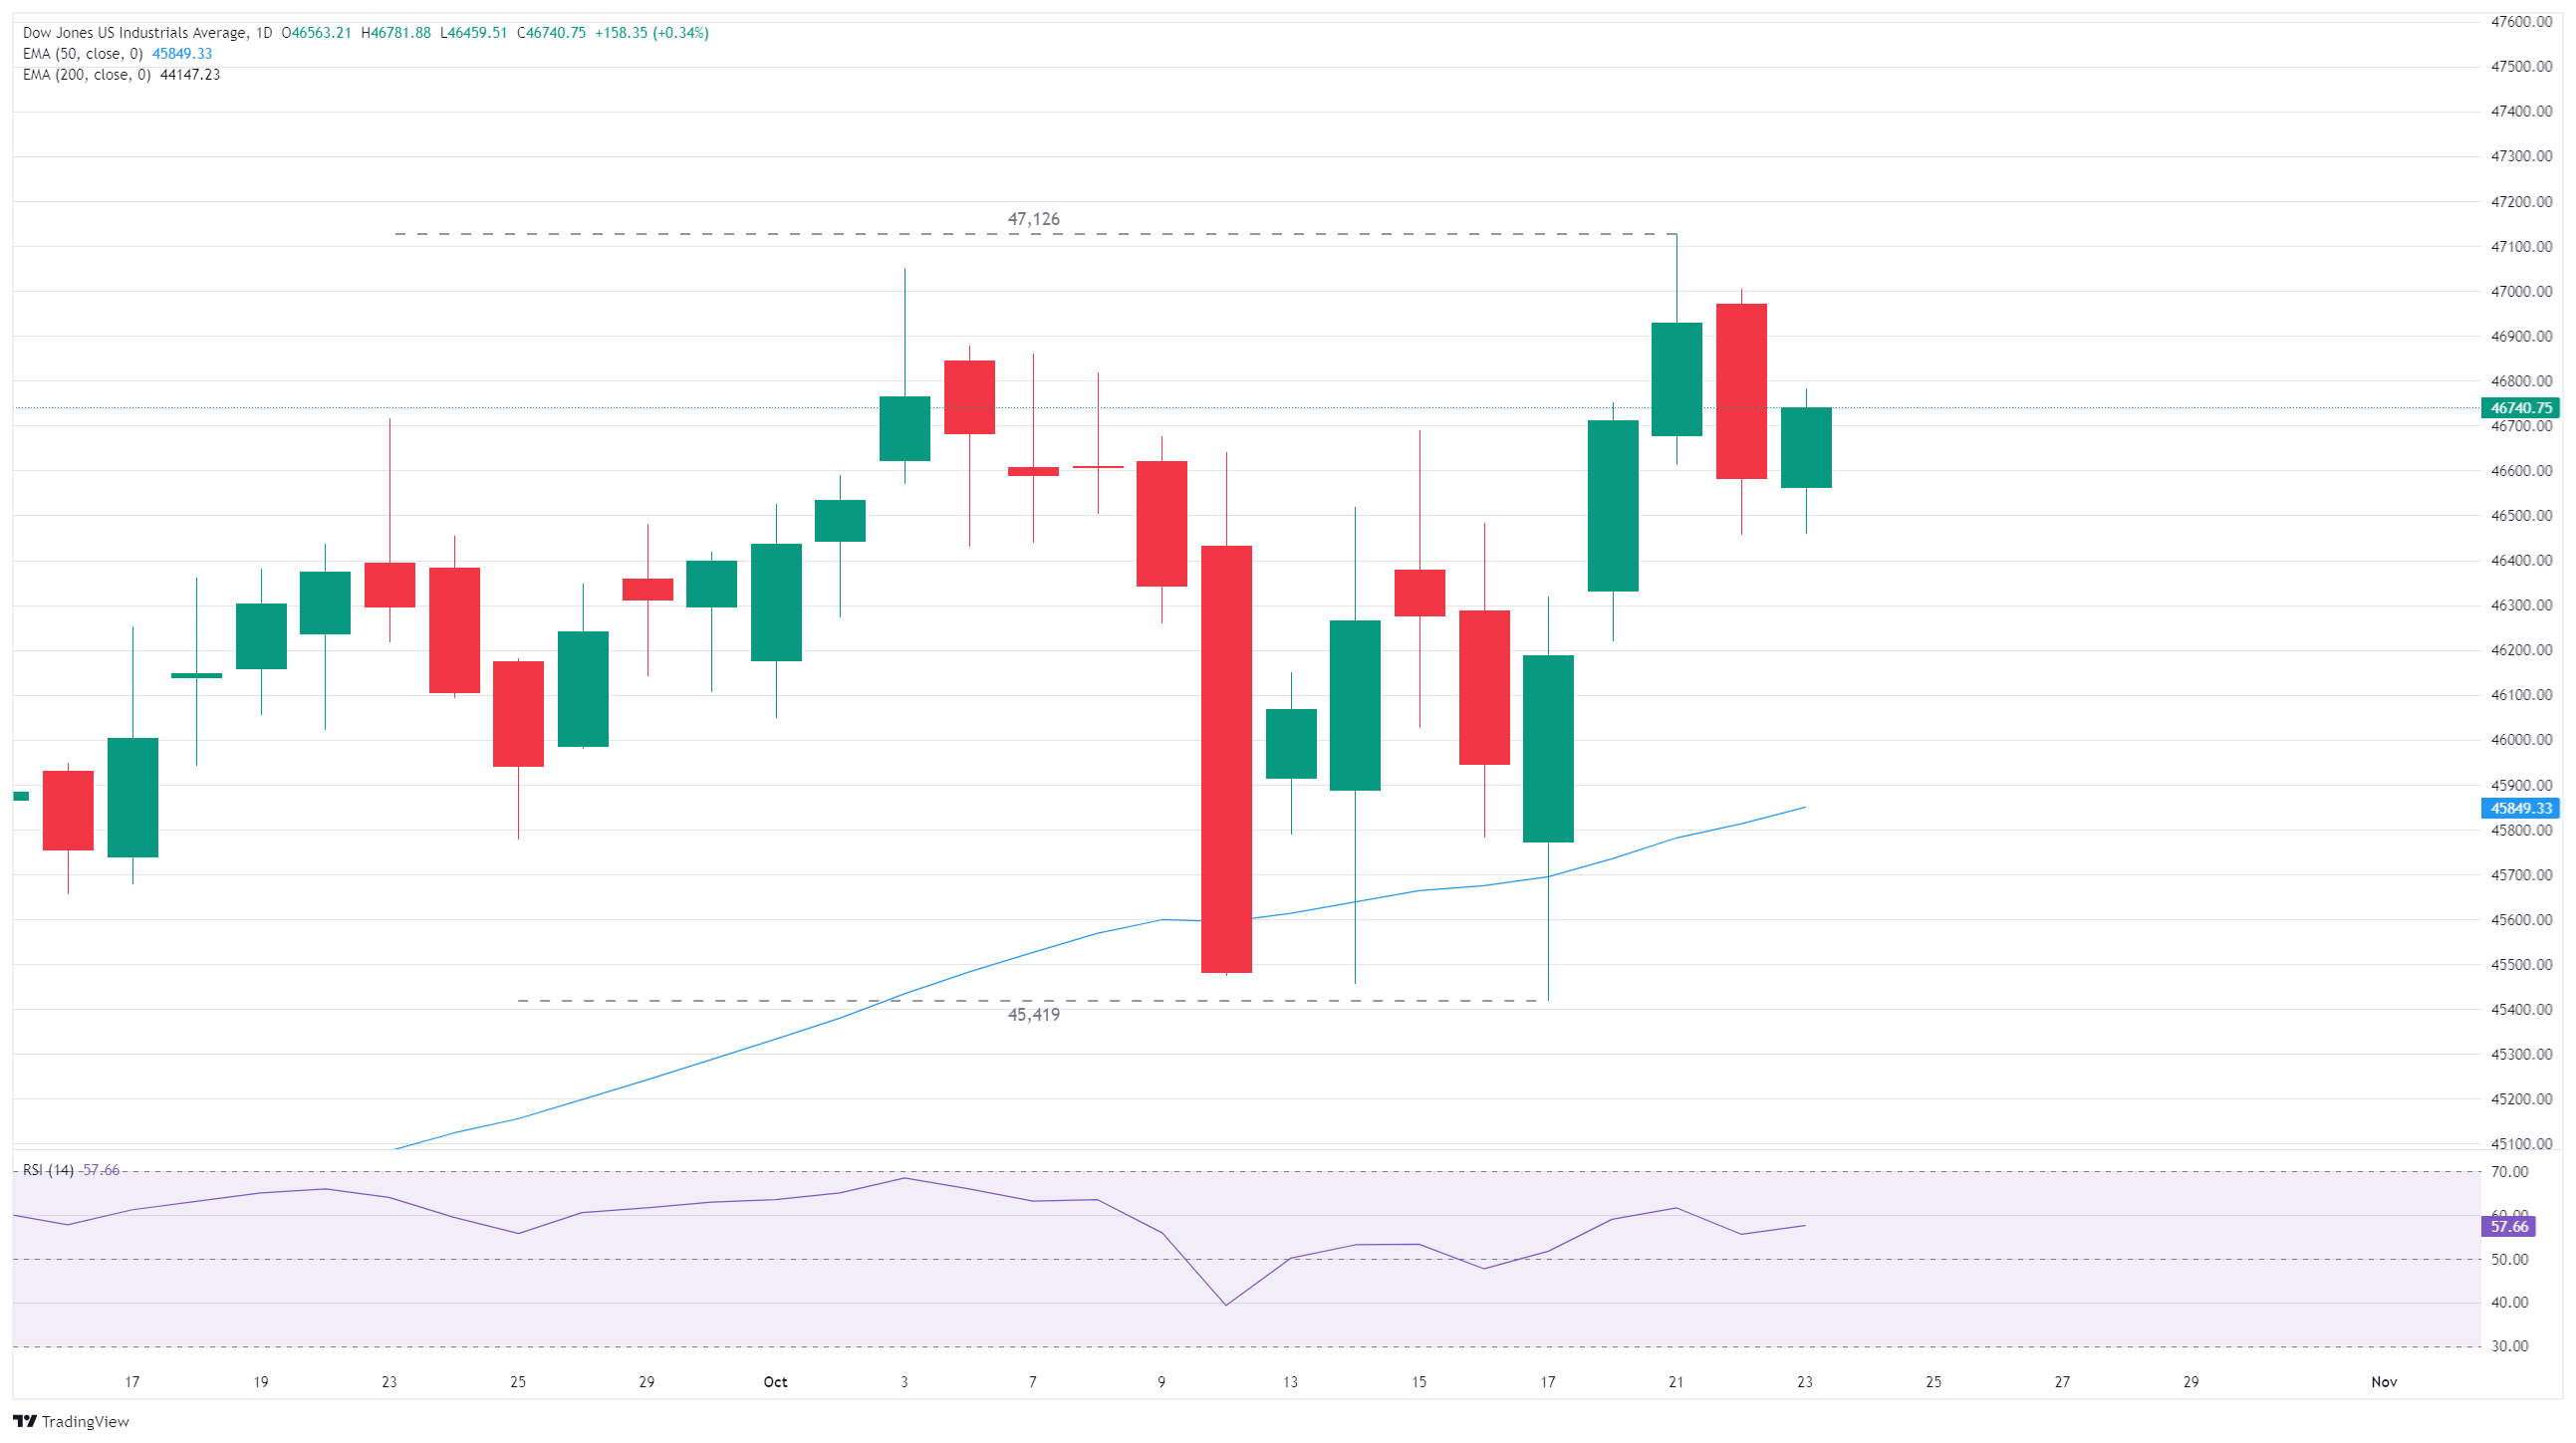
Dow Jones daily chart
Dow Jones FAQs
The Dow Jones Industrial Average, one of the oldest stock market indices in the world, is compiled of the 30 most traded stocks in the US. The index is price-weighted rather than weighted by capitalization. It is calculated by summing the prices of the constituent stocks and dividing them by a factor, currently 0.152. The index was founded by Charles Dow, who also founded the Wall Street Journal. In later years it has been criticized for not being broadly representative enough because it only tracks 30 conglomerates, unlike broader indices such as the S&P 500.
Many different factors drive the Dow Jones Industrial Average (DJIA). The aggregate performance of the component companies revealed in quarterly company earnings reports is the main one. US and global macroeconomic data also contributes as it impacts on investor sentiment. The level of interest rates, set by the Federal Reserve (Fed), also influences the DJIA as it affects the cost of credit, on which many corporations are heavily reliant. Therefore, inflation can be a major driver as well as other metrics which impact the Fed decisions.
Dow Theory is a method for identifying the primary trend of the stock market developed by Charles Dow. A key step is to compare the direction of the Dow Jones Industrial Average (DJIA) and the Dow Jones Transportation Average (DJTA) and only follow trends where both are moving in the same direction. Volume is a confirmatory criteria. The theory uses elements of peak and trough analysis. Dow’s theory posits three trend phases: accumulation, when smart money starts buying or selling; public participation, when the wider public joins in; and distribution, when the smart money exits.
There are a number of ways to trade the DJIA. One is to use ETFs which allow investors to trade the DJIA as a single security, rather than having to buy shares in all 30 constituent companies. A leading example is the SPDR Dow Jones Industrial Average ETF (DIA). DJIA futures contracts enable traders to speculate on the future value of the index and Options provide the right, but not the obligation, to buy or sell the index at a predetermined price in the future. Mutual funds enable investors to buy a share of a diversified portfolio of DJIA stocks thus providing exposure to the overall index.
Recommended Articles


