
Bitcoin Price Wedged Between 2 Crucial levels — What To Expect In Coming Days
Despite the red-hot start to the month, the historically bullish “Uptober” period has not particularly gone according to the expectations for the Bitcoin price. Following the market-wide downturn on October 10, the premier cryptocurrency has not been able to mount a clear recovery back to its former highs.
In fact, the Bitcoin price action continues to struggle under lasting bearish pressure, falling to a new low around $103,000 on Friday, October 18. With uncertainty taking over the market, investors are left wondering whether the bull run is over or the sluggish action is a minor blip.
According to a recent outlook, the current technical position of the BTC price could offer insight into its next step.
BTC At Risk Of Deeper Correction If It Loses $99,900 Support
In an October 17 post on the social media platform X, Glassnode put forward an interesting evaluation of the current Bitcoin price setup. The prominent crypto analytics firm revealed that the flagship cryptocurrency is currently sitting between two major support zones.
This analysis is based on the Glassnode Technical Pricing Model, a chart containing a number of technical indicators, including the Pi Cycle indicator, the Mayer Multiple, the Yearly Moving Average (MA), and the 200-Week Moving Average.
According to Glassnode, the Bitcoin price is currently wedged between the Mayer Multiple ($107,400) and the Yearly MA ($99,900).
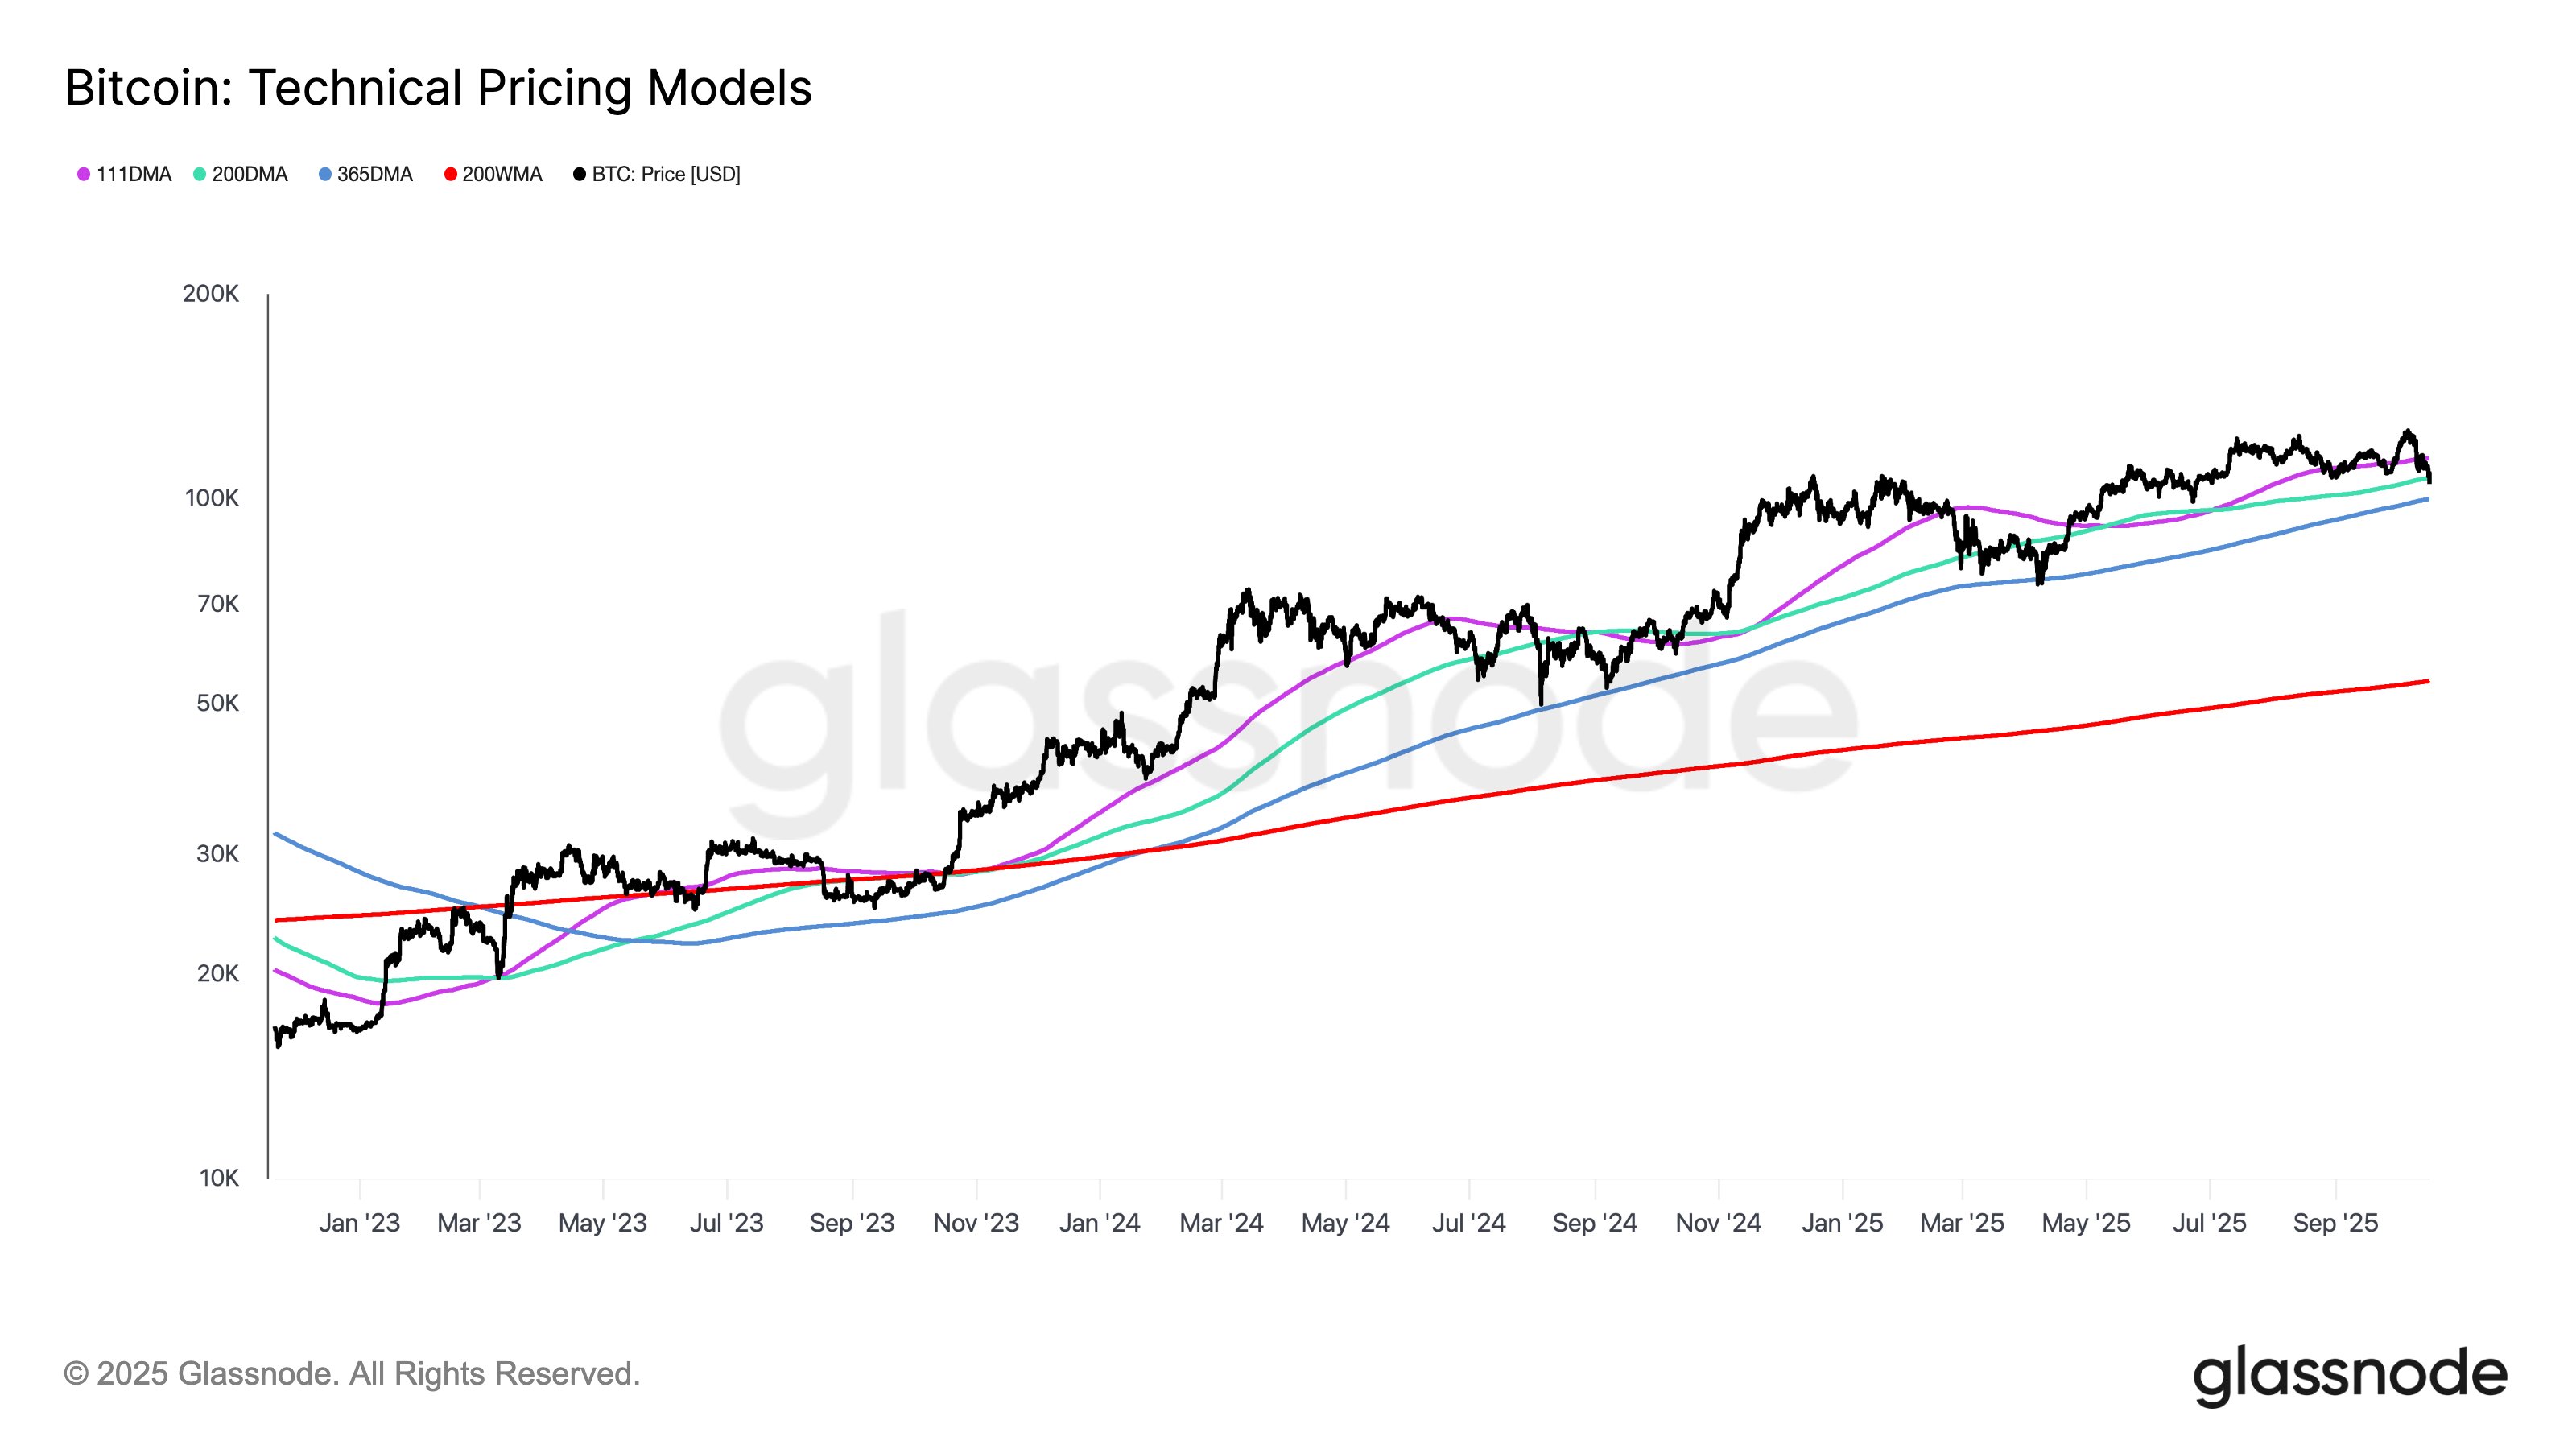
The Mayer Multiple (200-Day Simple Moving Average) is a popular technical indicator often linked with the transition point between a bull and bear market. Meanwhile, the 365 Day SMA offers a long-standing baseline for high-timeframe market momentum.
Following the latest dip, the Bitcoin price slipped beneath the 200-day Moving Average, signaling a possible shift from a bullish market condition to a bearish one. While BTC still holds above the 365-day MA, the premier cryptocurrency needs to stay above this level to steady the current trend.
Ultimately, investors might want to keep an eye on the BTC price, as a break beneath the $99,900 level could spell much bigger trouble for the world’s largest cryptocurrency. It is worth noting that a return to above the Mayer Multiple could be significant for Bitcoin’s progression, albeit with price resistance around the 111-day moving average (currently at $114,700).
Bitcoin Price At A Glance
As of this writing, Bitcoin is valued at around $106,427, reflecting an almost 2% price drop in the past 24 hours.
Recommended Articles


