

SOL FUD Spreads, But Solana’s Technical Strength Tells a Different Story
Solana again finds itself in the spotlight after allegations of inflating its 100,000 TPS performance claim.
But what’s the real technical truth behind this controversy—and can the latest SOL Price FUD derail the network’s ongoing recovery?
When Technical Metrics Get Misunderstood
Following the Crypto Black Friday last week, Solana (SOL) highlighted the network’s resilience under extreme demand, reporting that “raw transactions spiked to 6,000–10,000 per second”. Meanwhile, Brennan Watt, Core Engineering VP at Anza, a Solana-focused software company, stated that the network handled up to 100,000 transactions per second (TPS). This performance occurred during the US tariff announcement–driven market volatility.
This immediately sparked a heated debate across social media. Several users accused Solana of “fabricating” the 100,000 TPS milestone.
“Solana couldn’t even keep their story straight. The official account accidentally posted the real TPS (raw 6k, actual 1,800 true TPS) before their engineer cooked up the fake 100k number.” One X user wrote.
Solana’s team and ecosystem contributors quickly reacted.
Matt Sorg, Technology VP at Solana Foundation, explained that validators ingest the 100,000 TPS figure as transactions. These include duplicates and reverted transactions not finalized on-chain, differing from Ethereum’s mempool filtering mechanism.
“It’s not useless for Solana. It’s understood in our technical world, and you’re right that it doesn’t have a direct comparison to Ethereum due to how the mempool works,” said Matt Sorg.
Similarly, Marcantonio, Head of DeFi at Galaxy, defended Solana’s metric as a valid measure of transaction ingress rate—indicating how much the validator pipeline can handle—not the number of finalized transactions. The technical nuance indicates that analysts misinterpreted the 100,000 TPS claim rather than it being fabricated. This reveals how competitors weaponize raw performance metrics in the ongoing Ethereum–Solana rivalry.
SOL Price Recovers Strongly: FUD Fails to Break the Trend
While the technical debate continues, the SOL price tells a different story—rallying sharply after the recent flash crash. According to multiple analysts, the $180 zone was previously a major resistance zone. Traders have successfully retested it as support, reinforcing Solana’s multi-year ascending trendline from 2022.
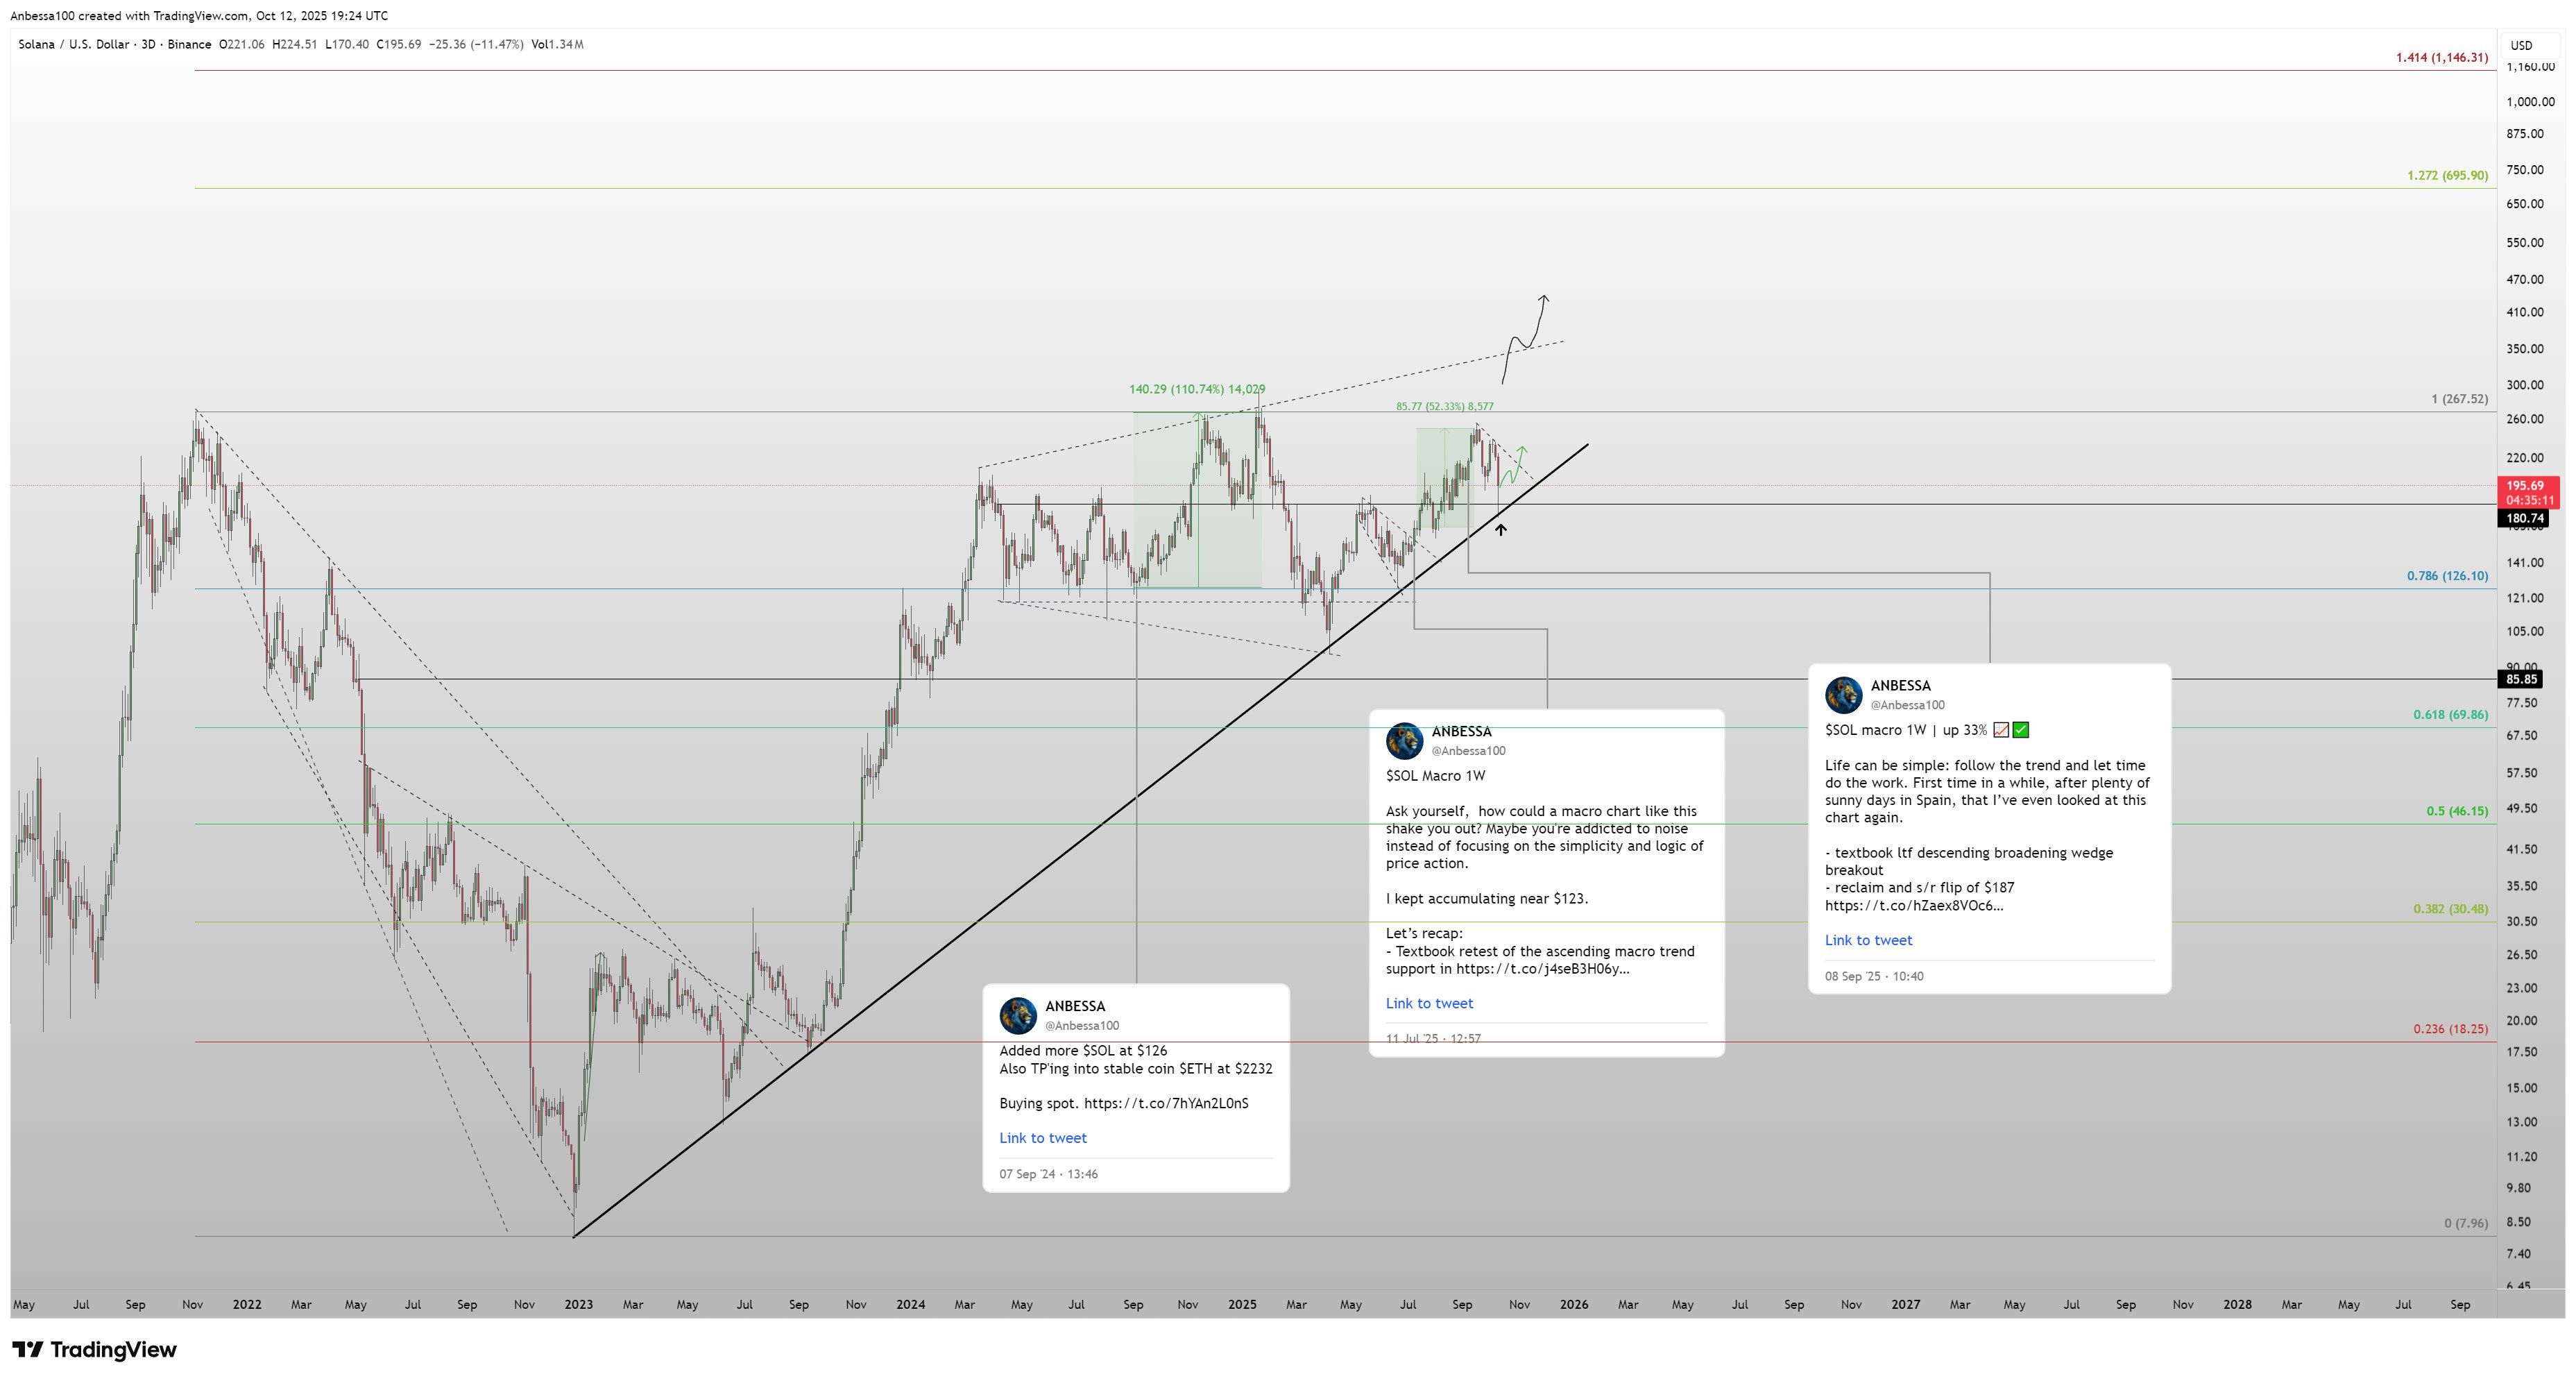 SOL/USD 3D Chart. Source: ANBESSA
In addition, the on-chain URPD data shared by X shows that the central accumulation zone at $224 has decreased from 7.47% (11/10) to 5.89% (13/10). This means that holders have taken profit on more than 18 million SOL and moved them to the support zone of $172-$197.
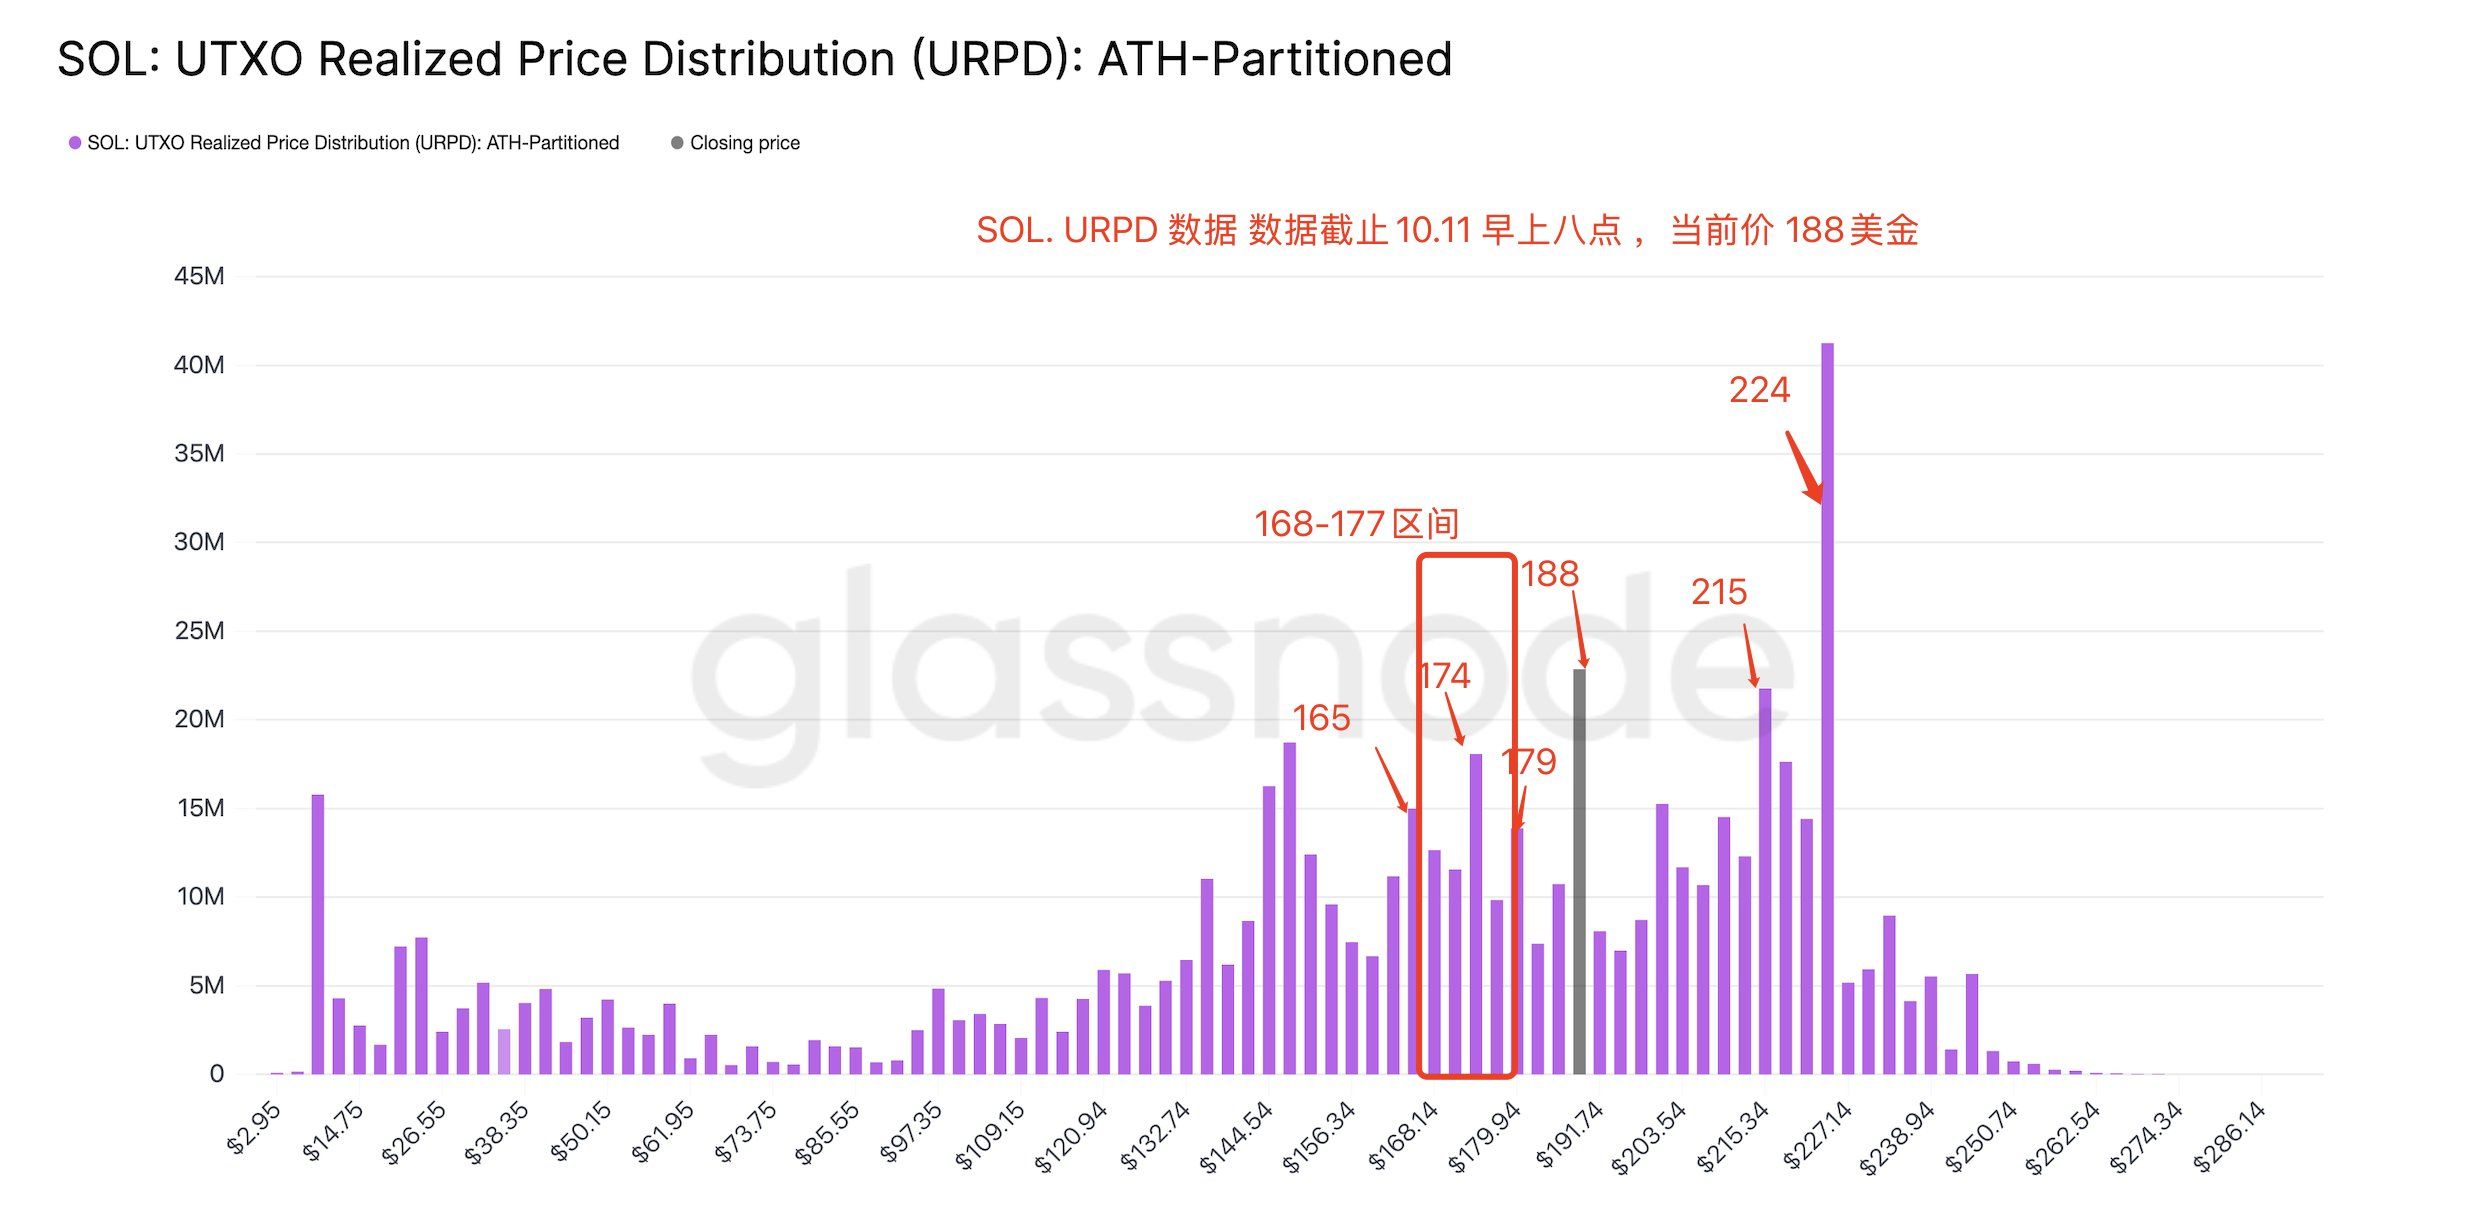 SOL URPD on-chain indicator. Source: DC
Traders still consider the $166-$177 zone strong support, as it has served as an accumulation zone since August. The current price has recovered above $190 after hitting a low of $168 on October 11. The $215-$224 zone is now an important resistance level, with a large accumulation volume that needs to be processed.
In the current situation, monitoring the stock market’s reaction and information about the Solana ETF can provide an effective trading strategy. If the SOL price stabilizes above $190 and shows signs of consolidation at $172-$197, this could be an opportunity to act.
As of this writing, SOL is trading at $208.92, up 5.9% over the past 24 hours. This makes it the top-performing cryptocurrency among the top 40 by market capitalization.
Recommended Articles


