

BNB Keeps Printing New ATHs, Breaks $1,200 For The First Time Ever
BNB continues to dominate market headlines after surging to a new all-time high of $1,223 just a few hours ago. The price has shown remarkable resilience, holding firm above the key $1,200 level, as bullish momentum accelerates across the broader crypto market. The breakout underscores the growing strength of BNB, which has now become one of the clear leaders of this cycle’s rally.
Analysts note that BNB’s upward trajectory reflects a powerful combination of technical and market-driven factors. The coin’s consistent growth, fueled by strong demand within the Binance ecosystem and increasing on-chain activity, has positioned it as one of the standout performers in 2025. As the broader market trends upward, BNB’s performance is not only driving sentiment but also signaling renewed confidence in large-cap altcoins.
Some analysts now expect the token to push even higher in the coming weeks, with projections pointing toward potential targets around $1,300–$1,400 if momentum continues. The market’s strength, coupled with BNB’s leadership role, suggests that the current rally could extend further — and that BNB may once again set the tone for altcoin performance as investors chase new highs.
BNB Chain Activity Hits Record Addresses
According to Token Terminal, BNB Chain’s monthly active addresses have reached a new all-time high of 60 million, marking a major milestone for the network and adding strong on-chain support to BNB’s recent price surge. This record growth reflects expanding user activity across decentralized applications, DeFi protocols, and gaming platforms built on the BNB ecosystem. It also highlights the network’s growing adoption, even amid a highly competitive layer-1 landscape dominated by Ethereum and other emerging chains.
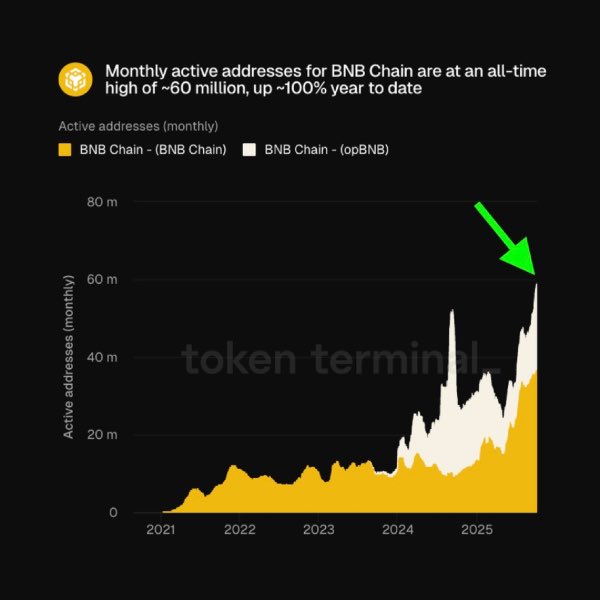
The timing of this spike in activity is particularly significant. As BNB’s price climbed to a new all-time high at $1,223, the surge in active users underscores that the rally is being driven not only by speculation but also by genuine network engagement. Analysts point out that such increases in activity often precede further bullish momentum, as more users and developers participate in on-chain transactions, staking, and trading.
The coming days promise to be very exciting for investors. With Bitcoin consolidating near record levels and Ethereum reclaiming key price zones, BNB and ETH are now leading the charge into what could become a new bullish phase for altcoins. If market momentum continues, this combination of strong fundamentals and technical breakouts could drive altcoin valuations to levels not seen in years.
Price Analysis: Bulls Maintain Momentum Above $1,200
BNB continues its strong uptrend, consolidating above $1,200 after briefly touching a new all-time high at $1,223 earlier today. The 4-hour chart shows a clear bullish structure, with price action consistently making higher highs and higher lows since late September. BNB remains well-supported by the 20-day moving average (blue line), which has acted as dynamic support throughout this rally.

The recent breakout above the $1,175–$1,180 zone confirmed a key resistance flip, allowing bulls to extend the move toward uncharted territory. If BNB manages to close multiple candles above $1,200, the next potential target could be the $1,250–$1,300 range, which would mark the continuation of its parabolic move.
Momentum indicators suggest strong buying pressure, though traders should remain cautious of short-term pullbacks. A temporary correction toward $1,150 or even $1,100 could occur if buyers take profits after the rapid appreciation.
Still, as long as BNB holds above its 50-day moving average (green line), the broader market structure remains decisively bullish. With volume supporting the move and fundamentals aligning with on-chain growth, BNB could continue to outperform major altcoins in the near term — solidifying its position as the market leader in this new bullish phase.
Featured image from ChatGPT, chart from TradingView.com
Recommended Articles


