

LINEA Price Eyes Recovery Despite Dropping 50% From Launch — Here’s Why
LINEA has lost almost half its value in less than a day of spot trading. After touching a post-launch high of $0.046 on September 10, as reported by CoinGecko, the LINEA price now trades near $0.023. The sharp drop shows heavy selling pressure from the airdrop claimants, but the charts suggest the price may not be done yet.
Some signals are pointing to a potential recovery, even as risks of new lows remain.
Buyers And Sellers Locked In A Tug-Of-War
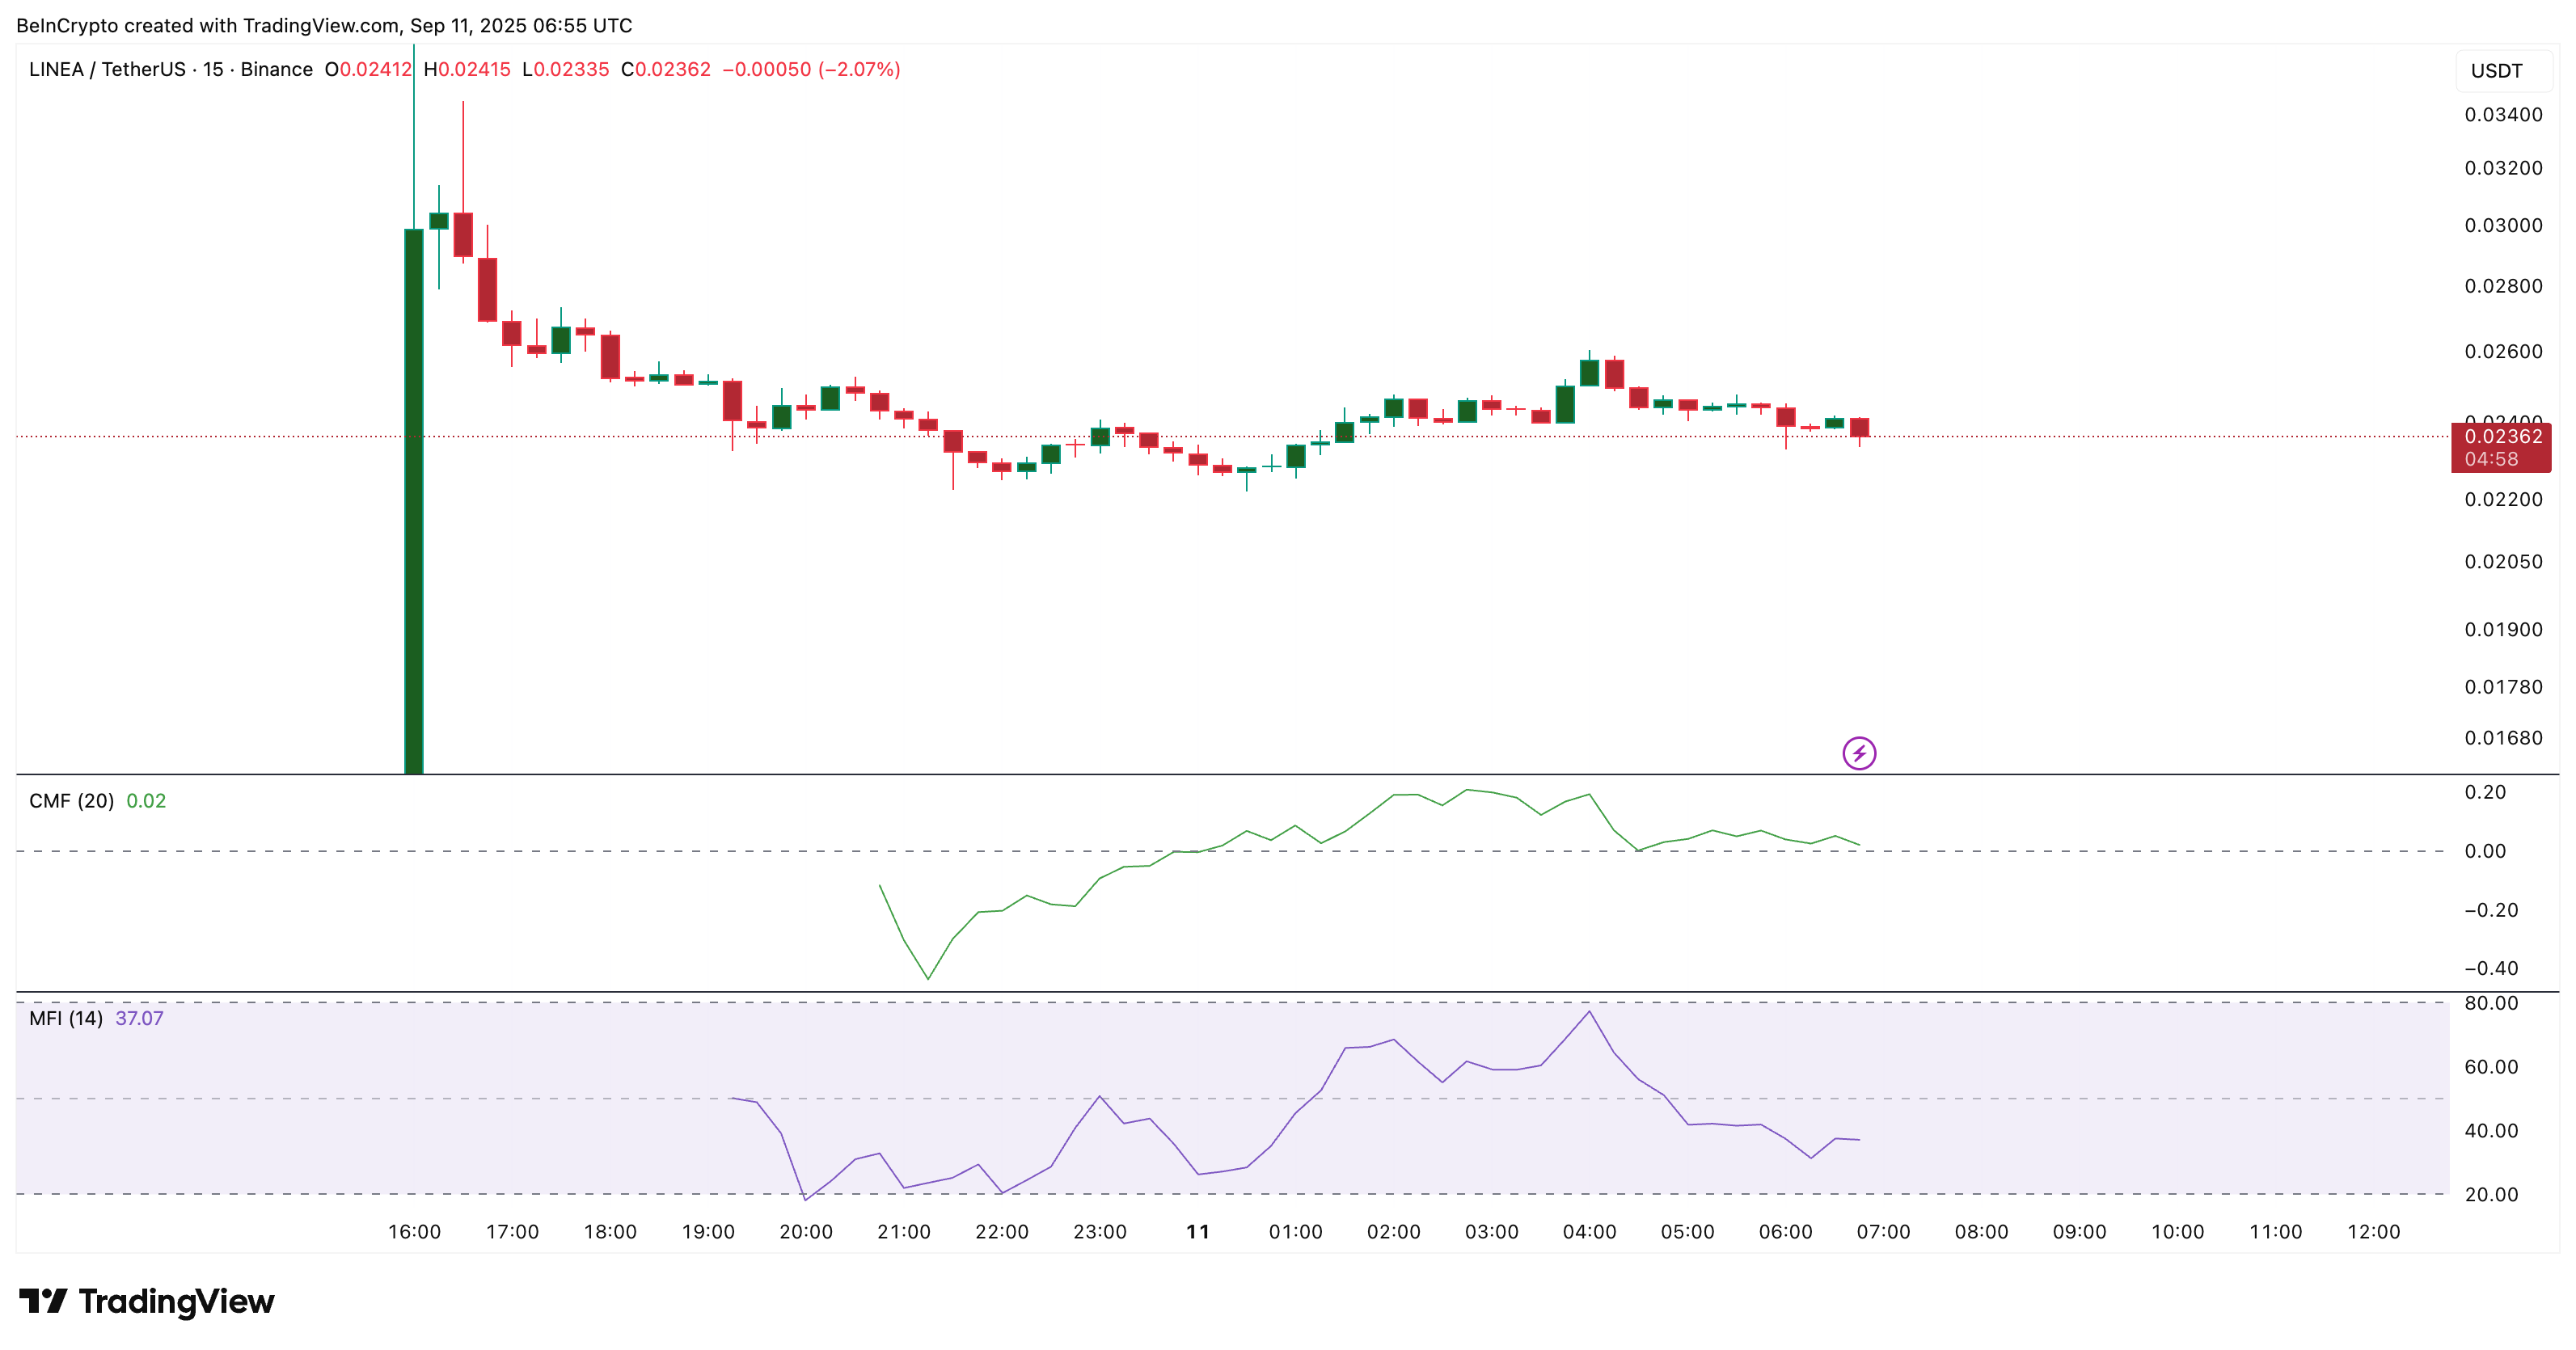
We look at the 15-minute LINEA price chart to understand short-term money movements. This timeframe helps track how quickly inflows or outflows change, giving a clearer view of buyer and seller strength during volatile sessions.
On this chart, the Chaikin Money Flow (CMF), which shows whether money is flowing in or out, has stayed above the zero line for most candles since yesterday. This means inflows are still present even while the LINEA price has traded in a range. That explains one side of the tug-of-war, showing that buyers are quietly supporting the market even as some holders are presumably letting go of their airdropped stashes.
At the same time, the Money Flow Index (MFI), which measures the strength of buying or selling by combining volume and price, made a lower low as prices dropped.
Want more token insights like this? Sign up for Editor Harsh Notariya’s Daily Crypto Newsletter here.
 LINEA Money Flow Trends: TradingView
This shows sellers pushed harder during the correction. But now the MFI has flattened out, hinting that the selling wave may be losing strength.
If MFI starts to curl upward while CMF remains positive, it would confirm that buyers are regaining control and absorbing the pressure.
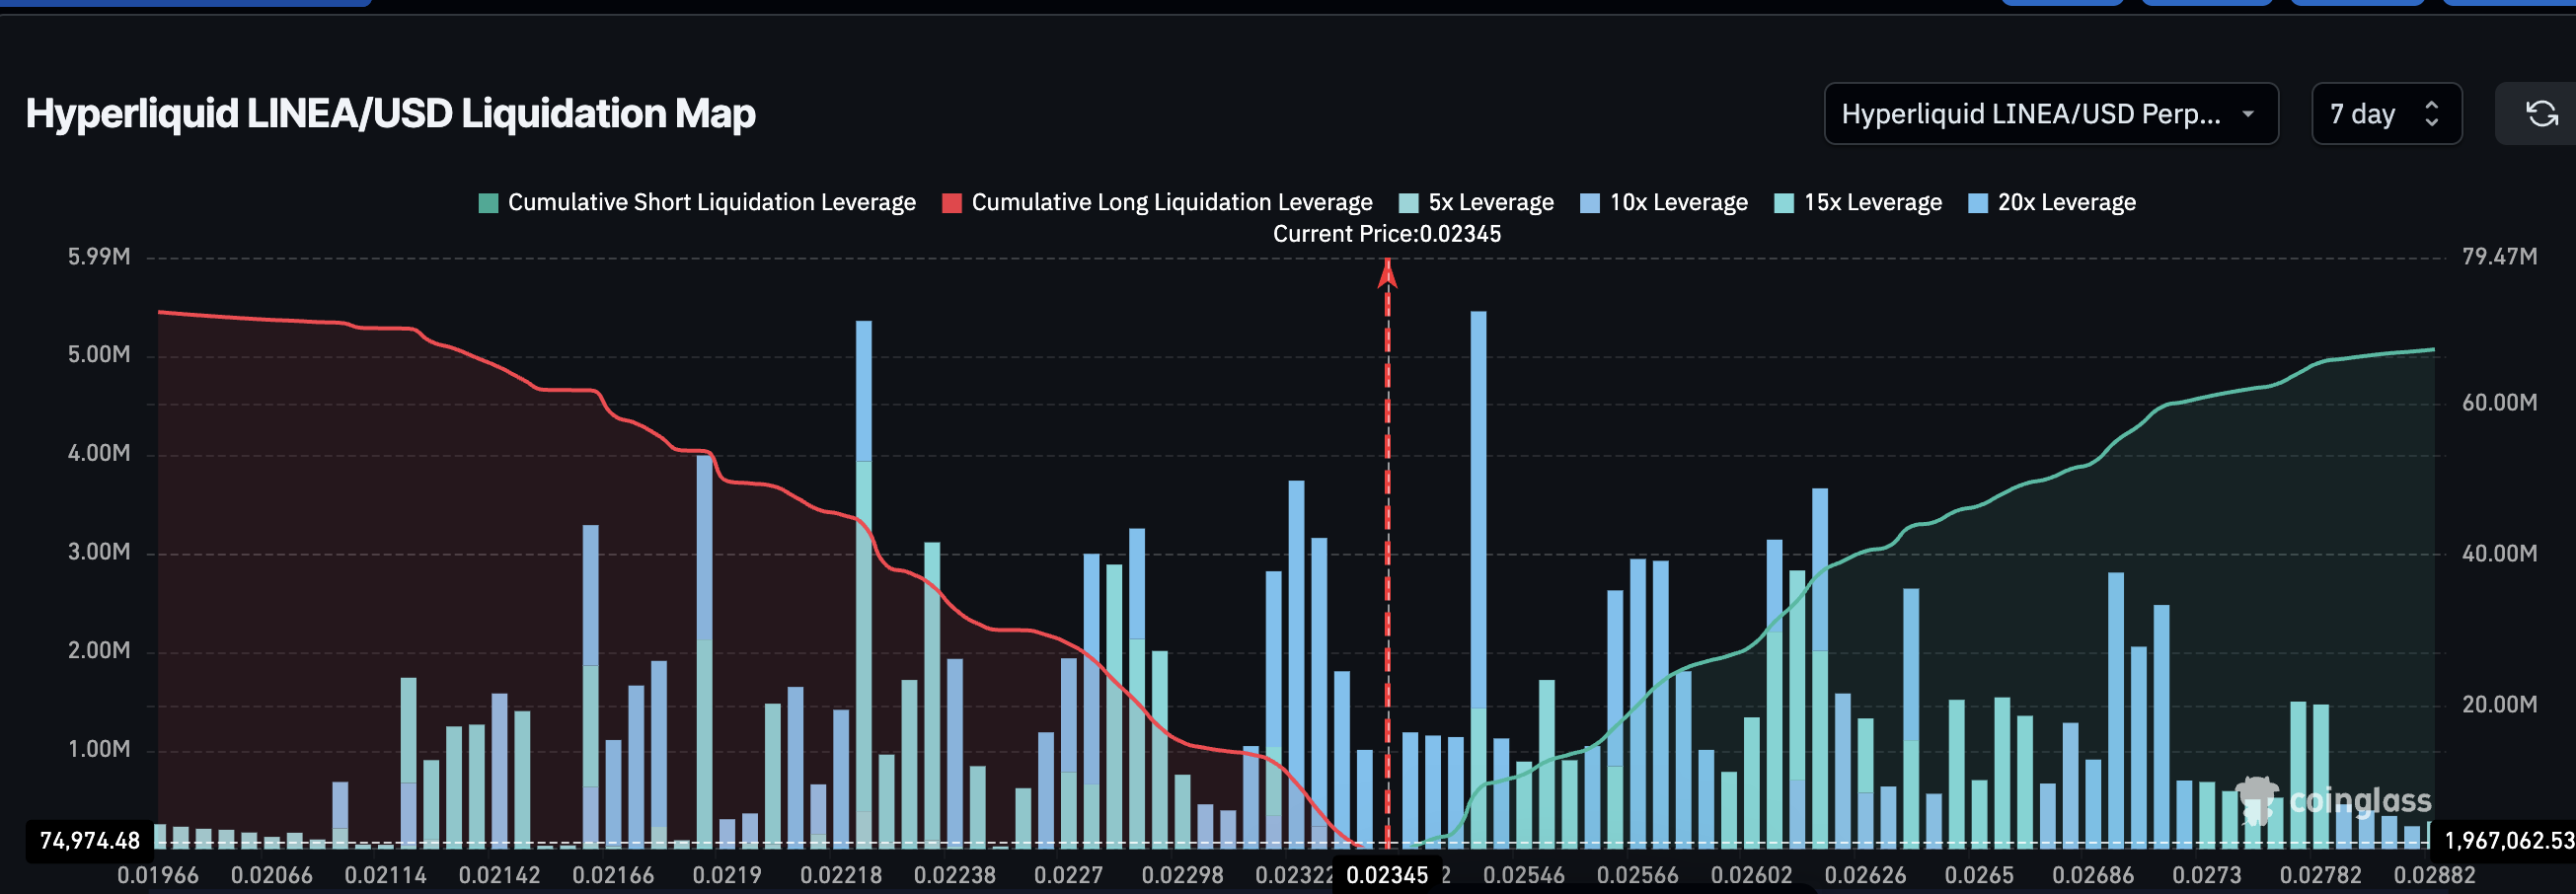
This balance is also reflected in bull–bear positioning. Hyperliquid data shows approximately $72 million in long leverage and $67 million in shorts, nearly in balance.
That also means that if the LINEA price drops to $0.019, almost $72 million of long positions would get liquidated. And on the short side, $67 million would be at risk if price heads to $0.028. Therefore, both $0.019 and $0.028 are key LINEA price levels.
 LINEA Price Bias Is Neutral: Coinglass
This long-short balance, however, keeps the overall bias neutral.
However, clubbed with positive CMF and a flatlining MFI, there is one more chart-specific signal that could kickstart a price recovery.
LINEA Price Chart Shows Chance Of Recovery, But Risks Remain
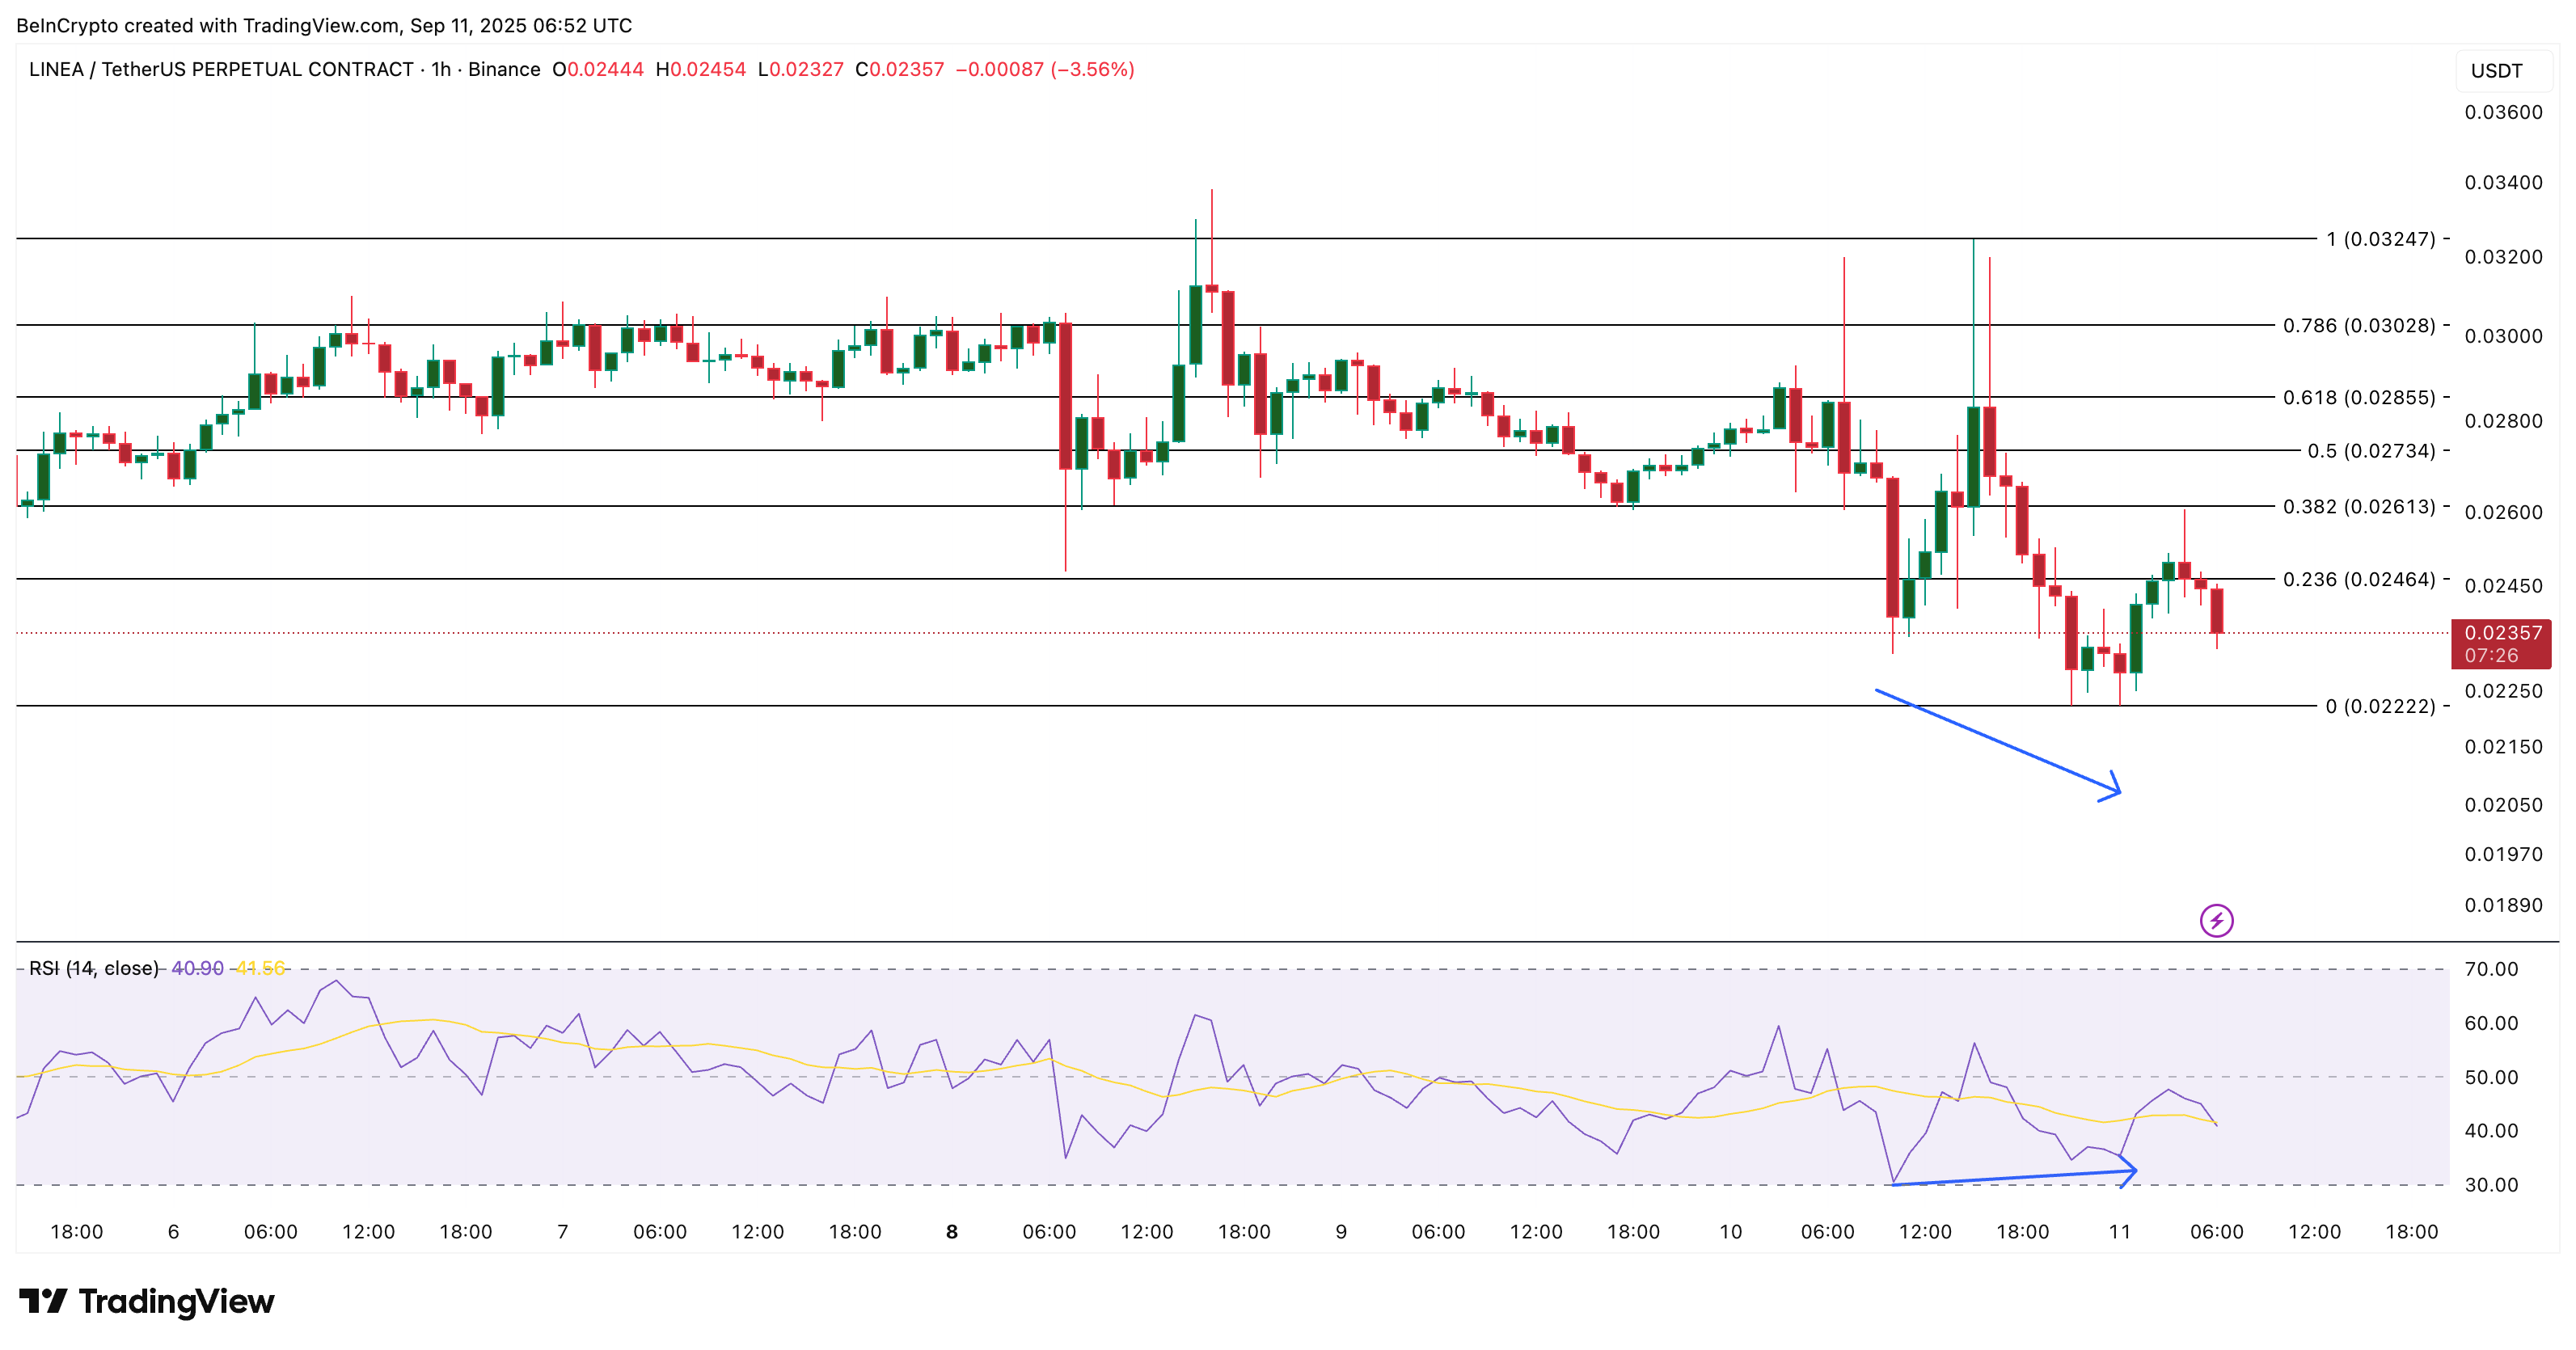
Looking at the broader LINEA perpetual price chart (1-hour timeframe), the RSI (Relative Strength Index) shows a small bullish divergence: prices made a lower low, but RSI made a higher low. This often means the selling momentum is weakening, opening a path for recovery.
This chart is important because perpetual contracts started before spot trading. Therefore, it gives the longest available history and helps track early trends.
 LINEA Price Analysis: TradingView
If buyers return (CMF and MFI grow), the first key resistance is near $0.026. A stronger push could send the price back toward $0.028 (all shorts to get liquidated here), $0.032, or even higher. Those are the key levels to watch if a rebound starts.
On the downside, $0.022 is the most significant near-term support level. That was the lowest point reached after the launch spike and now acts as the “line in the sand.”
If price breaks below, the liquidation map from earlier shows the next risk area sits around $0.019. That level is not visible yet on the daily price chart. But it is where long liquidations cluster, meaning forced selling could drag the token further down. That path would invalidate the recovery hypothesis.
Recommended Articles


