

It’s Not Gold Soaring; It’s Paper Money Shrinking: Measuring Gold with Five Real-World Yardsticks
If we rewind the clock ten years, many people still remember aunties rushing to buy gold bars at bank counters, mocked online as bag holders and negative examples of poor financial literacy. In the blink of an eye, those punchlines have turned into prices you can no longer get, and the bag holding that was ridiculed back then has quietly become getting in early on the time axis.
Back to today, with gold above 5,000 dollars per ounce, many people feel it is too expensive and wonder how they can still buy at such a high level.
But “expensive” has never been an isolated number.
The price of any asset is essentially just a ratio between it and its reference object: a 50‑yuan coffee is a luxury to someone making 5,000 a month, but just everyday spending to someone making 50,000. Gold is the same; talking about expensive or cheap without a reference is just blind men feeling an elephant.
So whether gold is expensive at today’s level does not hinge on the absolute number, but on which yardstick you are holding. This article will bring out several of the heaviest, most meaningful yardsticks in the history of human wealth, line them up against gold, and take its temperature again.
First yardstick: Measuring gold in US equities
In Wall Street’s narrative, stocks represent human ambition and optimism about the future, while gold represents human fear and the last line of defense. The tug‑of‑war between the two has been the backbone of wealth migration over the past century.
S&P 500 / gold:
There is a simple yet profound metric: the level of the S&P 500 index divided by the gold price. This ratio tells us how much physical gold you must pay to buy the family bucket that represents America’s top productive power.
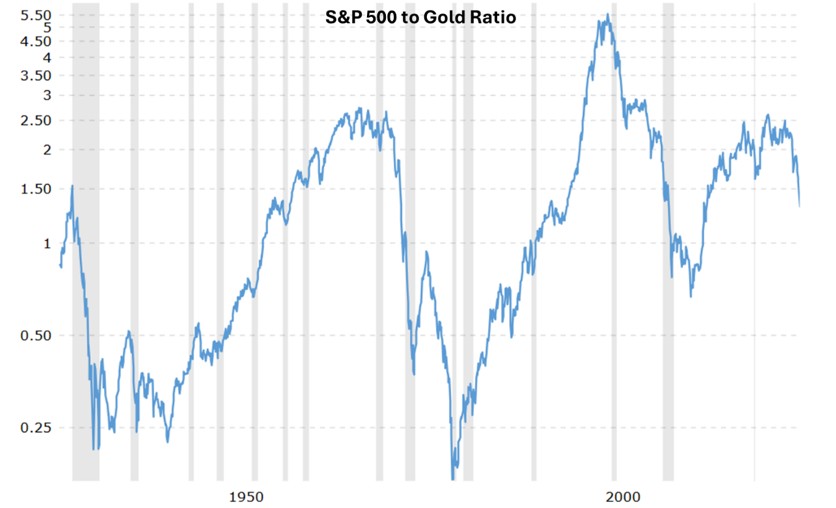
Source: Macrotrends
As of February 2026, this ratio is around 1.3, sitting in the low range since 2014 and marking one of the rare periods in the past decade where gold has clearly outperformed US stocks. From 2024 to now, the ratio has been squeezed from above 2 down into the 1‑point‑something range, showing that in this same cycle gold has far outpaced the index—priced in gold, the core basket of US assets is indeed trading at a relative discount this round.
After the 2008 financial crisis, supported by earnings recovery and tech growth, US equities significantly outperformed gold for a long stretch, with the S&P 500 / gold ratio rising from around 1 to above 2 and 3, telling a story of equity assets dominating. But in the 2020s this line was violently pulled around by the pandemic, then turned down from 2024, falling back to early‑2010s levels, showing that gold has regained some pricing power in the current macro regime shift.
Time point | S&P 500 / gold ratio | Commentary |
Late 1970s | ~0.17 | Stagflation plus oil crises; gold extremely expensive, stocks trampled underfoot |
Year 2000 | ~5.5 | Dot‑com bubble peak; stocks absurdly expensive, gold forgotten |
2009–2018 | From ~1 up to 2–3+ | Post‑crisis long bull market; US stocks outperform gold for a long stretch |
Year 2020 | ~2.0 | Under the pandemic shock, US stocks survive on easy policy; gold also rises but slightly underperforms overall |
Early 2026 | ~1.3 | Both S&P and gold at high levels, but in this relative race gold is clearly in the lead |
This means that in the long race of gold vs US stocks, the last fifteen years were not gold sprinting nonstop, but a process of being suppressed by equities first and then turning around in a new wave of uncertainty. Every period when the ratio clearly dropped—whether late 1970s, the crises around 2000, or the post‑2020 pandemic and geopolitical shocks—has usually coincided with doubts about future equity returns on one side and a repricing of gold’s hedging and store‑of‑value role on the other.
Dow Jones / gold
If we switch from the S&P to the Dow Jones Industrial Average, the pattern and conclusion are very similar: the Dow/gold ratio has fallen from about 20 in 2019 to around 10 in early 2026, likewise reflecting gold catching up and US stocks stepping aside in recent years. The Dow ratio mainly offers a composition contrast, representing a basket of more traditional industrial and financial blue‑chip companies.
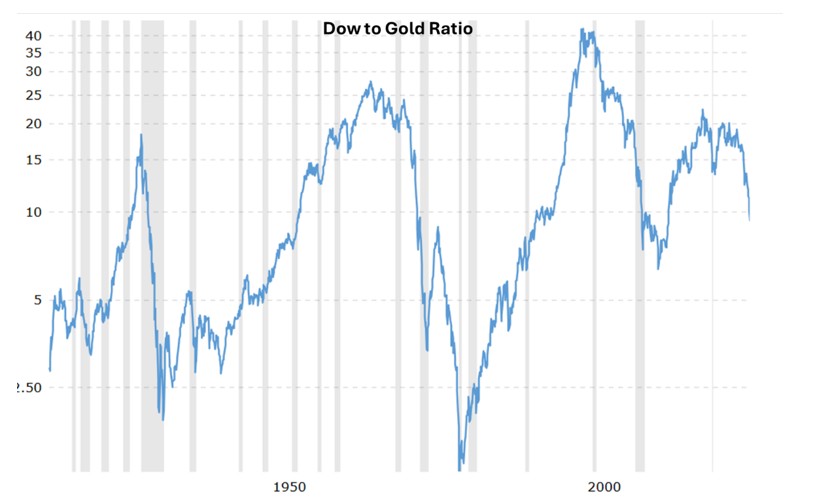
Source: Macrotrends
When the ratio is high, it means the market is willing to pay more gold for these old economy assets; the slide from 20 to 10 in recent years shows that even for this supposedly most solid group, purchasing power measured in gold has fallen substantially. The current 10–11 times is neither the ultra‑optimistic zone of 2019 nor the defensive extremes of 1980 and 2011 when almost everyone hid in gold, echoing the S&P/gold signal: gold is reclaiming more pricing power, but this transfer of power is still underway, not finished.
Second yardstick: Measuring gold against its own history
After adjusting for inflation, where does gold really stand?
Many people remember the 1980 gold frenzy: prices spiked to 850 dollars per ounce in a short time, then entered a two‑decade bear market. In nominal terms, today’s 5,000‑plus dollars clearly surpass that, but more than forty years of inflation have diluted the dollar’s purchasing power enormously.
Real purchasing power
If we bring in US CPI to restore currency purchasing power, the story becomes rather ironic.
The peak of the 1980 gold mania was 850 dollars per ounce; adjusted for more than forty years of inflation, that is roughly equivalent to 3,400–3,500 dollars today. In other words, before gold reached 3,500, all the new highs we saw were mostly nominal; the true break above 1980 in real terms is a phenomenon of this latest bull run.
In recent years, gold has briefly touched or slightly exceeded this inflation‑equivalent line several times, but in the 2025–2026 leg it not only stood firmly above it but pushed all the way beyond 5,000 dollars. Looking back from this phase, this is the first sustained period in which gold clearly stands above the 1980 peak in both nominal price and inflation‑adjusted purchasing power.
Using US CPI as the base and expressing all gold prices since 1980 in 2025 purchasing‑power dollars, the long‑term average is around 1,400 dollars per ounce. On the same basis, the 2025–2026 highs translate into about 3,500–4,000 real dollars per ounce, over three times that long‑term mean, so from gold’s own history the conclusion is straightforward: gold is indeed in a relatively high zone, far above the price band it occupied for most of the past decades.
A storytelling phase five standard deviations out
If statistics had emotions, today’s gold models would probably be having a breakdown.
Financial commentator Ruchir Sharma has cited a model that fits gold prices using inflation and real interest rates, and found that current gold prices deviate from the fair value curve by about five standard deviations—an event with extremely low probability in a normal distribution world.
More importantly, for decades gold’s ups and downs were broadly explainable by real interest rates plus inflation expectations: when real rates fell, gold rose, and vice versa. Since 2023, this relationship has decoupled visibly—real rates have stayed high or even risen slightly while gold has entered a new trend up‑leg, and the World Gold Council’s own pricing models acknowledge that over 80% of recent moves come from risk, uncertainty and residuals, beyond what traditional factors can explain.
Sharma calls this a storybook phase for gold—one mainly powered by stories and sentiment rather than pure macro variables. The last similar phase was at the end of the 1970s bull market, when gold was about 2.5 times model fair value; now that premium is close to fivefold.
This implies gold is in a statistically extreme premium, but in financial crises or periods of regime change such premiums often last much longer than people expect.
Third yardstick: Measuring gold against money supply
If official CPI feels too abstract, there is a more intuitive yardstick: divide US M2 money supply by the gold price and see how much money corresponds to one ounce of gold.
M2 / gold: Who is really chasing whom?
The logic is simple: if central banks keep expanding their balance sheets while the total stock of gold only grows slowly each year, then in the long run gold prices should roughly track money supply; a higher M2/gold ratio means gold lags more behind the money pool, and a lower ratio means gold has caught up with or even outrun the printing.
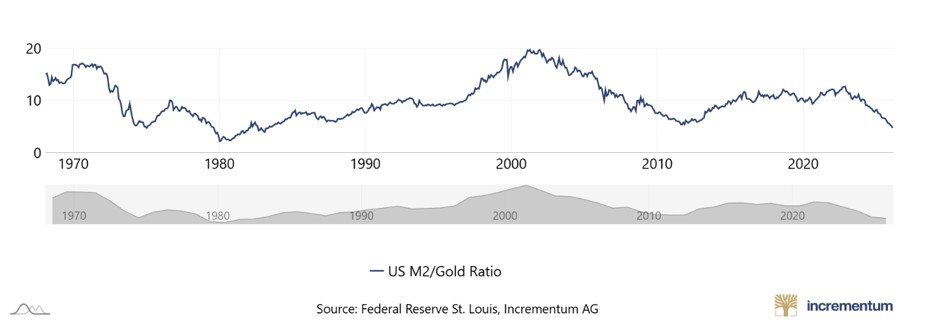
Source: In Gold We Trust
At the peak of the 1980 gold bull, this ratio was around 2 (gold extremely expensive); around 2000, when the Fed eased but gold was still in the gutter, it neared 20 (gold extremely cheap). By 2022 it was still around a high of 13, but by early 2026 it has been crushed down to about 5, a multi‑decade low, which means gold has moved from being deeply undervalued toward the middle, slightly expensive zone versus the dollar money pool.
Even though the gold price has doubled, relative to the stunning pace of Federal Reserve balance‑sheet expansion over the past twenty years, gold has merely been making up lost ground. Rather than gold going crazy, it is really just struggling to catch up with all the over‑issued money.
More intriguingly, after 2023 US M2 stopped expanding like it did from 2008–2021 and even went through a rare contraction, yet gold kept climbing strongly, which shows this leg cannot be summarized simply as money printing pushes gold up. The key driver has shifted toward central banks—especially in emerging markets—steadily boosting official gold reserves, long‑term worries about fiat credibility under high debt and deficits, and extra risk premiums when geopolitical and financial‑system uncertainty increase.
Central banks: From house to true believers
In this gold rally the biggest force is not retail buyers but global central banks.
Since the 2022 episode of frozen foreign‑exchange reserves, gold has shifted from just an asset to the only ultimate backstop of sovereign safety for many nations. When emerging‑market central banks keep buying for dozens of months in a row, what they weigh is not valuation but sovereignty, and as long as there are cracks in dollar credit, for them gold is never too expensive, only enough or not.
Fourth yardstick: Measuring gold against real‑world assets
Sometimes, stepping away from market noise into real life makes the essence clearer.
Housing: A discounted property market in gold terms
If you measure real estate in gold, you will find the world has not become more expensive over the past twenty years—it has actually become cheaper.
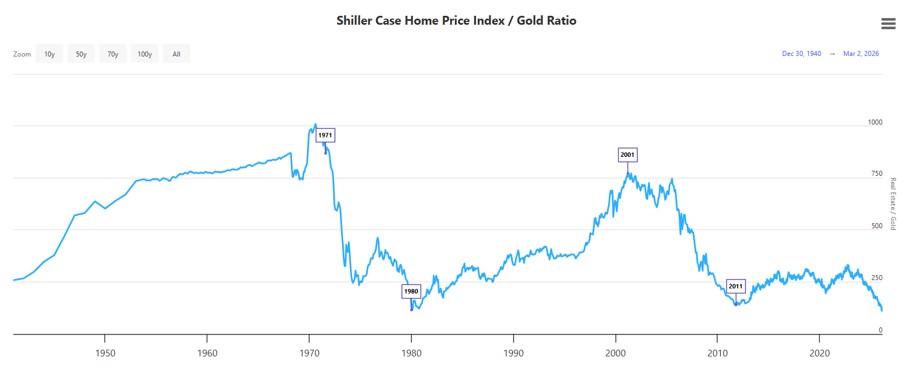
Source: LongtermTrends
Historically, when the house‑price/gold ratio falls into the 100–150 ounce zone, it often marks the mid‑to‑late stage of a gold bull (for example 1980 and 2011); when it spikes to 600–800 ounces, it corresponds to housing bubbles and gold being ignored (for example 2001–2006).
Since 2000, the house‑price/gold ratio has fallen steadily from high levels, and the current 100–150 ounce band is very close to the lower range seen at the peaks of the previous two long gold bulls. In 2002, a median US home cost about 700 ounces of gold; by 2026, with gold above 5,000, that number has dropped to around 100 ounces—meaning US residential assets have shrunk by about 80% in gold terms over twenty years.
Of course, in dollars houses are not cheap and price‑to‑income ratios are still high in many cities, but if your home currency is gold, the story flips: it is not that house prices have soared too much, it is that gold’s purchasing power has risen even more.
Oil: How much fuel one ounce of gold buys
For energy, the gold‑oil ratio essentially tells you how many barrels of crude one ounce of gold can buy; it is both a relative price anchor within commodities and a barometer of geopolitical and macro risk sentiment. From the late 19th century to today, its long‑term average has been around 15–20, while currently it is about 75, nearly five times that average, meaning gold is extremely expensive versus oil and energy is extremely cheap in this rare configuration.
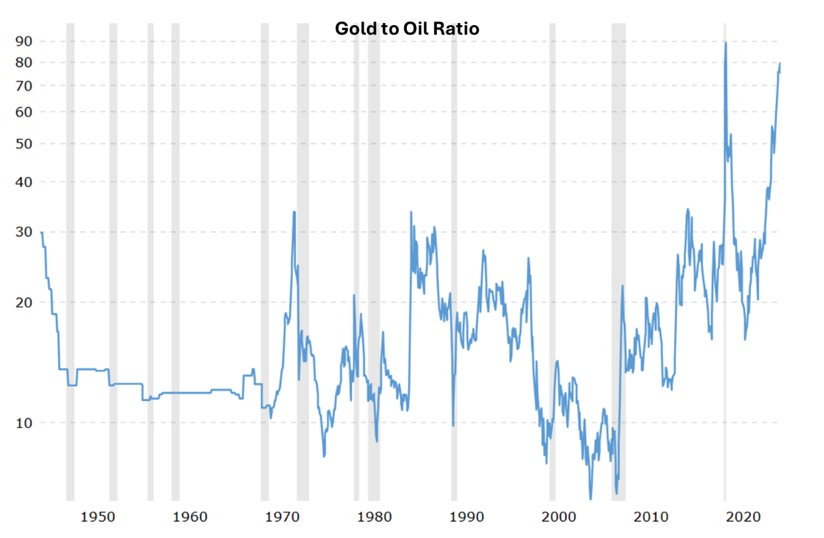
Source: Macrotrends
This flashes a dangerous signal: either gold is absurdly expensive or oil is being crushed too hard. Historically, whenever the gold‑oil ratio spiked to extreme highs, what followed was either a correction in gold, a catch‑up rally in oil, or both moving halfway, but in all cases converging back toward the mean.
From another angle, crude oil, still a widely used energy source, being priced this low relative to gold is also the result of overlapping forces in recent years: the renewable‑energy narrative, ESG investment preferences, and cyclical factors.
Burger index: Gold’s burger‑buying power
If you do not care about houses and oil but do care about a burger, how many Big Macs can one ounce of gold buy?
Around 2000, a Big Mac in the US cost about 2.2–2.3 dollars and one ounce of gold could get you over a hundred of them; by the mid‑2020s, a Big Mac costs about 5.5–6 dollars and one ounce of gold can buy roughly 800–900 Big Macs.
Measured in burgers, gold’s real‑world purchasing power growth over the past twenty years is staggering: the same ounce of gold now buys an order of magnitude more standardized fast food, while burger price increases have mostly just tracked ingredients, labor, and general inflation.
This shows that gold has not only risen a lot in the financial world, but has genuinely become more valuable in everyday life.
Fifth yardstick: Putting gold back into the full asset spectrum
The previous yardsticks gave partial answers from gold vs US stocks, gold vs itself, gold vs money, and gold vs housing, oil, and burgers. Finally, we put gold back into the panoramic view of the whole asset world and ask again whether it is expensive.
Asset dimension | Core indicator | Status | Takeaway |
Versus US stocks | S&P 500 / gold ≈ 1.3 | Near the low band of the past decade | Both high, but in this relative race gold has clearly beaten US stocks |
Versus itself | Inflation‑adjusted gold price | Record highs, roughly 3× the real average since 1980 | Standing on a high historical plateau, with a visibly thinner margin of safety |
Versus money | M2 / gold ≈ 5 | Near the relative low range since 1980 | Versus the dollar money pool, gold has absorbed much of the excess‑printing dividend |
Versus property | House price / gold ≈ 100–150 | Close to multi‑decade lows | In gold terms US residential assets have devalued heavily; property is relatively cheap vs gold |
Versus energy | Gold‑oil ratio ≈ 75 | Far above the long‑term mean (about 15–20), around 4–5× | Gold is extremely expensive relative to oil; energy extremely cheap in this rare mix |
This table reveals a harsh reality: we live in an era where almost everything is expensive. It is not only gold at lofty levels; US equities are also on top of the valuation pyramid—with the S&P 500’s Shiller PE around 40 versus a historical median in the teens, and the Buffett Indicator above 200%, far beyond the so‑called fair range, so by distance from its own mean US stocks look more like the child who has run too far.
Going further, we can break it into three lenses. First, each asset versus its own past: both gold and US stocks are far above their long‑term averages, so whichever you buy, the margin of safety today is much thinner than it was a decade or two ago.
Second, the relative ranking across assets: in recent years gold’s price gains versus houses, oil, and a basket of real assets have been particularly striking, while tangible things like property and energy now sit on the historically cheap side of those ratios.
Third, everyday purchasing power: measured in food, shelter, and energy, the real life that gold can buy over a full twenty‑plus‑year cycle has generally increased, while the same amount of cash deposits and many richly valued long‑term bonds have seen their inflation‑adjusted purchasing power quietly erode, which is one of the fundamental reasons gold has delivered long‑term excess returns versus cash and bonds.
If we only look at deviation from its own mean, gold clearly fits the profile of an asset with bubble‑like traits; but if we widen the lens to include US stocks and high‑valuation bonds across the whole financial complex, gold looks more like the relatively sturdier bubble that is harder to pop first, while horizontal comparisons to property and oil show that what has really been pressed to low levels are the more real‑world physical assets.
Conclusion: The investor standing before gold prices
If you believe globalization will keep running smoothly and the fiat‑money system will always retain its dignity, then 5,000‑dollar gold looks like a wildly misguided collective error.
But if you sense that old sources of safety are loosening—debts so high they are hard to repay, foreign‑exchange reserves no longer absolutely safe, inflation returning again and again—then this surge in gold prices looks more like an honest attempt to write those risks into the ledger than a random spike.
From here on, whether you keep holding, sell into strength, or stay away from this market altogether, everything comes back to one question: which future world order you truly believe in.
The price of gold is, at its core, humanity’s vote of no confidence in the future.
It keeps reminding us that fiat currencies have already shrunk to the point of being unrecognizable, and in such an era what you truly need to fear is not paying a few tens of percent too much once, but looking back one day to find your paper money buys almost nothing decent and you own almost no real assets of your own.
Disclaimer: This article is for educational purposes only and does not constitute investment advice. Gold and related derivatives carry price-volatility risk. Please assess your own risk tolerance and make independent investment decisions after fully understanding the relevant risks.
Recommended Articles


