

WTI strengthens as traders balance surplus forecasts and geopolitical shifts
- WTI trades firmer above $60.00 despite ongoing supply-surplus worries.
- Traders focus on upcoming US sanctions on Russia targeting Rosneft and Lukoil on November 21.
- Technically, price action remains confined within a descending channel, keeping the broader trend tilted lower.
West Texas Intermediate (WTI) Oil edges higher on Tuesday, trading around $60.50 and up nearly 1.35% on the day, despite ongoing worries about a widening supply surplus.
Recent projections from the International Energy Agency (IEA) and the US Energy Information Administration (EIA) have warned that global Oil markets are on track for a period of oversupply, with non-OPEC output growth and softer consumption expected to weigh on balances into early 2026.
At the same time, geopolitical pressure has eased slightly after Russia’s Novorossiysk export operations resumed, removing part of the risk premium that had temporarily supported crude following last week’s disruption.
Meanwhile, traders are closely watching the next round of US sanctions targeting Russian oil majors Rosneft and Lukoil, which are scheduled to take effect on November 21. US President Donald Trump has signaled he is prepared to sign legislation imposing broader sanctions on Russia, provided he retains final decision-making authority over any such measures.
He added that it was “OK with me” that Republicans are drafting a bill aimed at countries that continue doing business with Moscow, citing Russia’s failure to show meaningful progress toward a Ukraine peace agreement.
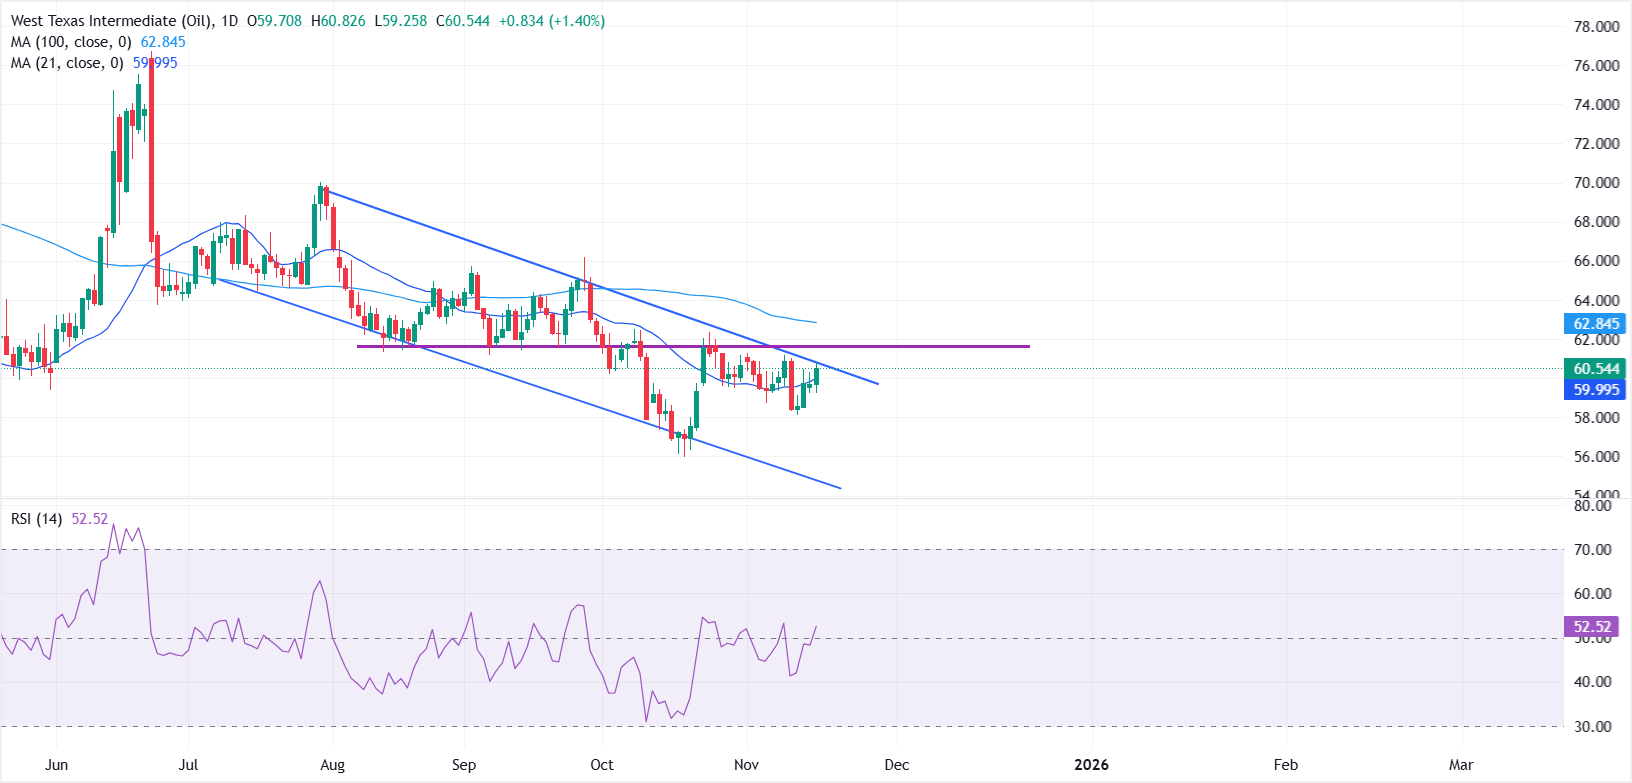
From a technical perspective, WTI continues to trade within a well-defined descending channel on the daily chart. The broader trend remains tilted to the downside as long as the channel’s upper boundary stays intact. Prices have now broken above the 21-day Simple Moving Average (SMA) near $59.97, offering a mild improvement in near-term momentum.
On the upside, the $61.00–$61.50 region acts as the first major barrier. This zone aligns with the descending channel’s upper trendline and a former horizontal support now acting as resistance, an area that has repeatedly capped gains since late October. A daily close above this region would be the first sign of a structural shift, opening the door toward the 100-day SMA near $62.80.
On the downside, immediate support lies at Monday’s low near $59.22, followed by last week’s trough at $58.12. A decisive break below this area would reinforce the bearish bias and expose the October 22 low near $57.31, with additional downside risk extending toward the broader October swing low around $56.00.
Momentum is neutral, with the daily Relative Strength Index (RSI) hovering near 50, signaling a lack of strong directional conviction and suggesting WTI may continue to consolidate unless a fresh catalyst drives a breakout.
WTI Oil FAQs
WTI Oil is a type of Crude Oil sold on international markets. The WTI stands for West Texas Intermediate, one of three major types including Brent and Dubai Crude. WTI is also referred to as “light” and “sweet” because of its relatively low gravity and sulfur content respectively. It is considered a high quality Oil that is easily refined. It is sourced in the United States and distributed via the Cushing hub, which is considered “The Pipeline Crossroads of the World”. It is a benchmark for the Oil market and WTI price is frequently quoted in the media.
Like all assets, supply and demand are the key drivers of WTI Oil price. As such, global growth can be a driver of increased demand and vice versa for weak global growth. Political instability, wars, and sanctions can disrupt supply and impact prices. The decisions of OPEC, a group of major Oil-producing countries, is another key driver of price. The value of the US Dollar influences the price of WTI Crude Oil, since Oil is predominantly traded in US Dollars, thus a weaker US Dollar can make Oil more affordable and vice versa.
The weekly Oil inventory reports published by the American Petroleum Institute (API) and the Energy Information Agency (EIA) impact the price of WTI Oil. Changes in inventories reflect fluctuating supply and demand. If the data shows a drop in inventories it can indicate increased demand, pushing up Oil price. Higher inventories can reflect increased supply, pushing down prices. API’s report is published every Tuesday and EIA’s the day after. Their results are usually similar, falling within 1% of each other 75% of the time. The EIA data is considered more reliable, since it is a government agency.
OPEC (Organization of the Petroleum Exporting Countries) is a group of 12 Oil-producing nations who collectively decide production quotas for member countries at twice-yearly meetings. Their decisions often impact WTI Oil prices. When OPEC decides to lower quotas, it can tighten supply, pushing up Oil prices. When OPEC increases production, it has the opposite effect. OPEC+ refers to an expanded group that includes ten extra non-OPEC members, the most notable of which is Russia.
Recommended Articles


