

AUD/JPY Price Forecast: Stabilizes near 106.00 as fears of Yen intervention cool
- AUD/JPY halts its decline after intervention fears triggered a nearly 300-pip pullback.
- RSI stays bullish but flattens, signaling consolidation before a potential trend continuation.
- A break above 107.59 targets 108.00–109.00, while downside risks reemerge below 105.00.
The AUD/JPY halts its downtrend and trades flat during Tuesday’s US session after posting back-to-back bearish daily candles, on speculation of intervention in the FX markets to boost the Japanese Yen. Consequently, the Aussie dropped but as of writing, it has recovered some ground, capping its weekly losses and exchanges hands at around 106.61, virtually unchanged.
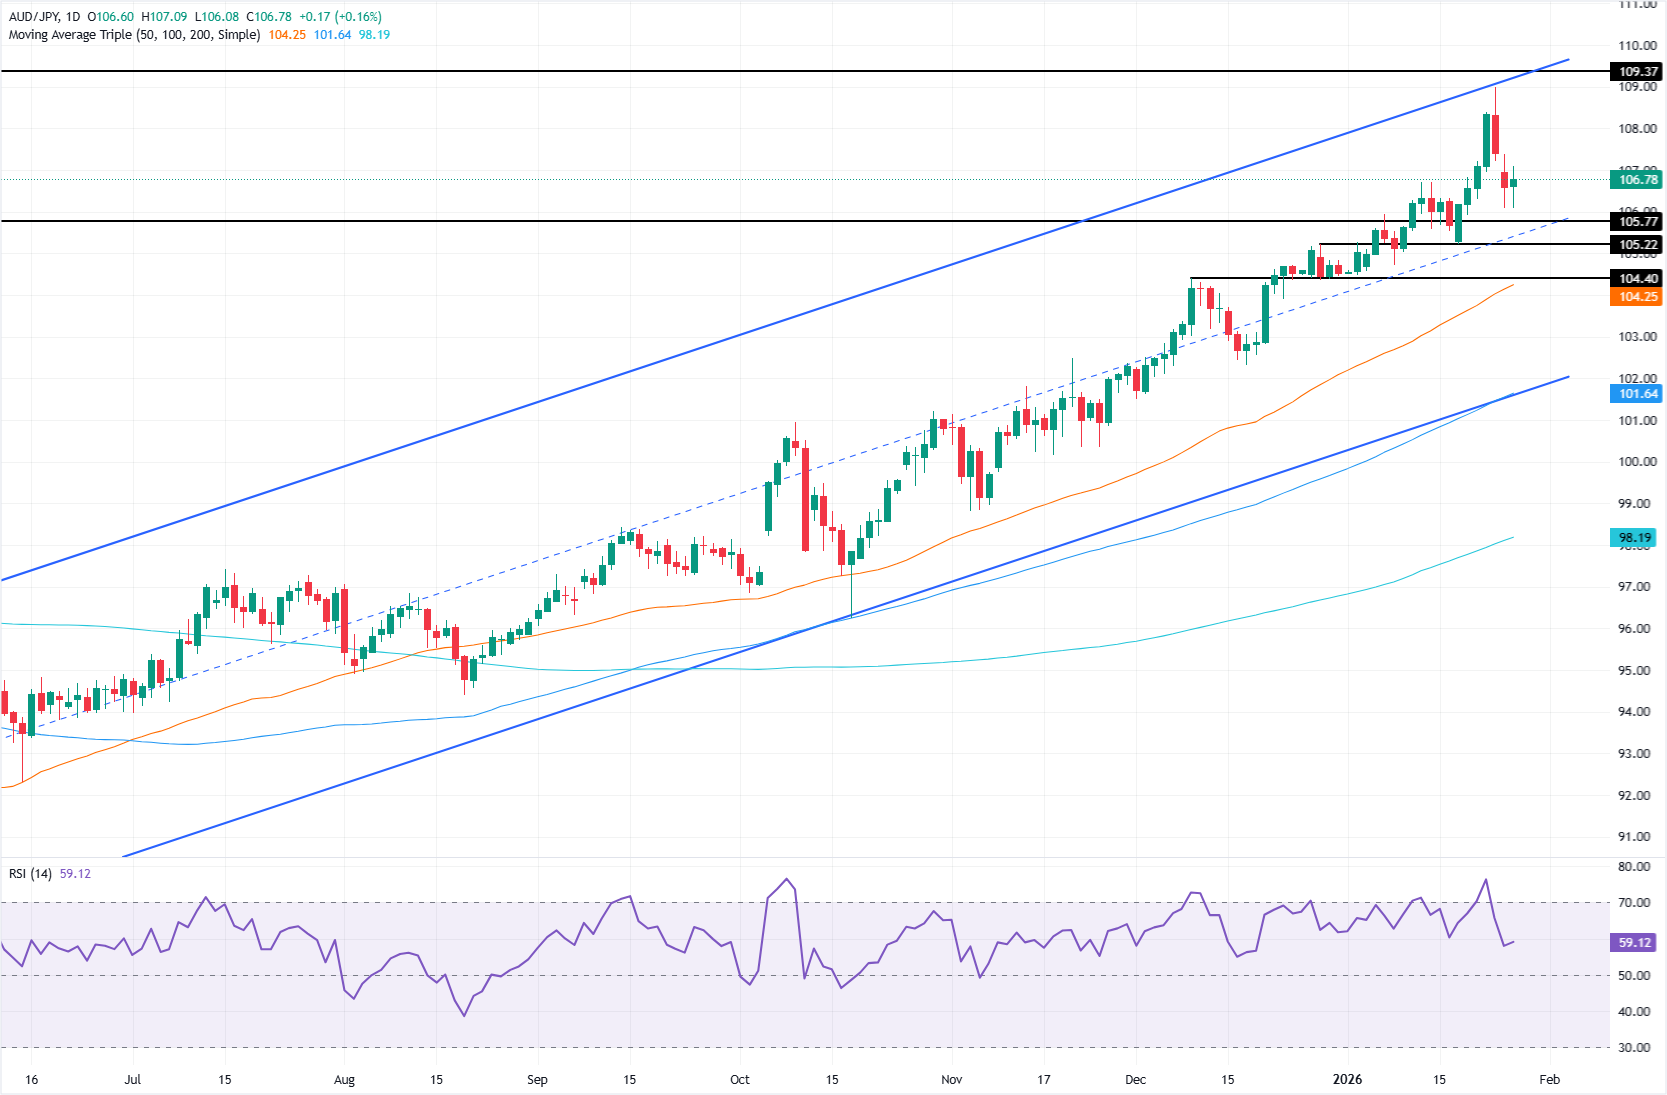
AUD/JPY Price Forecast: Technical outlook
The AUD/JPY is upwardly biased despite finding resistance at the top of an uptrend channel at 109.00. The intervention threats sparked a sell-off in the cross pair, which hit 106.08, dropping nearly 300 pips.
Even though the Relative Strength Index (RSI) made a U-turn, it remains bullish. But as the slope turned flat, traders should expect some sideways price action, before the uptrend resumes.
For a bullish continuation, the AUD/JPY must clear the January 26 high of 107.59. Once surpassed, the next stop would be 108.00 and 109.00, the yearly high.
Conversely, if AUD/JPY retreats below 103.00, this exposes the December 19 high turned support at 105.22, before the cross dives to 105.00. On further weakness, the next support would be the December 9 sing high turned support at 104.40.
AUD/JPY Price Chart – Daily
Australian Dollar Price This week
The table below shows the percentage change of Australian Dollar (AUD) against listed major currencies this week. Australian Dollar was the strongest against the US Dollar.
| USD | EUR | GBP | JPY | CAD | AUD | NZD | CHF | |
|---|---|---|---|---|---|---|---|---|
| USD | -1.32% | -1.25% | -1.30% | -0.85% | -1.13% | -1.33% | -1.57% | |
| EUR | 1.32% | 0.07% | 0.06% | 0.48% | 0.20% | 0.00% | -0.24% | |
| GBP | 1.25% | -0.07% | -0.38% | 0.42% | 0.12% | -0.07% | -0.32% | |
| JPY | 1.30% | -0.06% | 0.38% | 0.47% | 0.18% | 0.02% | -0.25% | |
| CAD | 0.85% | -0.48% | -0.42% | -0.47% | -0.41% | -0.45% | -0.73% | |
| AUD | 1.13% | -0.20% | -0.12% | -0.18% | 0.41% | -0.20% | -0.44% | |
| NZD | 1.33% | -0.01% | 0.07% | -0.02% | 0.45% | 0.20% | -0.25% | |
| CHF | 1.57% | 0.24% | 0.32% | 0.25% | 0.73% | 0.44% | 0.25% |
The heat map shows percentage changes of major currencies against each other. The base currency is picked from the left column, while the quote currency is picked from the top row. For example, if you pick the Australian Dollar from the left column and move along the horizontal line to the US Dollar, the percentage change displayed in the box will represent AUD (base)/USD (quote).
Recommended Articles


