

EUR/GBP Price Forecast: Euro plunges below 0.8690 on Lecornu’s resignation
- The Euro plunges to 0.8675 lows on news of the French Prime Minister's resignation.
- Sébastien Lecornu handed in his resignation unexpectedly on Monday and sent the Euro tumbling across the board.
- France's political uncertainty and the prospect of new snap elections are likely to keep the Euro under pressure.
The Euro has extended its reversal from Friday’s highs at 0.8730 to levels below the 0.8690 support area. Reports that French Prime Minister Sébastien Lecornu has resigned are causing the Euro to drop across the board, bringing the pair closer to the 0.8665 support area.
News reporting that the recently appointed French Prime Minister, Sebastien Lecornu, has resigned has boosted negative pressure on an already weak Euro. Lecornu is the fifth Prime Minister appointed by President Macron in the last two years, and his resignation leaves the country in an uncertain political scenario, amid a serious fiscal crisis.
EUR/GBP approaches a key support area at 0.8665
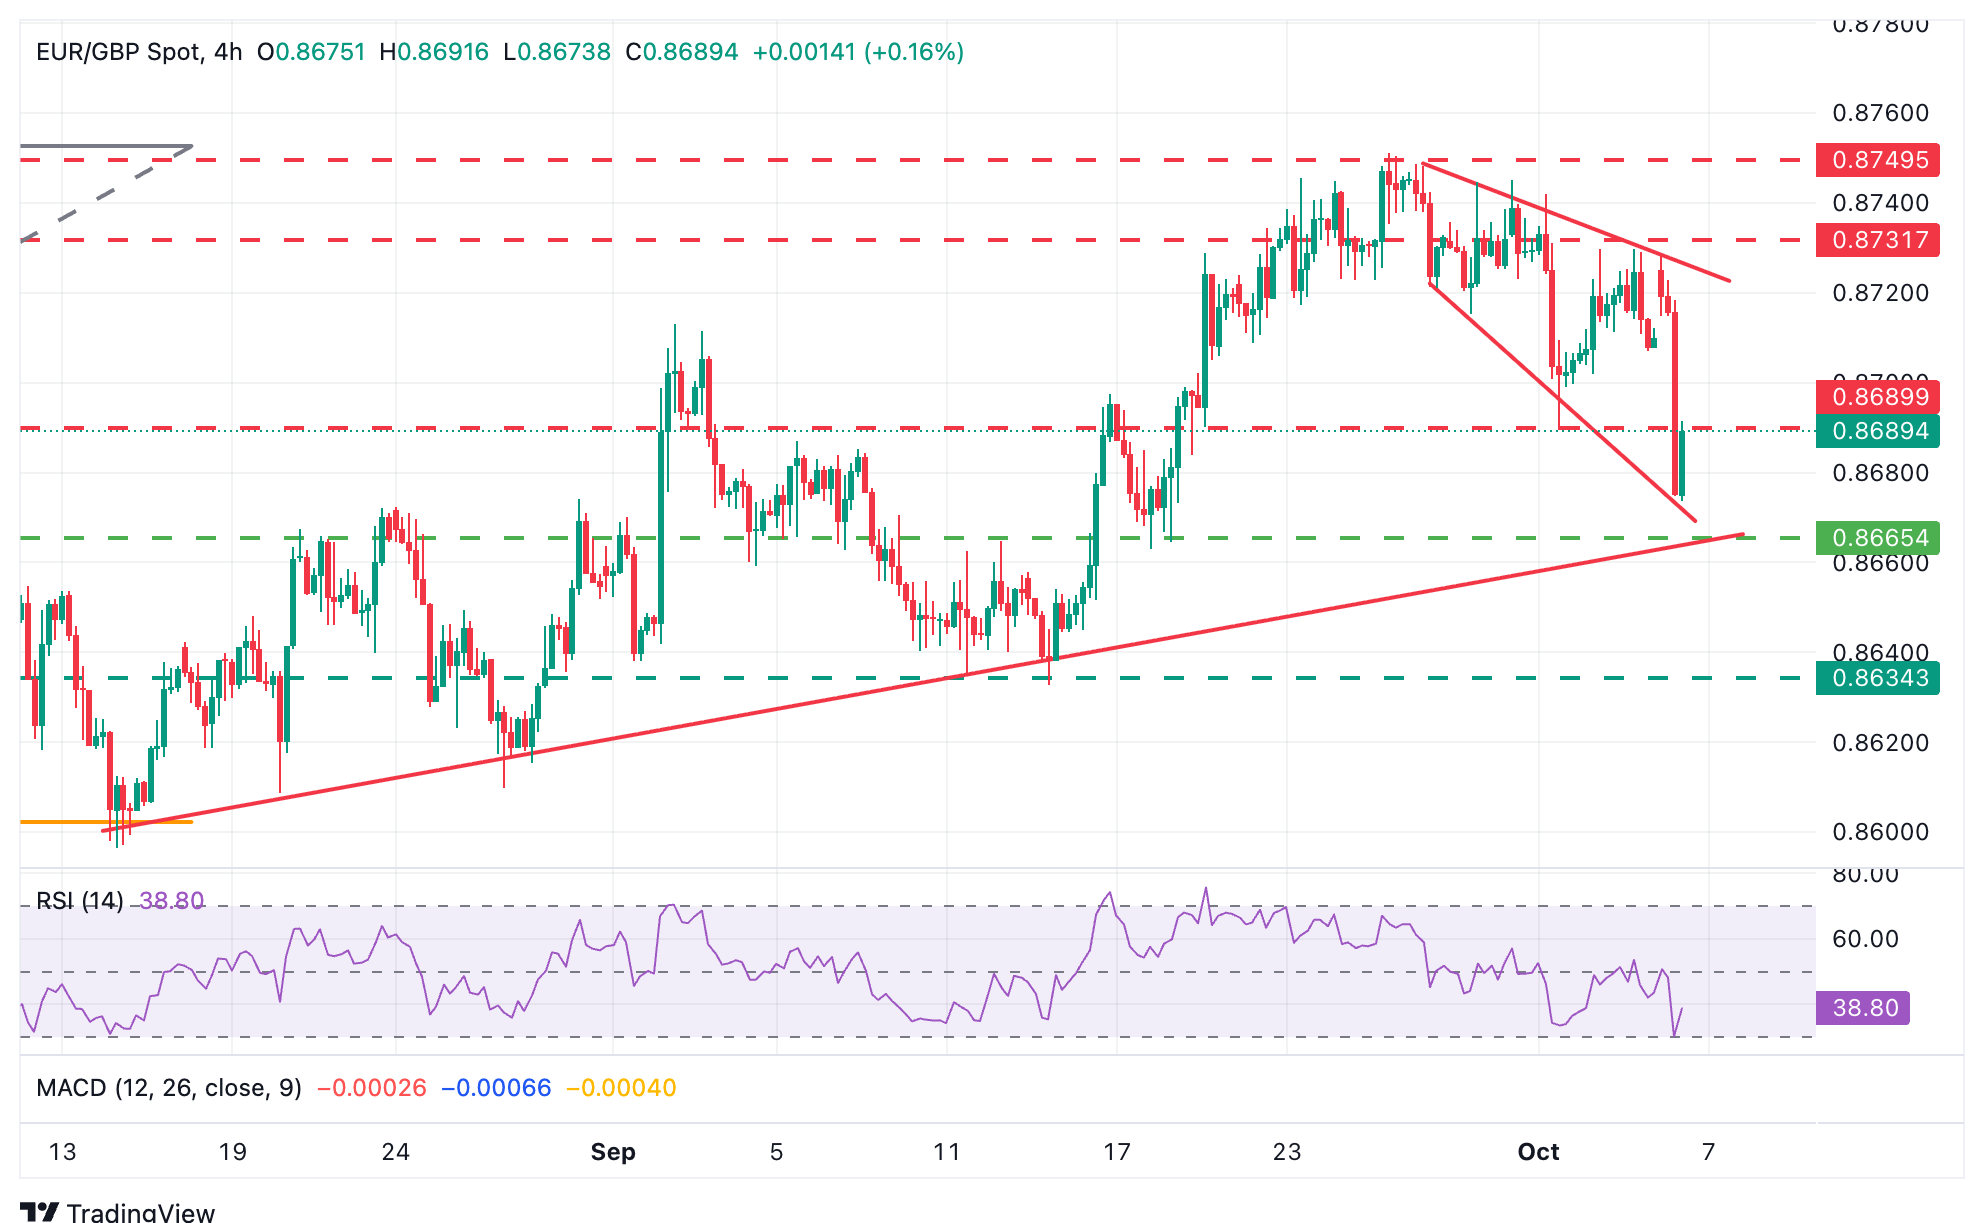
The technical picture shows the pair trading within a broadening wedge, a figure often seen after a significant top. Indicators in the 4-hour charts are deep into negative territory, with bears aiming for the 0.8665 support area.
At the moment, the bottom of the mentioned wedge is holding downside attempts at 0.8675 ahead of a trendline support, at 0.8665. Further down, the target is the September 11 and 15 lows, at the 0.8635 area.
To the upside, the previous support at 0.8665 (October 1 low) is likely to act as resistance now, ahead of the wedge top, at 0.8725, as well as the October 2 and 3 lows in the 0.8730 area.
Euro Price Today
The table below shows the percentage change of Euro (EUR) against listed major currencies today. Euro was the strongest against the Japanese Yen.
| USD | EUR | GBP | JPY | CAD | AUD | NZD | CHF | |
|---|---|---|---|---|---|---|---|---|
| USD | 0.41% | 0.08% | 0.59% | -0.06% | -0.23% | -0.06% | 0.24% | |
| EUR | -0.41% | -0.43% | 0.11% | -0.50% | -0.67% | -0.51% | -0.20% | |
| GBP | -0.08% | 0.43% | 0.65% | -0.07% | -0.25% | -0.08% | 0.22% | |
| JPY | -0.59% | -0.11% | -0.65% | -0.60% | -0.87% | -0.72% | -0.40% | |
| CAD | 0.06% | 0.50% | 0.07% | 0.60% | -0.13% | -0.01% | 0.30% | |
| AUD | 0.23% | 0.67% | 0.25% | 0.87% | 0.13% | 0.17% | 0.48% | |
| NZD | 0.06% | 0.51% | 0.08% | 0.72% | 0.00% | -0.17% | 0.30% | |
| CHF | -0.24% | 0.20% | -0.22% | 0.40% | -0.30% | -0.48% | -0.30% |
The heat map shows percentage changes of major currencies against each other. The base currency is picked from the left column, while the quote currency is picked from the top row. For example, if you pick the Euro from the left column and move along the horizontal line to the US Dollar, the percentage change displayed in the box will represent EUR (base)/USD (quote).
Recommended Articles


