
EUR/USD remains vulnerable after ubpeat US data, new tariffs
- The Euro languishes at two-week lows near 1.1650 amid a firm US Dollar and risk-off markets.
- Strong US GDP and jobless claims data eased concerns about the US economy and boosted the US Dollar.
- Investors will be looking at the US PCE Price Index report for more clues about the Fed's forward guidance.
EUR/USD ticks up to the 1.1675 area at the time of writing on Friday from 1.1645 daily lows, but remains on track for a 0.55% weekly decline. In the United States (US), a batch of upbeat macroeconomic figures eased concerns about an economic downturn on Thursday, while in Europe, data have been uninspiring this week. To make matters worse, US President Donald Trump rattled markets with a new round of tariffs.
Data from the US Bureau of Economic Analysis revealed that the Gross Domestic Product (GDP) grew at a stronger pace than previously estimated in the second quarter. The good news came alongside a solid increase in Durable Goods Orders in August and an unexpected decline in US weekly Initial Jobless Claims, which prompted investors to scale back the Federal Reserve's (Fed) interest rate cut bets and provided a fresh boost to the US Dollar (USD).
Apart from that, President Trump announced new tariffs on heavy trucks, branded drugs, and kitchen cabinets, which resurfaced fears about global trade uncertainty and hammered risk appetite during the Asian session.
On Friday, the main focus is on the Personal Consumption Expenditures (PCE) Price Index for further clues about the Fed next monetary policy decisions. The market is bracing for a moderate increase in headline PCE inflation. Anything below the 3% line is likely to keep hopes of Fed easing alive and allow for some recovery on risk appetite.
Euro Price Today
The table below shows the percentage change of Euro (EUR) against listed major currencies today. Euro was the strongest against the Canadian Dollar.
| USD | EUR | GBP | JPY | CAD | AUD | NZD | CHF | |
|---|---|---|---|---|---|---|---|---|
| USD | -0.08% | -0.05% | -0.12% | 0.05% | -0.11% | 0.00% | -0.07% | |
| EUR | 0.08% | 0.07% | 0.02% | 0.19% | 0.05% | 0.16% | 0.04% | |
| GBP | 0.05% | -0.07% | 0.02% | 0.12% | 0.07% | 0.09% | -0.06% | |
| JPY | 0.12% | -0.02% | -0.02% | 0.14% | -0.02% | 0.11% | -0.09% | |
| CAD | -0.05% | -0.19% | -0.12% | -0.14% | -0.16% | -0.01% | -0.18% | |
| AUD | 0.11% | -0.05% | -0.07% | 0.02% | 0.16% | 0.11% | -0.04% | |
| NZD | -0.00% | -0.16% | -0.09% | -0.11% | 0.01% | -0.11% | -0.03% | |
| CHF | 0.07% | -0.04% | 0.06% | 0.09% | 0.18% | 0.04% | 0.03% |
The heat map shows percentage changes of major currencies against each other. The base currency is picked from the left column, while the quote currency is picked from the top row. For example, if you pick the Euro from the left column and move along the horizontal line to the US Dollar, the percentage change displayed in the box will represent EUR (base)/USD (quote).
Daily digest market movers: The USD appreciates following bright US data
- On Thursday, a raft of better-than-expected US economic data eased concerns about the country's soft momentum and endorsed the views of Fed hawks, who are calling for a slow monetary easing cycle. US Treasury yields stretched higher, and the US Dollar jumped. In this context, Euro rallies are expected to remain limited.
- The final US Q2 GDP was revised to a 3.8% annualized growth, up from the 3.3% reported in previous estimations. The upward revision was related to the strong performance of consumer spending, which, however, was partially offset by weaker export activity.
- At the same time, US weekly Initial Jobless Claims fell to 218K on the week ending September 20, their lowest level since late July, from the 232K claims reported in the previous week and against market expectations of a slight increase to 235K.
- Finally, the US Census Bureau reported that orders for durable goods manufactured in the US increased 2.9% in August, driven by a sharp increase in transportation. Durable Goods had been contracting for two consecutive months in June and July. They fell 2.7% in July and were expected to decline by another 0.5% in August.
- Investors trimmed bets of Fed easing following the data. The CME Fed Watch Tool shows an 87% chance of a rate cut in October, from above 90% earlier this week. The chances for a half-point rate cut in the two remaining meetings this year have dropped to 62% from nearly 80% last week.
- Early in the Asian session on Friday, US President Donald Trump brought trade tariffs back to the table, announcing 100% levies for branded medicines, 25% for heavy-duty trucks, and 50% on imports of kitchen cabinets. The decision triggered a wave of risk aversion, underpinning support for the safe-haven US Dollar.
- The highlight today is the US PCE Prices Index report, which will be analysed carefully for more clues about the Fed's next moves. Headline PCE inflation is expected to have edged up to a 2.7% yearly pace in August, from 2.6% in July, although the core inflation, more relevant for monetary policy purposes, is expected to have remained steady at 2.9%.
Technical Analysis: EUR/USD under pressure, with 1.1650 support holding bears
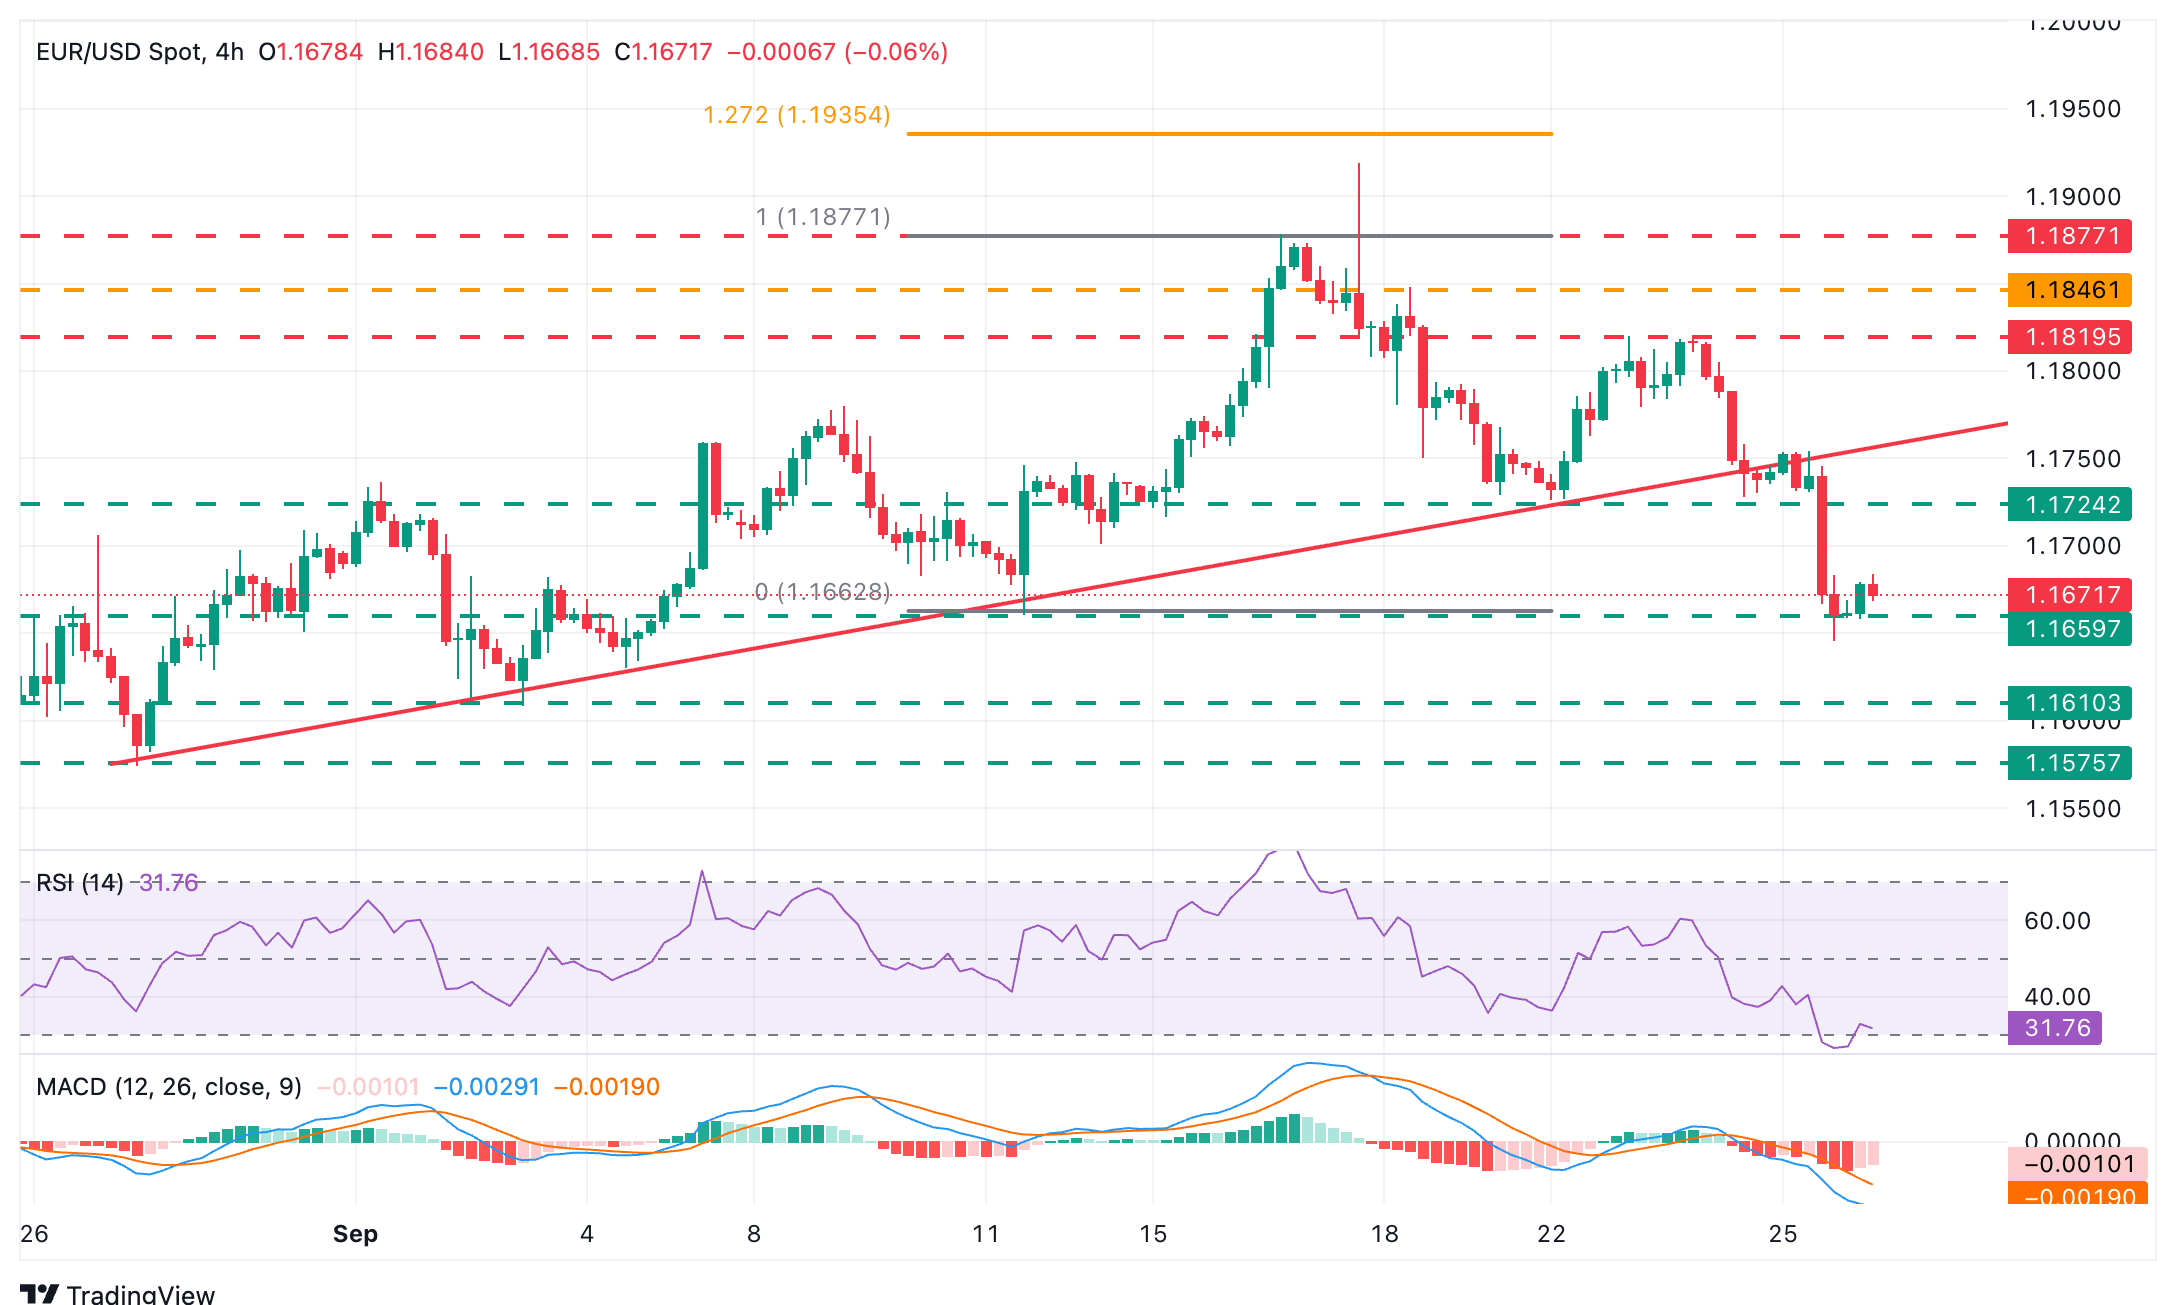
EUR/USD validated its bearish shift on Thursday after confirming the break of the trendline support. The pair is managing to trim some losses on Friday, but momentum indicators remain within bearish territory. Unless US PCE inflation data surprises on the soft side, the pair is likely to remain vulnerable.
Immediate support is located around 1.1650, which held the pair on Thursday and also on September 11. Further down, the September 2 and 3 lows, near 1.1610 and the August 27 low, at 1.1575, would be the next targets. To the upside, support at the September 19 and 20 lows, near 1.1725, is likely to act as resistance, ahead of the reverse trendline, now at 1.1755, and the September 24 and 25 highs, at 1.1820.
Economic Indicator
Gross Domestic Product Annualized
The real Gross Domestic Product (GDP) Annualized, released quarterly by the US Bureau of Economic Analysis, measures the value of the final goods and services produced in the United States in a given period of time. Changes in GDP are the most popular indicator of the nation’s overall economic health. The data is expressed at an annualized rate, which means that the rate has been adjusted to reflect the amount GDP would have changed over a year’s time, had it continued to grow at that specific rate. Generally speaking, a high reading is seen as bullish for the US Dollar (USD), while a low reading is seen as bearish.
Read more.Last release: Thu Sep 25, 2025 12:30
Frequency: Quarterly
Actual: 3.8%
Consensus: 3.3%
Previous: 3.3%
Source: US Bureau of Economic Analysis
The US Bureau of Economic Analysis (BEA) releases the Gross Domestic Product (GDP) growth on an annualized basis for each quarter. After publishing the first estimate, the BEA revises the data two more times, with the third release representing the final reading. Usually, the first estimate is the main market mover and a positive surprise is seen as a USD-positive development while a disappointing print is likely to weigh on the greenback. Market participants usually dismiss the second and third releases as they are generally not significant enough to meaningfully alter the growth picture.
Economic Indicator
Initial Jobless Claims
The Initial Jobless Claims released by the US Department of Labor is a measure of the number of people filing first-time claims for state unemployment insurance. A larger-than-expected number indicates weakness in the US labor market, reflects negatively on the US economy, and is negative for the US Dollar (USD). On the other hand, a decreasing number should be taken as bullish for the USD.
Read more.Last release: Thu Sep 25, 2025 12:30
Frequency: Weekly
Actual: 218K
Consensus: 235K
Previous: 231K
Source: US Department of Labor
Every Thursday, the US Department of Labor publishes the number of previous week’s initial claims for unemployment benefits in the US. Since this reading could be highly volatile, investors may pay closer attention to the four-week average. A downtrend is seen as a sign of an improving labour market and could have a positive impact on the USD’s performance against its rivals and vice versa.
U.S. Treasury
Recommended Articles


