

AUD/USD slips to 0.6590 as Powell highlights dual mandate challenges
- Powell says risks to jobs rising but inflation “somewhat elevated,” keeping Fed cautious despite easing bets.
- US New Home Sales surged 20.5% in August, countering PMI weakness and limiting Dollar downside.
- Australia CPI ticks up to 3.0%, reducing odds of RBA easing at September 30 meeting to just 8%.
The Australian Dollar drops versus the US Dollar on Wednesday amid the lack of catalyst, following remarks by the Fed Chair Jerome Powell, who said that the Fed would continue to balance the dual mandate of the central bank. The AUD/USD trades at 0.6590, down 0.11%.
Dollar holds firm after Powell stresses dual mandate; upbeat US housing data offsets cooling PMIs
On Tuesday, Powell said that the policy path is difficult for the Fed, which must look at both goals of the dual mandate “equally,” pushing back against almost certain rate cuts coming in the subsequent meetings. Nevertheless, market participants seem confident that the US central bank will reduce rates twice towards the end of the year.
Powell added that risks in the labor market had risen and that inflation remains somewhat elevated. He acknowledged that policy remains modestly restrictive, but “well positioned to respond to potential economic developments.”
Data-wise, New Home Sales in August improved sharply, from 0.664 million to 0.8 million, a 20.5% increase exceeding forecasts of 0.65 million. Although the data was positive, the latest S&P Global Purchasing Managers Index (PMI) prints in the services and manufacturing sector, indicating the economy is cooling.
Ahead, traders will eye the release of Jobless Claims, Gross Domestic Product (GDP) figures and the Fed’s inflation gauge, the Core PCE Price Index for August.
In Australia inflation metrics witnessed the CPI climbing from 2.8% to 3.0% — the top end of the RBA's target range. Consequently, the chances for additional easing by the Reserve Bank of Australia (RBA) remain slim, just at 8%. The RBA will meet next week on September 30, with markets participants expecting the bank to hold rates.
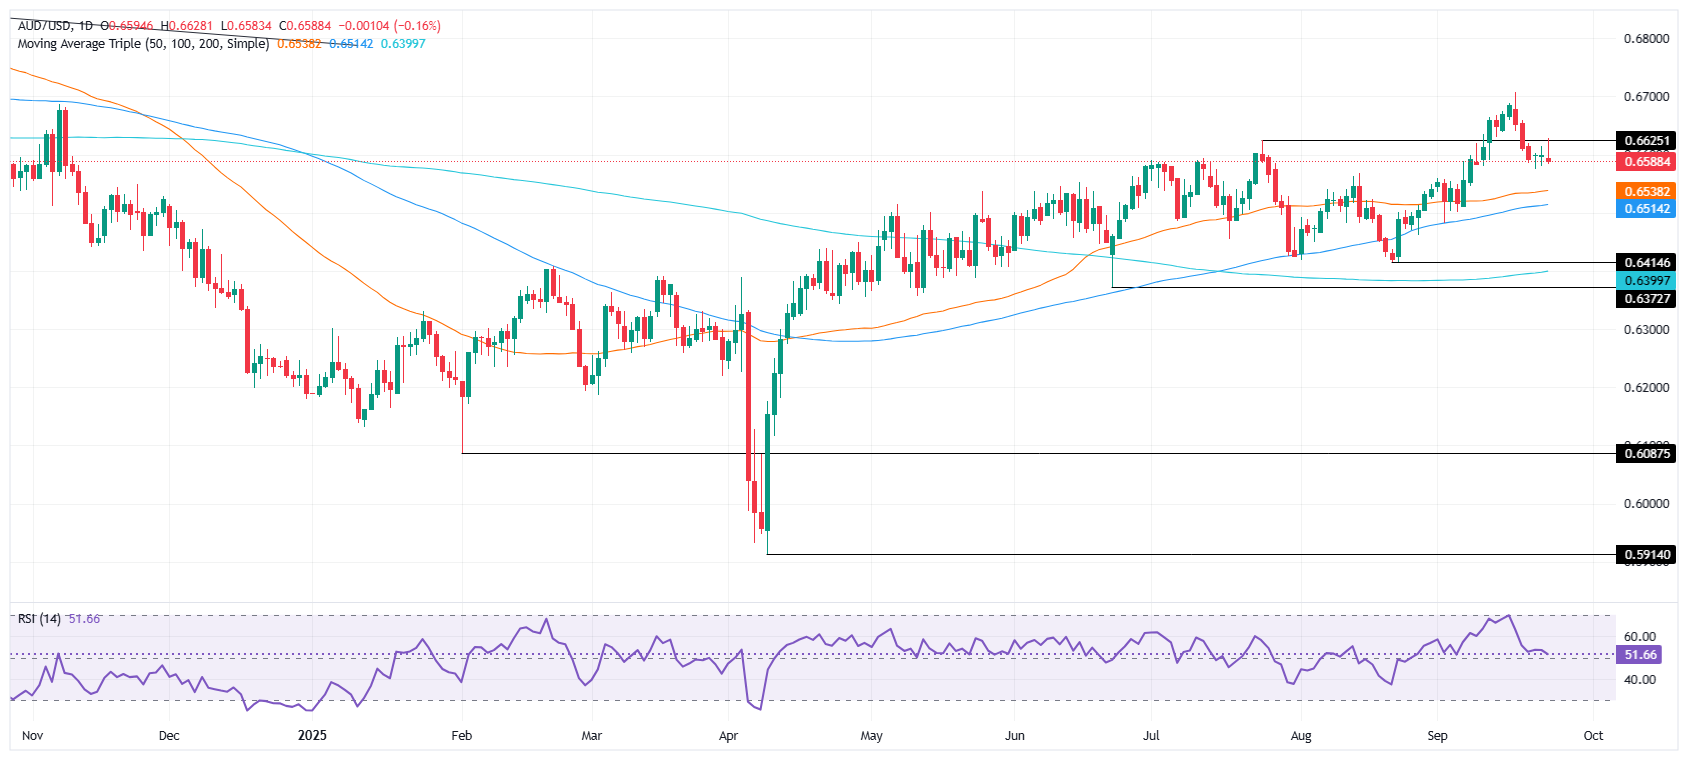
AUD/USD Price Forecast: Technical outlook
The technical picture suggests that the AUD/USD could test lower prices, despite hoovering around the 20-day SMA at 0.6593. Buyers need a daily close above 0.6600 so they could challenge daily highs of 0.6628 ahead of 0.6650. Conversely, a drop below the 20-day SMA clears the path to challenge weekly lows of 0.6574, before extending its losses to the 50-day SMA at 0.6538. the next support lies at the 100-day SMA a 0.6514.
Australian Dollar Price This Month
The table below shows the percentage change of Australian Dollar (AUD) against listed major currencies this month. Australian Dollar was the strongest against the New Zealand Dollar.
| USD | EUR | GBP | JPY | CAD | AUD | NZD | CHF | |
|---|---|---|---|---|---|---|---|---|
| USD | -0.38% | 0.36% | 1.19% | 1.13% | -0.63% | 1.30% | -0.55% | |
| EUR | 0.38% | 0.74% | 1.50% | 1.51% | -0.26% | 1.68% | -0.18% | |
| GBP | -0.36% | -0.74% | 0.64% | 0.76% | -1.00% | 0.94% | -0.86% | |
| JPY | -1.19% | -1.50% | -0.64% | 0.00% | -1.79% | 0.14% | -1.69% | |
| CAD | -1.13% | -1.51% | -0.76% | -0.00% | -1.73% | 0.17% | -1.61% | |
| AUD | 0.63% | 0.26% | 1.00% | 1.79% | 1.73% | 1.95% | 0.13% | |
| NZD | -1.30% | -1.68% | -0.94% | -0.14% | -0.17% | -1.95% | -1.78% | |
| CHF | 0.55% | 0.18% | 0.86% | 1.69% | 1.61% | -0.13% | 1.78% |
The heat map shows percentage changes of major currencies against each other. The base currency is picked from the left column, while the quote currency is picked from the top row. For example, if you pick the Australian Dollar from the left column and move along the horizontal line to the US Dollar, the percentage change displayed in the box will represent AUD (base)/USD (quote).
Recommended Articles


