

AUD/USD Price Analysis: Bulls flirt with 200-hour SMA/50% Fibo. confluence, US NFP awaited

- Iran Situation Rekindles Threat of War. Bitcoin Price Decline Accelerates, $75,000 Geopolitical Defense Line Faces Test
- WTI declines below $102.00 after Trump says he called off Iran attacks
- Gold edges higher to near $4,700 as Trump-Xi summit looms
- Euro softens to near 1.1600 on US–Iran tensions
- Australian Dollar softens to near 0.7200 as Trump and Xi set for second day of talks
- Bitcoin Price Forecast: BTC battles at key technical zone amid mixed flow signals
●AUD/USD trades with a mild positive bias for the second straight day on Friday.
●The setup seems tilted in favour of bulls and supports prospects for further gains.
●Traders, however, seem reluctant to place aggressive bets ahead of the NFP report.
The AUD/USD pair ticks higher during the Asian session on Friday, albeit lacks any follow-through and struggles to make it through the 200-hour Simple Moving Average (SMA). Spot prices, however, manage to hold comfortably above a two-week low touched on Thursday and hold steady just above the 0.6600 mark as traders keenly await the release of the US NFP report for a fresh impetus.
From a technical perspective, the aforementioned handle coincides with the 50% Fibonacci retracement level of this week's sharp pullback from the highest level since August. Meanwhile, oscillators on the daily chart are still holding in the positive territory.
Hence, a convincing breakout through the said confluence hurdle should lift the AUD/USD pair beyond the 61.8% Fibo. level, around the 0.6625-0.6630 area, towards the next relevant resistance near mid-0.6600s. Some follow-through buying could pave the way for a further appreciating move and allow bulls to make a fresh attempt towards conquering the 0.6700 round figure.
On the flip side, the 100-hour SMA, currently pegged near the 0.6590-0.6585 region, might now protect the immediate downside. The said area nears the 50% Fibo. level, which if broken decisively could drag the AUD/USD pair further towards the 0.6545 intermediate support en route to a two-week trough, around the 0.6525 area.
This is followed by the 0.6500 psychological mark, below which the downward trajectory could get extended further towards the 0.6460 horizontal resistance breakpoint, now turned support. Spot prices could eventually weaken below the 0.6400 mark and test the 0.6350-0.6345 support zone.
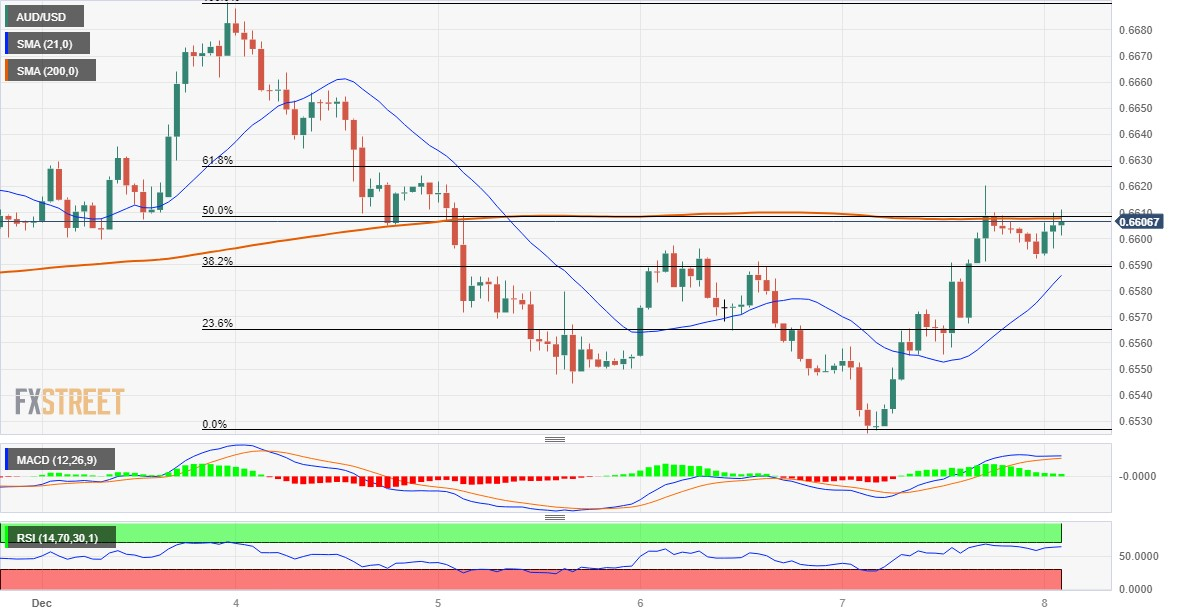
AUD/USD 1-hour chart, Source: TradingView.
Read more
* The content presented above, whether from a third party or not, is considered as general advice only. This article should not be construed as containing investment advice, investment recommendations, an offer of or solicitation for any transactions in financial instruments.


