

Top 3 Price Prediction: Bitcoin, Ethereum, Ripple – BTC, ETH, and XRP extend gains, gear up for another bullish week

- Gold Prices Under Pressure After Hitting $4,600, UBS: Safe-Haven Logic Unchanged But Only Delayed.
- US-Iran Rift Persists, Will Gold Rise or Fall Next?
- Gold rallies on hopes for US-Iran talks and falling US Treasury yields
- Gold Price Forecast: XAU/USD opens lower around $4,450 on fears of widening Iran conflicts
- USD/JPY Hits 160.00 Mark, Will Japanese Government Intervene? Will the Currency’s Rally Be Contained?
- Seesaw Effect Continues. US Pre-Market Three Major Index Futures Weaken, Oil Prices Rise, Bitcoin Drops Below 68,000 Mark

Bitcoin price trades in green on Monday after rallying over 5% in the previous week.
Ethereum price is nearing key resistance at $4,232, a successful breakout could pave the way for further upside.
XRP shows signs of a rally, with momentum indicators pointing to strengthening bullish momentum.
Bitcoin (BTC), Ethereum (ETH), and Ripple (XRP) extend gains on Monday after rallying more than 5%, 4%, and 10%, respectively, in the previous week amid improving market sentiment. The technical outlook for these top three cryptocurrencies suggests further upside potential, with momentum indicators signaling strengthening bullish momentum.
Bitcoin bulls aiming for $120,000 mark
Bitcoin price found support around the 61.8% Fibonacci retracement level (drawn from the April low of $74,508 to the record high of $126,199) at $106,453 on Wednesday. BTC rose 6.57% in the next four days and closed above the 50-day Exponential Moving Average (EMA) at $113,397. At the time of writing on Monday, BTC trades above $114,975, nearing the key resistance at $115,137.
If BTC closes above the 78.6% Fibonacci retracement at $115,137, it could extend the rally toward the psychologically important $120,000 level.
The Relative Strength Index (RSI) on the daily chart reads 54, above the neutral level of 50, indicating bullish momentum gaining traction. Additionally, the Moving Average Convergence Divergence (MACD) showed a bullish crossover on Sunday, providing a buy signal and further supporting the bullish view.
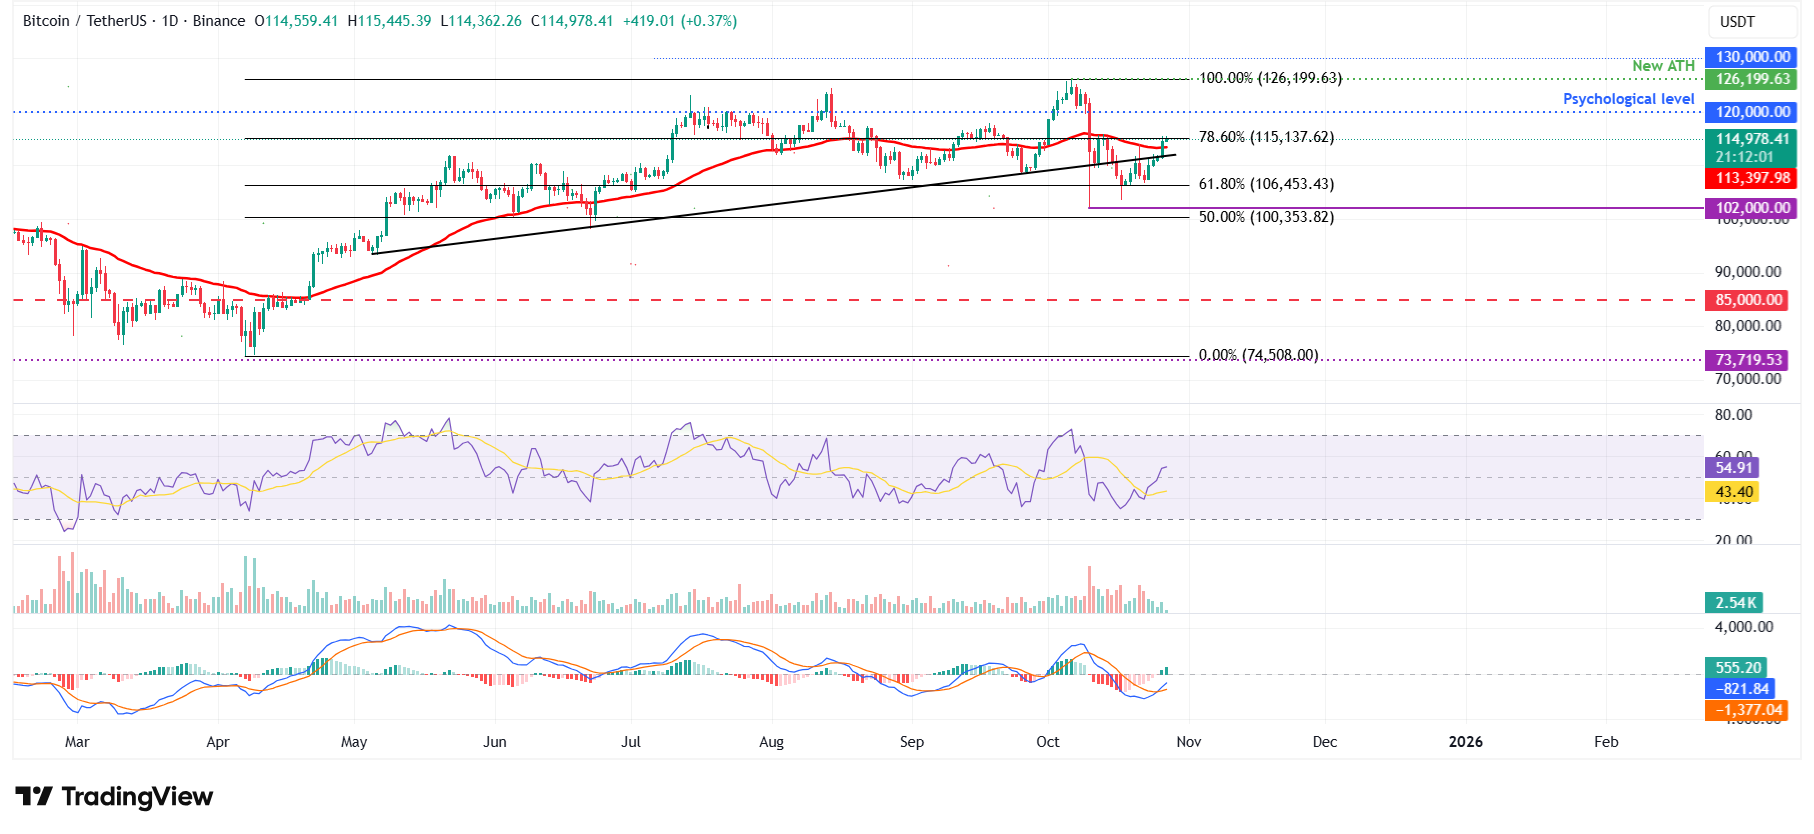
BTC/USDT daily chart
However, if BTC faces rejection from the $115,137 level, it could extend the decline toward the 50-day EMA at $113,397.
Ethereum shows bullish signs on momentum indicators
Ethereum price rose nearly 5% last week and closed above the 50-day EMA at $4,129 on Sunday. At the time of writing on Monday, ETH continues its rally, trading above $4,206.
If ETH breaks and closes above the daily resistance at $4,232, it could extend the rally toward the next daily resistance at $4,488.
Like Bitcoin, Ethereum’s RSI and MACD show bullish momentum, gaining traction and supporting the bullish view.
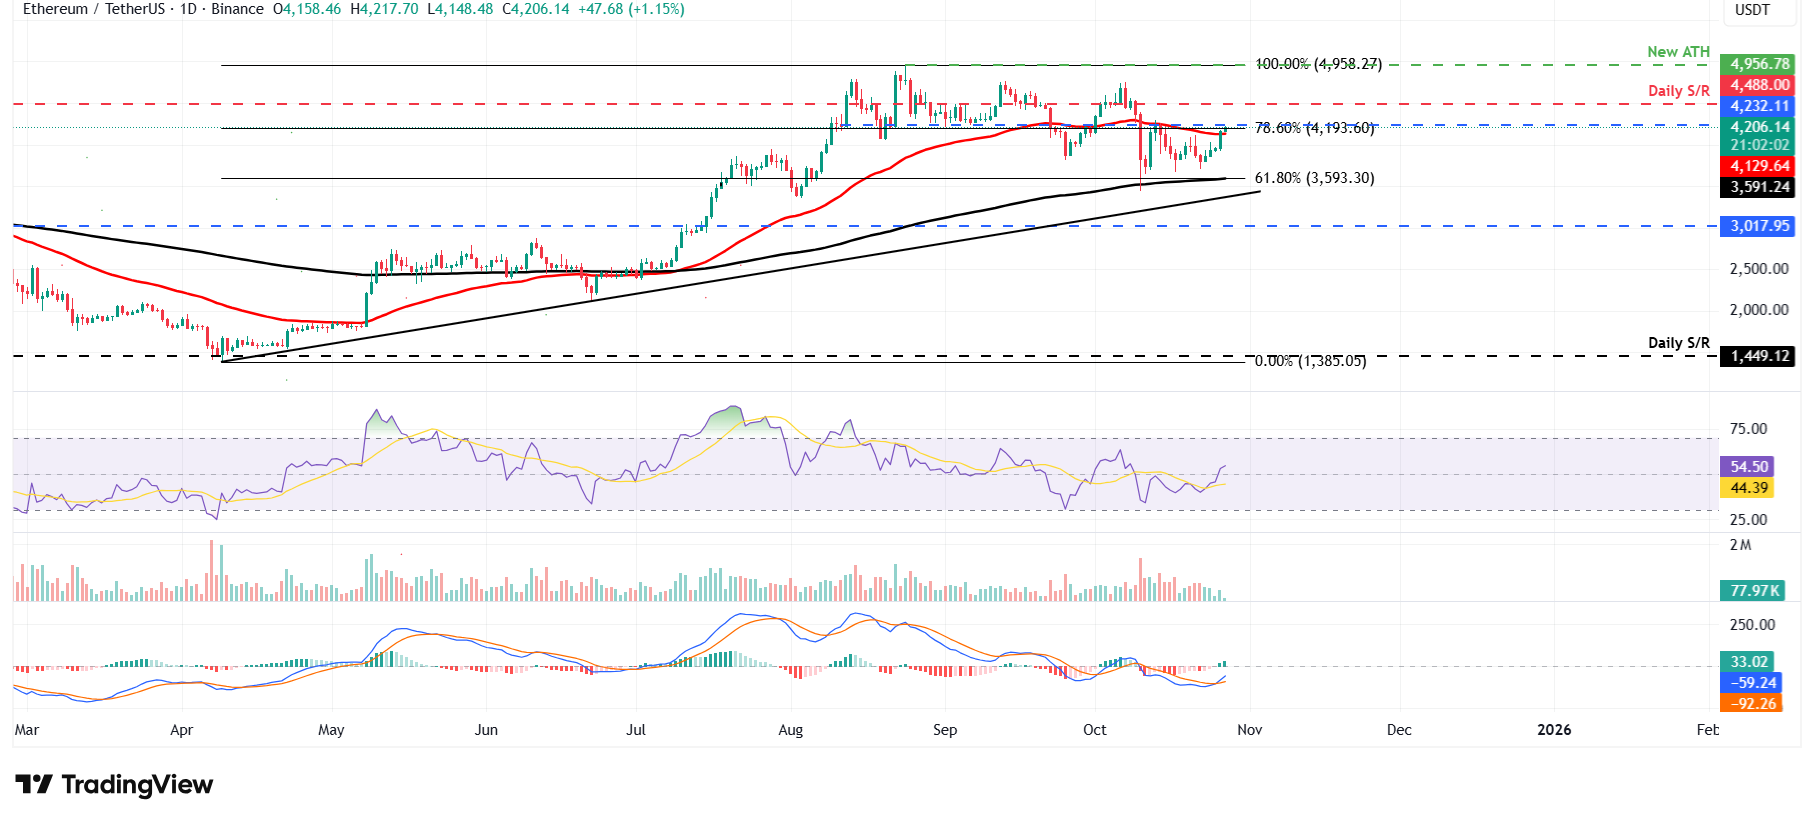
ETH/USDT daily chart
On the other hand, if ETH faces a correction, it could extend the decline toward the 61.8% Fibonacci retracement at $3,593.
XRP shows potential for further upside
XRP gained more than 10% in the previous week, closing above the previously broken trendline and the 200-day EMA at $2.61 on Sunday. At the time of writing on Monday, it is nearing the key resistance at $2.69.
If XRP breaks and closes above the key resistance at $2.69, it could extend the gains toward the next daily resistance at $3.40.
Like Bitcoin and Ethereum, XRP’s RSI and MACD show bullish momentum, gaining traction and supporting the bullish view.
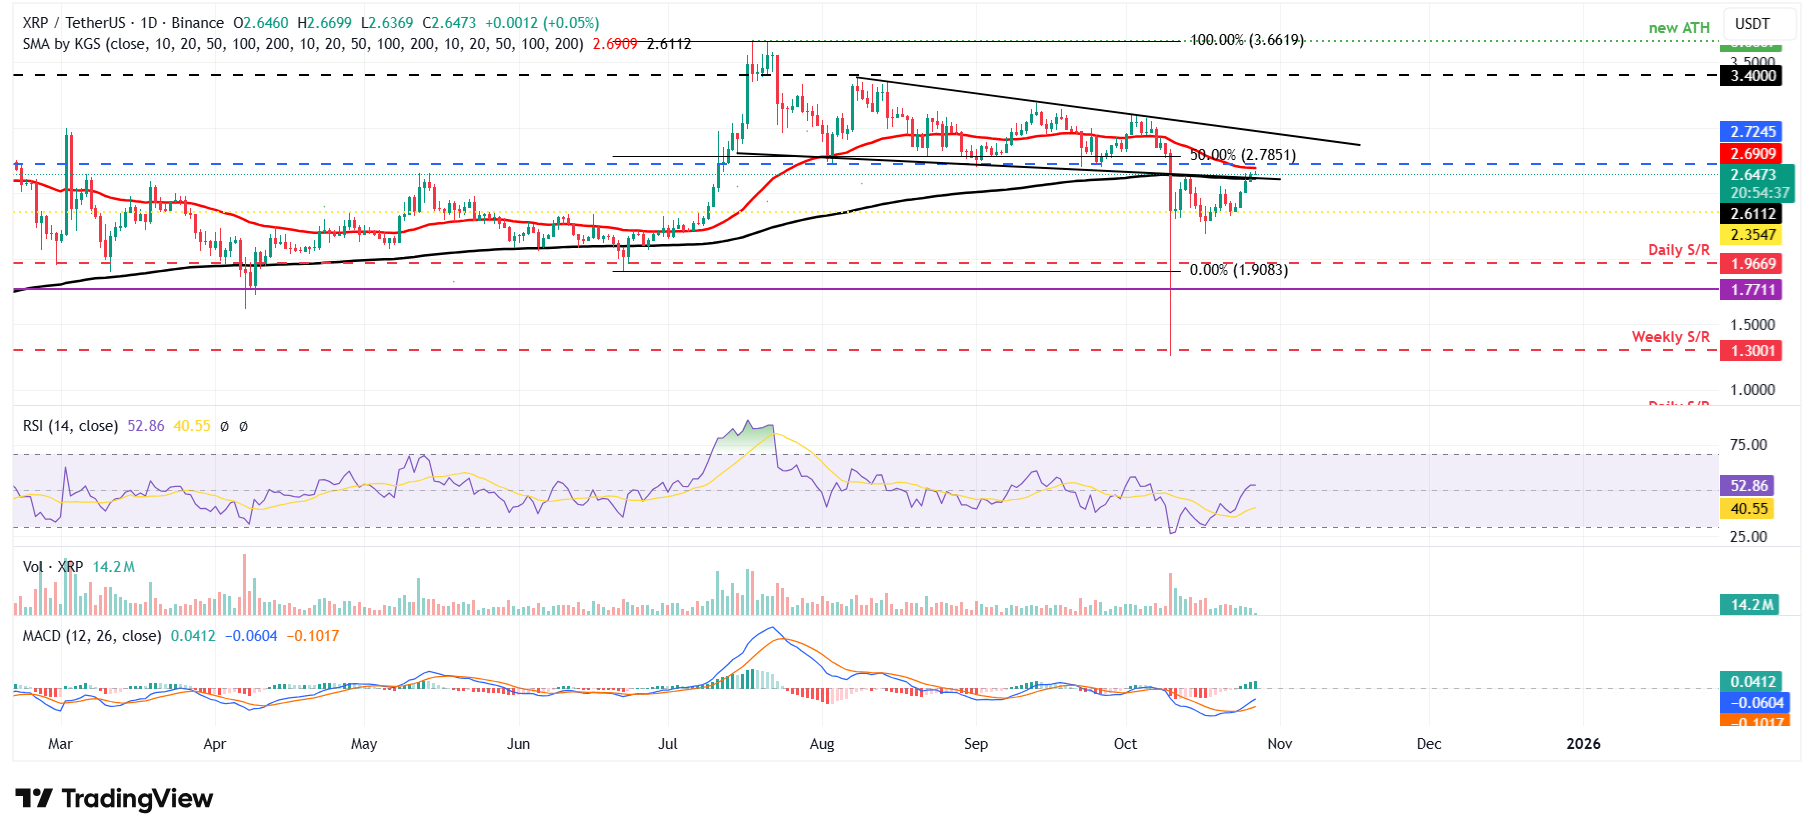
XRP/USDT daily chart
On the other hand, if XRP faces a correction, it could extend the decline toward the key daily support at $2.35.
Read more
* The content presented above, whether from a third party or not, is considered as general advice only. This article should not be construed as containing investment advice, investment recommendations, an offer of or solicitation for any transactions in financial instruments.


