

Top 3 Price Prediction: BTC, ETH, and XRP pause recovery near key technical barriers

- Bitcoin Drops to $70,000. U.S. Government Refuses to Bail Out Market, End of Bull Market or Golden Pit?
- Gold rallies further beyond $5,050 amid flight to safety, dovish Fed expectations
- Bitcoin Bottom Debate: $70,000 or $50,000?
- A Crash After a Surge: Why Silver Lost 40% in a Week?
- Bitcoin Slips Below 75,000 Mark. Will Strategy Change Its Mind and Sell?
- Bitcoin Rout. Bridgewater Founder Dalio Publicly Backs Gold.

Bitcoin price faces rejection from the 50-day EMA at $115,416, signaling weakness in its ongoing recovery.
Ethereum price declined after retesting its daily resistance at $4,232, a close above suggests further recovery.
XRP faces rejection from the lower trendline of a falling wedge pattern, indicating a potential correction in the near term.
Bitcoin (BTC), Ethereum (ETH) and Ripple (XRP) paused their recovery as these major cryptos faced resistance at key technical levels. The short-term sentiment remains mixed with traders closely watching whether the top three cryptocurrencies can sustain their recovery momentum or face renewed selling pressure near their respective technical barriers.
Bitcoin recovery pauses after retesting key resistance zone
Bitcoin price recovered slightly on Sunday, closed above $114,900 after a sharp fall on Friday. BTC continued its recovery on Monday and retested the 78.6% Fibonacci retracement level at $115,137 (drawn from the April low of $74,508 to the October 6 high of $126,199). This level roughly coincides with the 50-day Exponential Moving Average (EMA) at $115,420, making it a key resistance zone. On Tuesday, BTC declined by 1.86% after retesting the resistance zone, but found support around the ascending trendline. At the time of writing on Wednesday, it hovers around $112,800.
If BTC continues its correction, it could extend the decline toward the daily support level at $107,245.
The Relative Strength Index (RSI) reads 43 on the daily chart, which is below its neutral level of 50, indicating bearish momentum is gaining traction. Additionally, the Moving Average Convergence Divergence (MACD) showed a bearish crossover on Friday, which still holds, further supporting the bearish view.
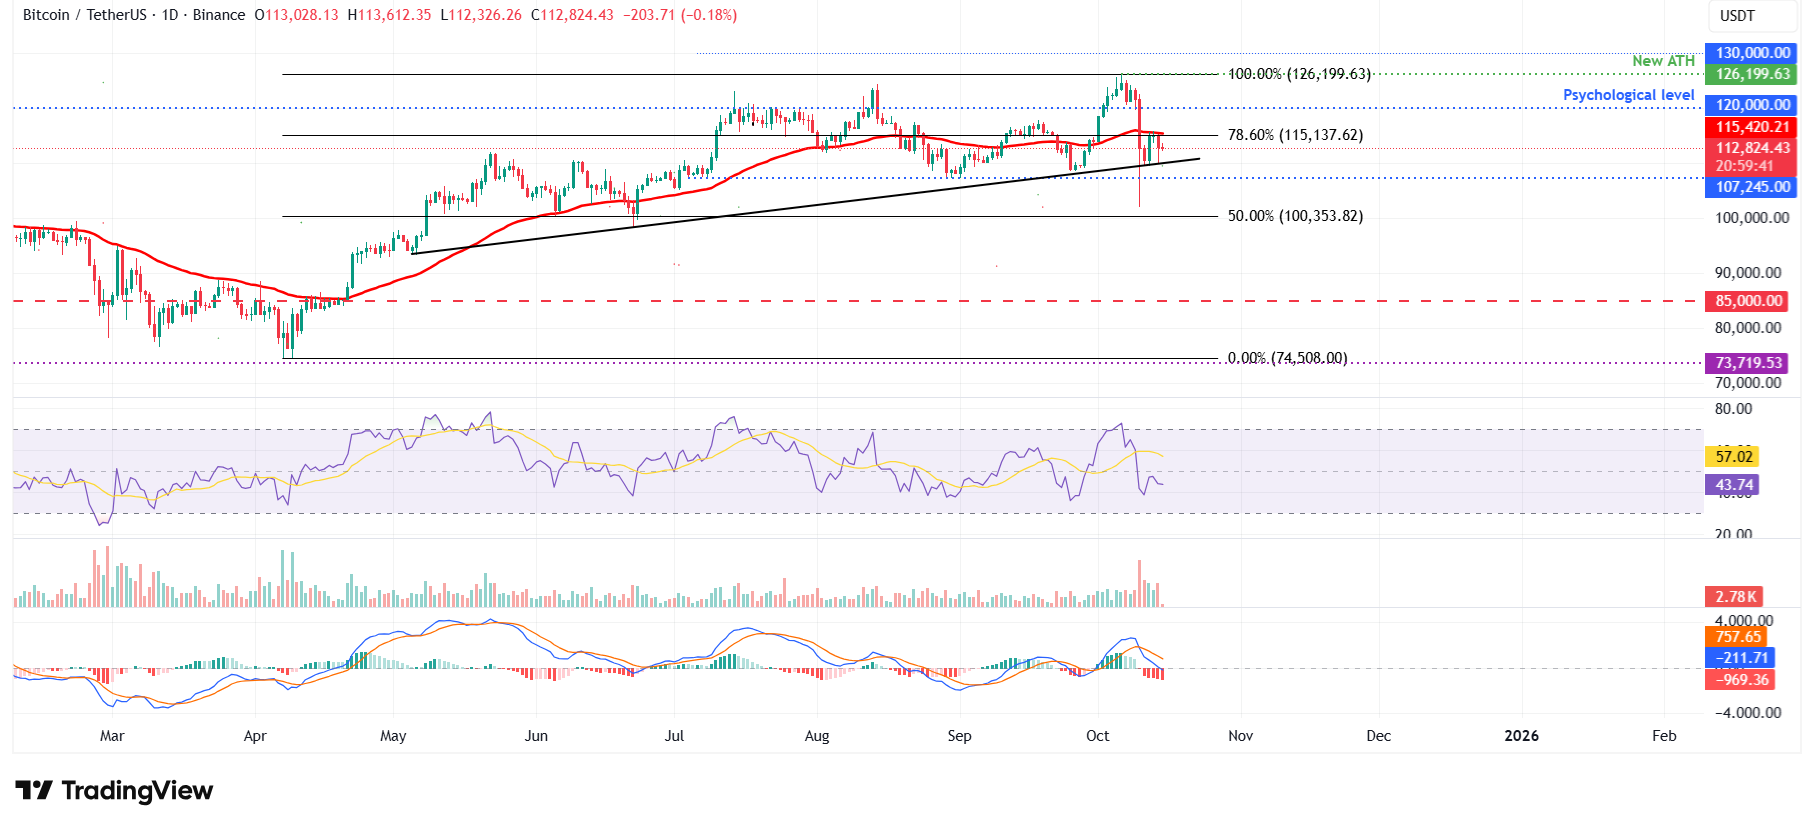
BTC/USDT daily chart
On the other side, if BTC recovers, it could extend the recovery toward the 50-day EMA at $115,472.
Ethereum declines as it retests daily resistance at $4,232
Ethereum price found support around the 61.8% Fibonacci retracement level at $3,953 (drawn from the April low of $1,385 to the record high of $4,956) on Saturday and recovered by 13% in the next two days. On Tuesday, ETH declined slightly after falling below the daily resistance level at $4,232, which roughly coincides with the 50-day EMA and the 78.6% Fibonacci retracement level. At the time of writing on Wednesday, it hovers around $4,098.
If ETH continues its pullback, it could extend the decline toward the 61.8% Fibonacci retracement level at $3,953.
Like Bitcoin, Ethereum’s RSI and MACD indicators also support the bearish view.
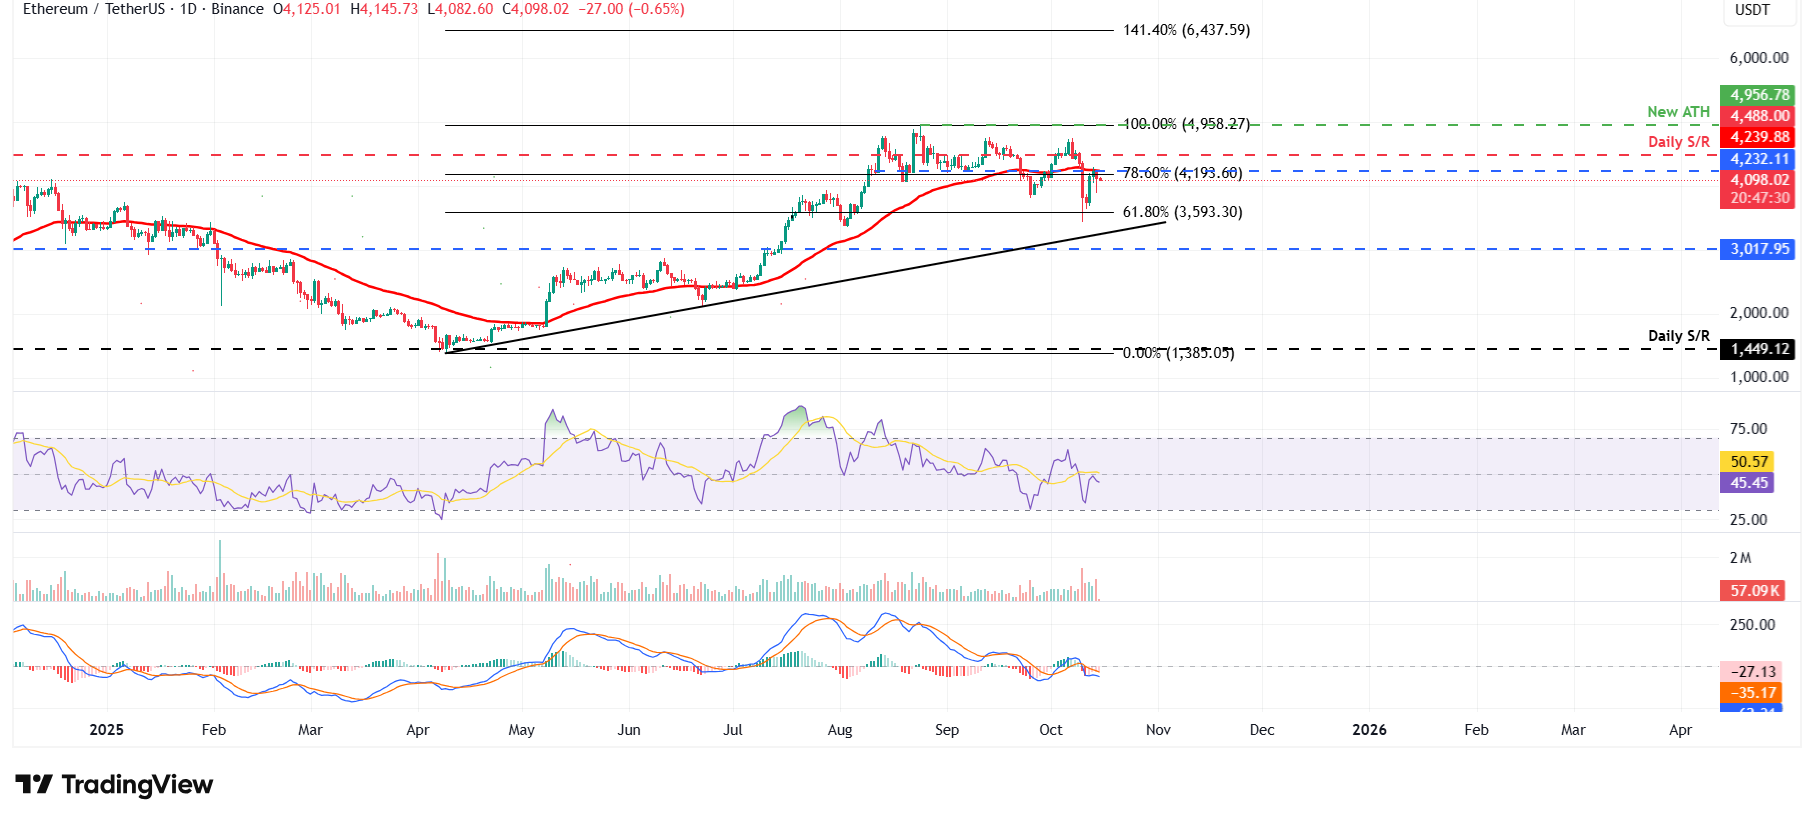
ETH/USDT daily chart
However, if ETH breaks above the $4,232 level and finds support around it, the rally could extend toward the next daily resistance at $4,488.
XRP finds rejection from the lower trendline of a falling wedge pattern
Ripple price found support around the daily support level at $2.35 on Saturday and recovered over 10% in the next two days. On Tuesday, XRP declined after it found resistance around the lower trendline of a falling wedge pattern. At the time of writing on Wednesday, it hovers around $2.48.
If XRP continues its correction, it could extend the decline toward the daily support at $2.35.
Like Bitcoin and Ethereum, XRP’s momentum indicators, RSI and MACD, also support the bearish view.
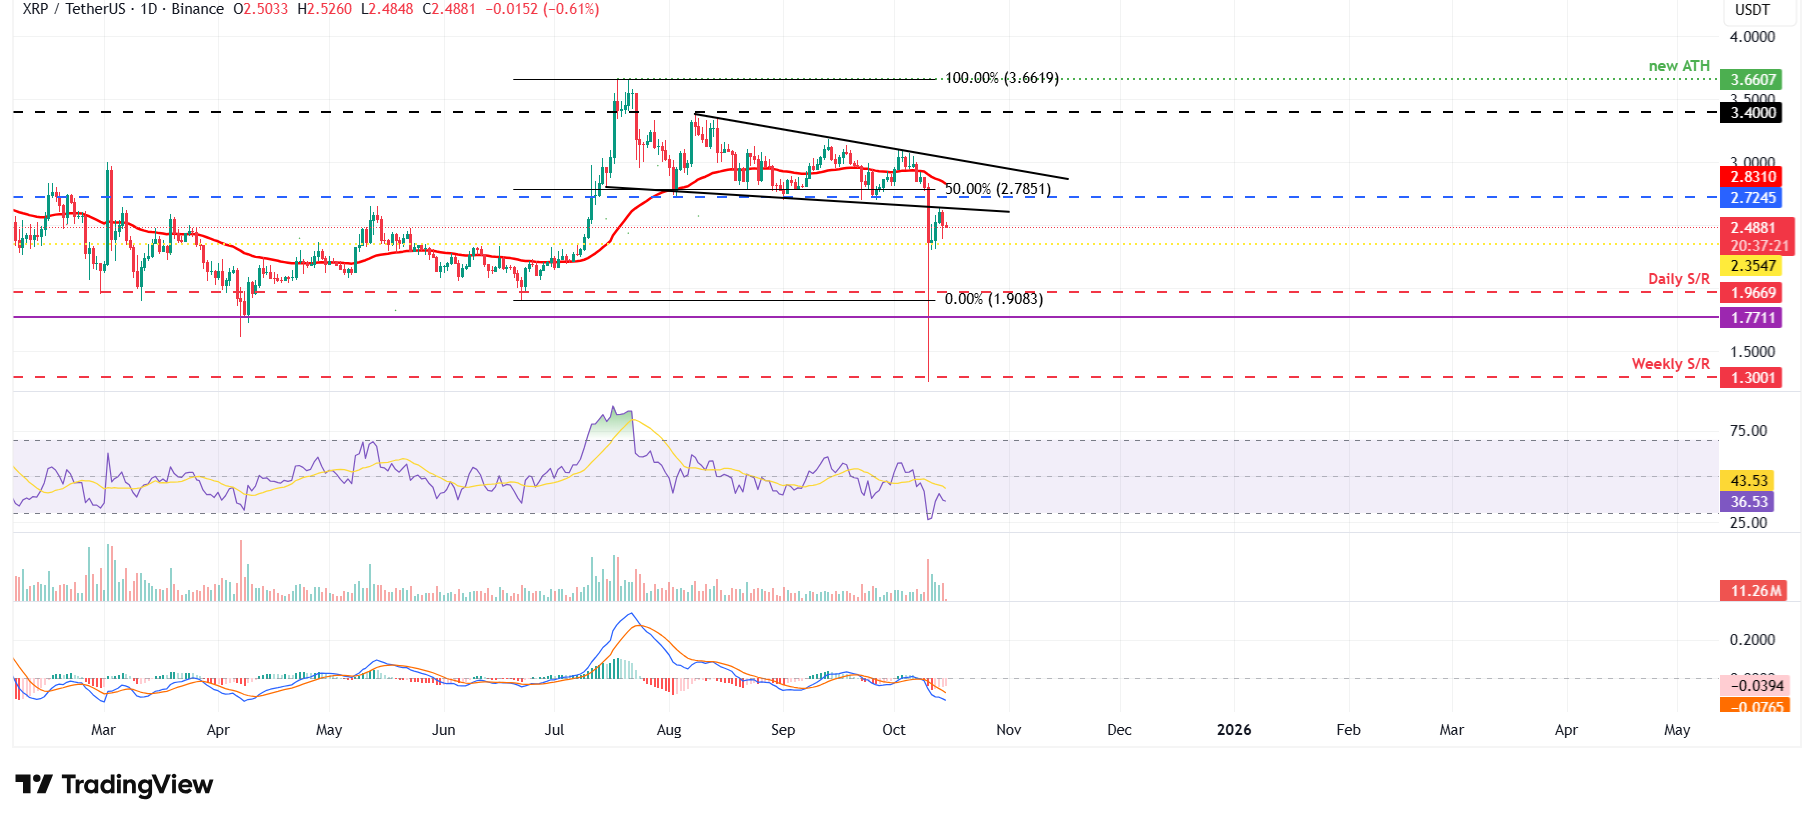
XRP/USDT daily chart
On the other hand, if XRP recovers, it could extend the recovery toward the 50-day EMA at $2.83.
Read more
* The content presented above, whether from a third party or not, is considered as general advice only. This article should not be construed as containing investment advice, investment recommendations, an offer of or solicitation for any transactions in financial instruments.


