

Silver Price Forecasts: XAG/USD drops below $75.00 after Trump - Zelenkyy’s meeting

- Today’s Market Recap: US and Iran Signal Willingness to End Conflict, Three Major US Stock Indexes Surge, Dollar Ends Five-Day Winning Streak
- US-Iran Rift Persists, Will Gold Rise or Fall Next?
- Trump Withdrawal Intent Reshapes Liquidity, Bitcoin Breaks $68,000 Mark
- Gold rallies on hopes for US-Iran talks and falling US Treasury yields
- Gold Price Forecast: XAU/USD opens lower around $4,450 on fears of widening Iran conflicts
- USD/JPY Hits 160.00 Mark, Will Japanese Government Intervene? Will the Currency’s Rally Be Contained?

Silver dives from all-time highs near $86.00 to levels below $75.00.
Higher hopes of a peace deal in Ukraine are weighing on precious metals.
Growing tensions between China and Taidan might limit Silver's reversal.
Silver (XAG/USD) has lost more than $10 since hitting a fresh record high near $86.00 on Monday’s early trading. The precious metal has retreated to levels in the $74.00 area at the time of writing, weighed by comments by US President Trump about the chances of a peace deal in Ukraine.
Trump appeared at a news conference, together with Ukrainian President Volodymyr Zelenskyy, late Sunday, and said that he thinks that peace in Ukraine is “a lot closer,” although he acknowledged that thorny issues remain.
Meanwhile, China has announced “major” military exercises around Taiwan, and Taipei affirmed that several Chinese vessels have been seen near Taiwan’s territorial waters. A further escalation of tensions in an already sensitive area, which might limit the current reversal of precious metals.
Technical Analysis: Silver corrects from overbought levels
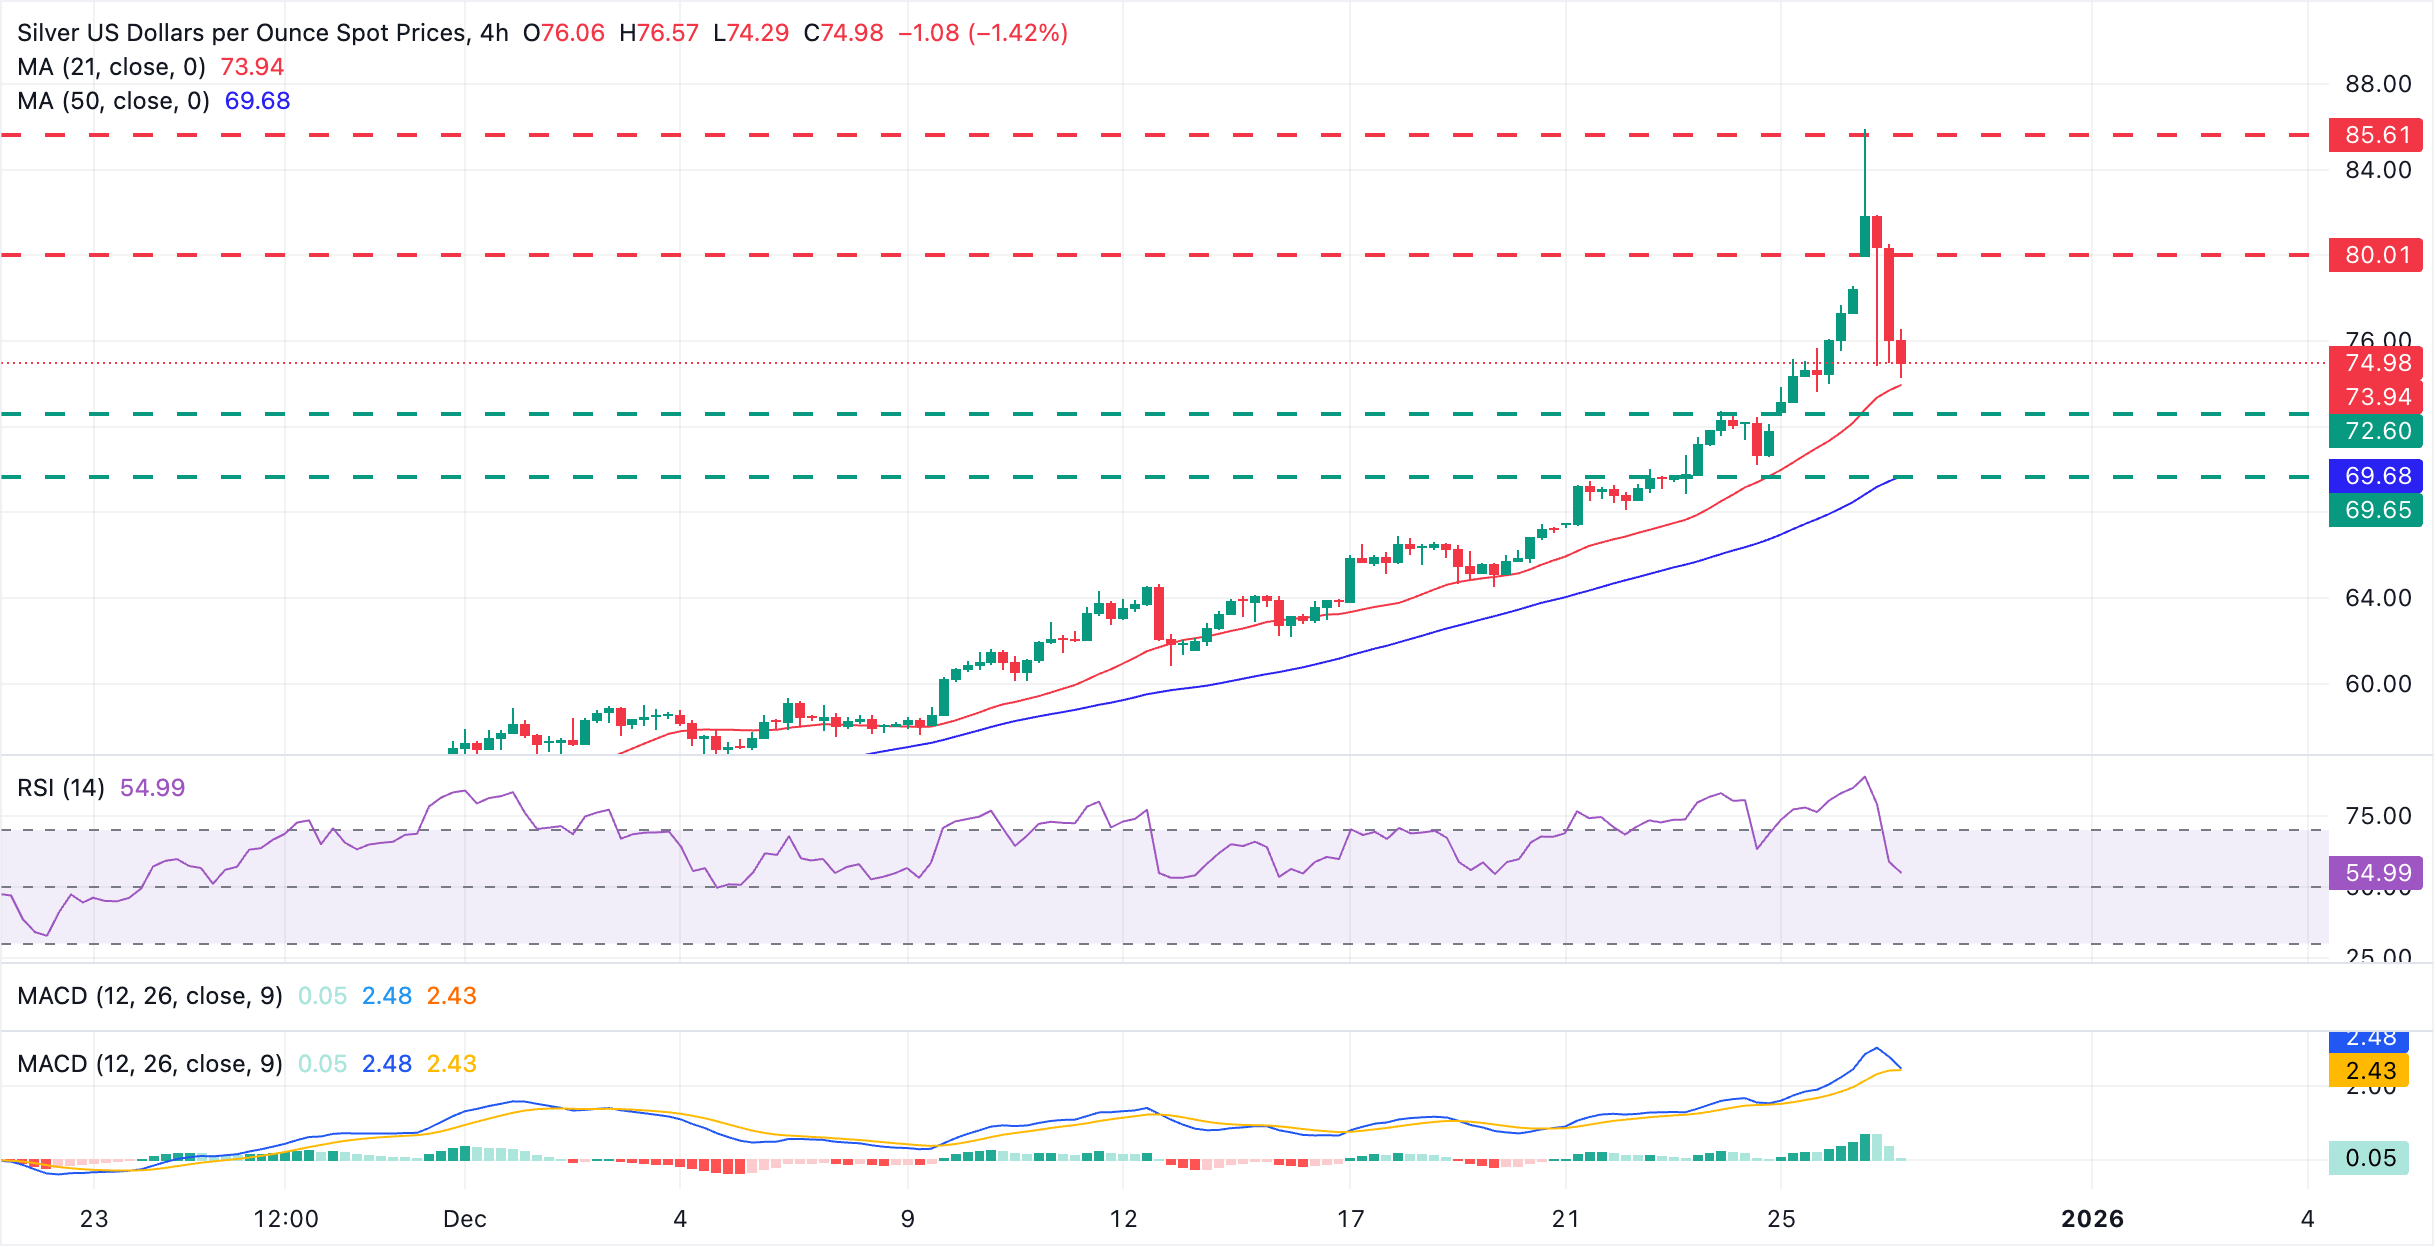
In the 4-hour chart, XAG/USD trades at $74.92, approaching the 21-period Simple Moving Average (SMA), at the $74.00 area, which is providing support and highlights the broader bullish bias. The Relative Strength Index (RSI) stands at 54.79, near neutral levels, after unwinding from overbought territory, while the Moving Average Convergence Divergence (MACD) turns lower toward the zero line after recent highs, suggesting waning upside momentum.
Below the mentioned 21-day SMA, the next support levels are seen at $72.60, where the pair was capped on December 24, and the area between $69.60 and $70.20, where the 50-period SMA converges with the December 24 low and the December 22 high.
To the upside, the $80.00 psychological level is likely to check the strength of a potential bullish reversal, ahead of the all-time high, at $85.87 hit earlier on the day.
(The technical analysis of this story was written with the help of an AI tool)
Read more
Disclaimer: The content available on Mitrade Insights is provided for informational and marketing purposes only. It has not been prepared in accordance with legal requirements designed to promote the independence of investment research and is not subject to any prohibition on dealing ahead of the dissemination of investment research.
Nothing in this material constitutes investment advice, personal recommendation, investment research, an offer, or a solicitation to buy or sell any financial instrument. The content has been prepared without consideration of your individual investment objectives, financial situation, or needs, and should not be treated as such.
Past performance is not a reliable indicator of future performance and/or results. Forward-looking scenarios or forecasts are not a guarantee of future performance. Actual results may differ materially from those anticipated.
Mitrade makes no representation or warranty as to the accuracy or completeness of the information provided and accepts no liability for any loss arising from reliance on such information.


