
US Dollar retreats after data-driven rally, eyes on Consumer Sentiment
- The US Dollar is pulling back on Friday despite strong domestic data and signs of a resilient labor market.
- US Treasury yields dip from recent highs, amplifying pressure on the Greenback.
- The technical setup on DXY indicates fading momentum below the 50-day EMA following a breakout from a falling wedge.
The US Dollar (USD) is losing steam on Friday, pulling back from three-week highs as momentum cools. Still, the Greenback remains supported by robust US economic data released this week, which has reduced the likelihood of immediate interest rate cuts by the Federal Reserve (Fed).
The US Dollar Index (DXY), which tracks the Greenback against a basket of six major currencies, is down around 0.36%, hovering near 98.30 in Friday’s European session. The pullback comes after the index touched a three-week high on Thursday, briefly approaching the 99.00 mark.
This week’s US data has reinforced the narrative of a resilient economy and sticky inflation, which supports the US Dollar.
Retail Sales and Initial Jobless Claims indicated robust consumer demand and ongoing labor market strength. Meanwhile, the Philadelphia Fed Manufacturing Index surprised to the upside, surging to 15.9 in July from -4.0 in June and defying consensus calls for a negative reading. On the inflation front, both the Consumer Price Index (CPI) and the Producer Price Index (PPI) signaled lingering price pressures, reminding markets that inflation isn’t yet fully tamed.
These numbers come as trade frictions from US President Trump’s trade policy persist, raising the odds that the Fed will hold interest rates steady for longer.
The market focus shifts to the University of Michigan Consumer Sentiment data, scheduled for release at 14:00 GMT. The report will provide fresh insights into household confidence and inflation expectations. A strong reading could revive the US Dollar buying and push DXY back toward recent highs, while a soft print might accelerate Friday's pullback.
Market Movers: Yields slide, trade tensions flare, and diverging Fed views
- The yield on the 10-year US Treasury note fell to 4.44% on Friday, pulling back from a five-week high of 4.50% earlier in the week. The drop in yields is reinforcing the downward pressure on the US Dollar.
- The US Commerce Department imposed preliminary anti-dumping duties of 93.5% on Chinese graphite imports after determining the goods were unfairly subsidized, Bloomberg News reported. The decision follows a December petition by the American Active Anode Material Producers, which accused Chinese companies of violating anti-dumping laws. With existing tariffs already in place, the total effective duty now stands at 160%, according to the group. This marks a significant escalation in US-China trade tensions, especially in critical sectors like clean energy and EVs. The move may also trigger retaliation from Beijing, adding another layer of uncertainty to the broader trade outlook.
- Market nerves were rattled this week amid rumors that President Trump might fire Fed Chair Jerome Powell. Tensions eased after Trump walked back the threat, calling it “highly unlikely” that he would dismiss Powell. Still, the headlines reignited concerns about political interference in monetary policy. The Greenback recovered as the immediate risk faded, but uncertainty over the Fed's independence continues to cloud the outlook for the US Dollar.
- Alongside his criticism of Fed Chair Jerome Powell, President Trump has repeatedly pressured the Federal Reserve publicly, calling for lower interest rates. Arguing that current borrowing costs are too restrictive for consumers and businesses, Trump has blamed the Fed for “slowing down the economy” and warned that inaction could undermine US competitiveness. While Fed officials have reiterated their commitment to data-dependent policy, Trump’s persistent pressure is fueling market debate over whether political influence could tilt the trajectory of monetary policy in the months ahead.
- On late Thursday, Fed Governor Christopher Waller, a leading contender to succeed Powell, renewed his call for a 25-basis-points rate cut at the July meeting. Waller downplayed tariff-driven inflation as a "one-off" price shock, arguing it doesn’t justify keeping policy tight. He stressed that monetary policy should be closer to neutral, not restrictive, and flagged growing risks in the labor market, noting private-sector job growth is near stall speed. In contrast, New York Fed President John Williams warned on Wednesday that tariff-related inflation is just beginning to feed into the economy and could persist through 2026. While both emphasized the importance of Fed independence, their diverging views on policy timing added to market uncertainty around the Fed’s next move.
- The latest dot plot shows the Fed expects to lower the benchmark rate to around 3.9% by the end of this year from the current 4.25-4.50% range. This implies two 25bps cuts in the second half of the year.
Technical Analysis: DXY rally pauses below 50-day EMA
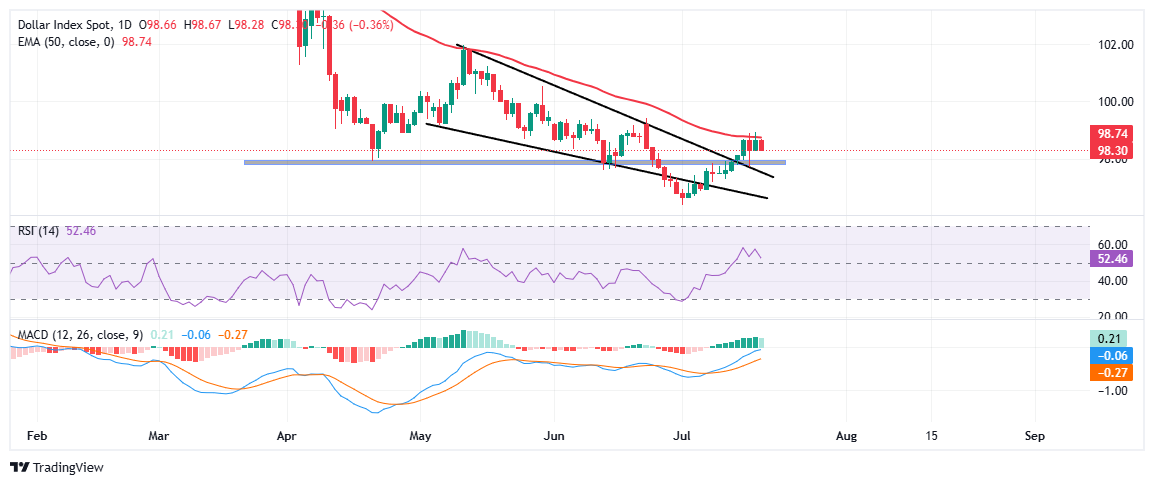
The US Dollar Index (DXY) faced a strong rejection near the 99.00 psychological level after breaking out of a falling wedge pattern earlier this week. Price pierced above the wedge’s upper trendline, but bullish momentum has stalled just below the 50-day EMA at 98.74, which is acting as key resistance.
A confirmed daily close above this level could open the door toward 99.50-100.00, while immediate support lies near 97.80-98.00, a former resistance zone that may now serve as a floor.
Momentum indicators reflect a cautiously bullish bias. The Relative Strength Index (RSI) on the daily chart is holding above the midpoint at around 53, signaling buyers are still in control, albeit without strong conviction.
The Moving Average Convergence Divergence (MACD) remains positive, with the MACD line still above the signal line, reinforcing the upside bias. However, both indicators show signs of waning momentum, suggesting a period of consolidation or a potential pullback before the next decisive move.
US Dollar PRICE Today
The table below shows the percentage change of US Dollar (USD) against listed major currencies today. US Dollar was the strongest against the Japanese Yen.
| USD | EUR | GBP | JPY | CAD | AUD | NZD | CHF | |
|---|---|---|---|---|---|---|---|---|
| USD | -0.41% | -0.29% | -0.06% | -0.22% | -0.53% | -0.61% | -0.50% | |
| EUR | 0.41% | 0.14% | 0.35% | 0.19% | -0.12% | -0.31% | -0.09% | |
| GBP | 0.29% | -0.14% | 0.22% | 0.08% | -0.24% | -0.40% | -0.20% | |
| JPY | 0.06% | -0.35% | -0.22% | -0.16% | -0.47% | -0.65% | -0.34% | |
| CAD | 0.22% | -0.19% | -0.08% | 0.16% | -0.33% | -0.47% | -0.27% | |
| AUD | 0.53% | 0.12% | 0.24% | 0.47% | 0.33% | -0.15% | 0.04% | |
| NZD | 0.61% | 0.31% | 0.40% | 0.65% | 0.47% | 0.15% | 0.20% | |
| CHF | 0.50% | 0.09% | 0.20% | 0.34% | 0.27% | -0.04% | -0.20% |
The heat map shows percentage changes of major currencies against each other. The base currency is picked from the left column, while the quote currency is picked from the top row. For example, if you pick the US Dollar from the left column and move along the horizontal line to the Japanese Yen, the percentage change displayed in the box will represent USD (base)/JPY (quote).
Recommended Articles


