
Trump meme coin offers recovery signals as US delays tariff deadline
- The Official Trump meme coin defends support at $8.43, extending consolidation ahead of a potential bullish breakout.
- The US tariff deadline has been unofficially postponed to August 1 as President Donald Trump eyes trade deals.
- TRUMP futures contracts Open Interest steadies above $357 million.
Official Trump (TRUMP) meme coin is trading at around $8.62, slightly above the $8.43 support level. The token launched days before United States (US) President Donald Trump’s inauguration in January, shows signals of broad consolidation ahead of a potential technical breakout past resistance at $10.00.
US mulls extending tariffs grace period
President Trump’s administration is preparing to send letters to US trade partners with details of the new tariffs, which are likely to take effect on August 1. The President told reporters over the weekend that the US had reached trade agreements with certain countries. Trade partners without deals could receive the letters on July 9, notifying them of the higher tariffs.
With the 90-day tariff pause set to end on Wednesday, market sentiment remains broadly on edge despite Commerce Secretary Howard Lutnick saying that “tariffs go into effect August 1, but the president is setting the rates and the deals right now.”
The unofficial postponement to August 1 could extend the grace period by another three weeks, allowing countries to negotiate trade deals with the US. Regions such as the European Union (EU) are working on striking trade deals to avoid the impact likely to follow the implementation of higher tariffs.
“We’re fully geared up to get an agreement in principle by Wednesday, and we’re firing on all cylinders to that effect,” EU trade spokesperson Olof Gill said on Monday.
Sentiment in the broader cryptocurrency market remains lethargic despite Bitcoin (BTC) trading near all-time highs. Interest from the retail market remains subdued, as evidenced by the drop in the Trump meme coins’s futures Open Interest (OI).
CoinGlass data indicates that TRUMP futures Open Interest average above $357 million on Monday. The green line in the chart below indicates stable interest in the token, albeit at significantly lower levels compared to those observed in April and May, with peaks exceeding $800 million.
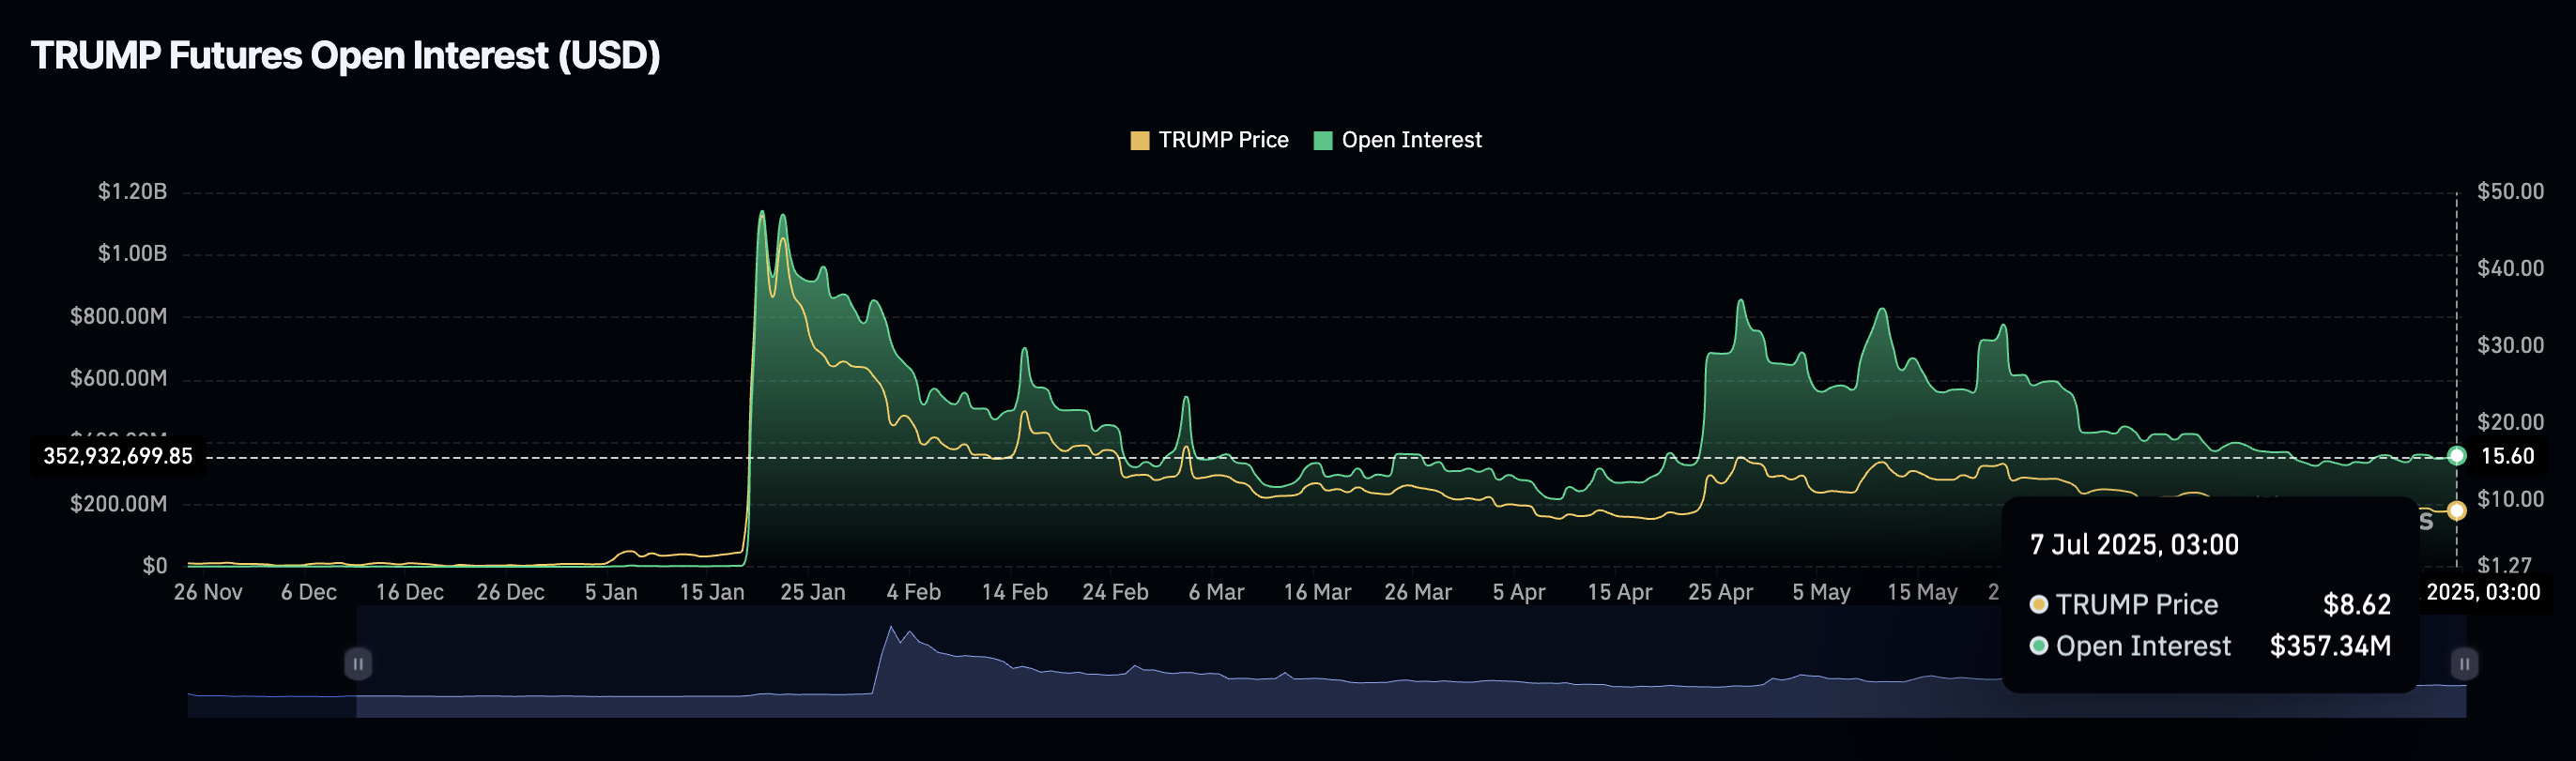
TRUMP futures contracts Open Interest | Source: CoinGlass
Technical outlook: TRUMP extends consolidation
The Trump meme coin holds above support at $8.43, reflecting the lull sentiment in the broader crypto market. Technical indicators, such as the Relative Strength Index (RSI), reinforce indecision among traders.
The RSI’s position below the midline and above the oversold region signals declining sell-side pressure, but the price movement lacks a catalyst to break above the $10.00 resistance, last tested as support in early June and late March.
Based on the Moving Average Convergence Divergence (MACD), TRUMP has a minor bullish bias. As observed on the daily chart below, the blue MACD line sits above the red signal line, which could uphold risk-on sentiment as traders seek exposure.
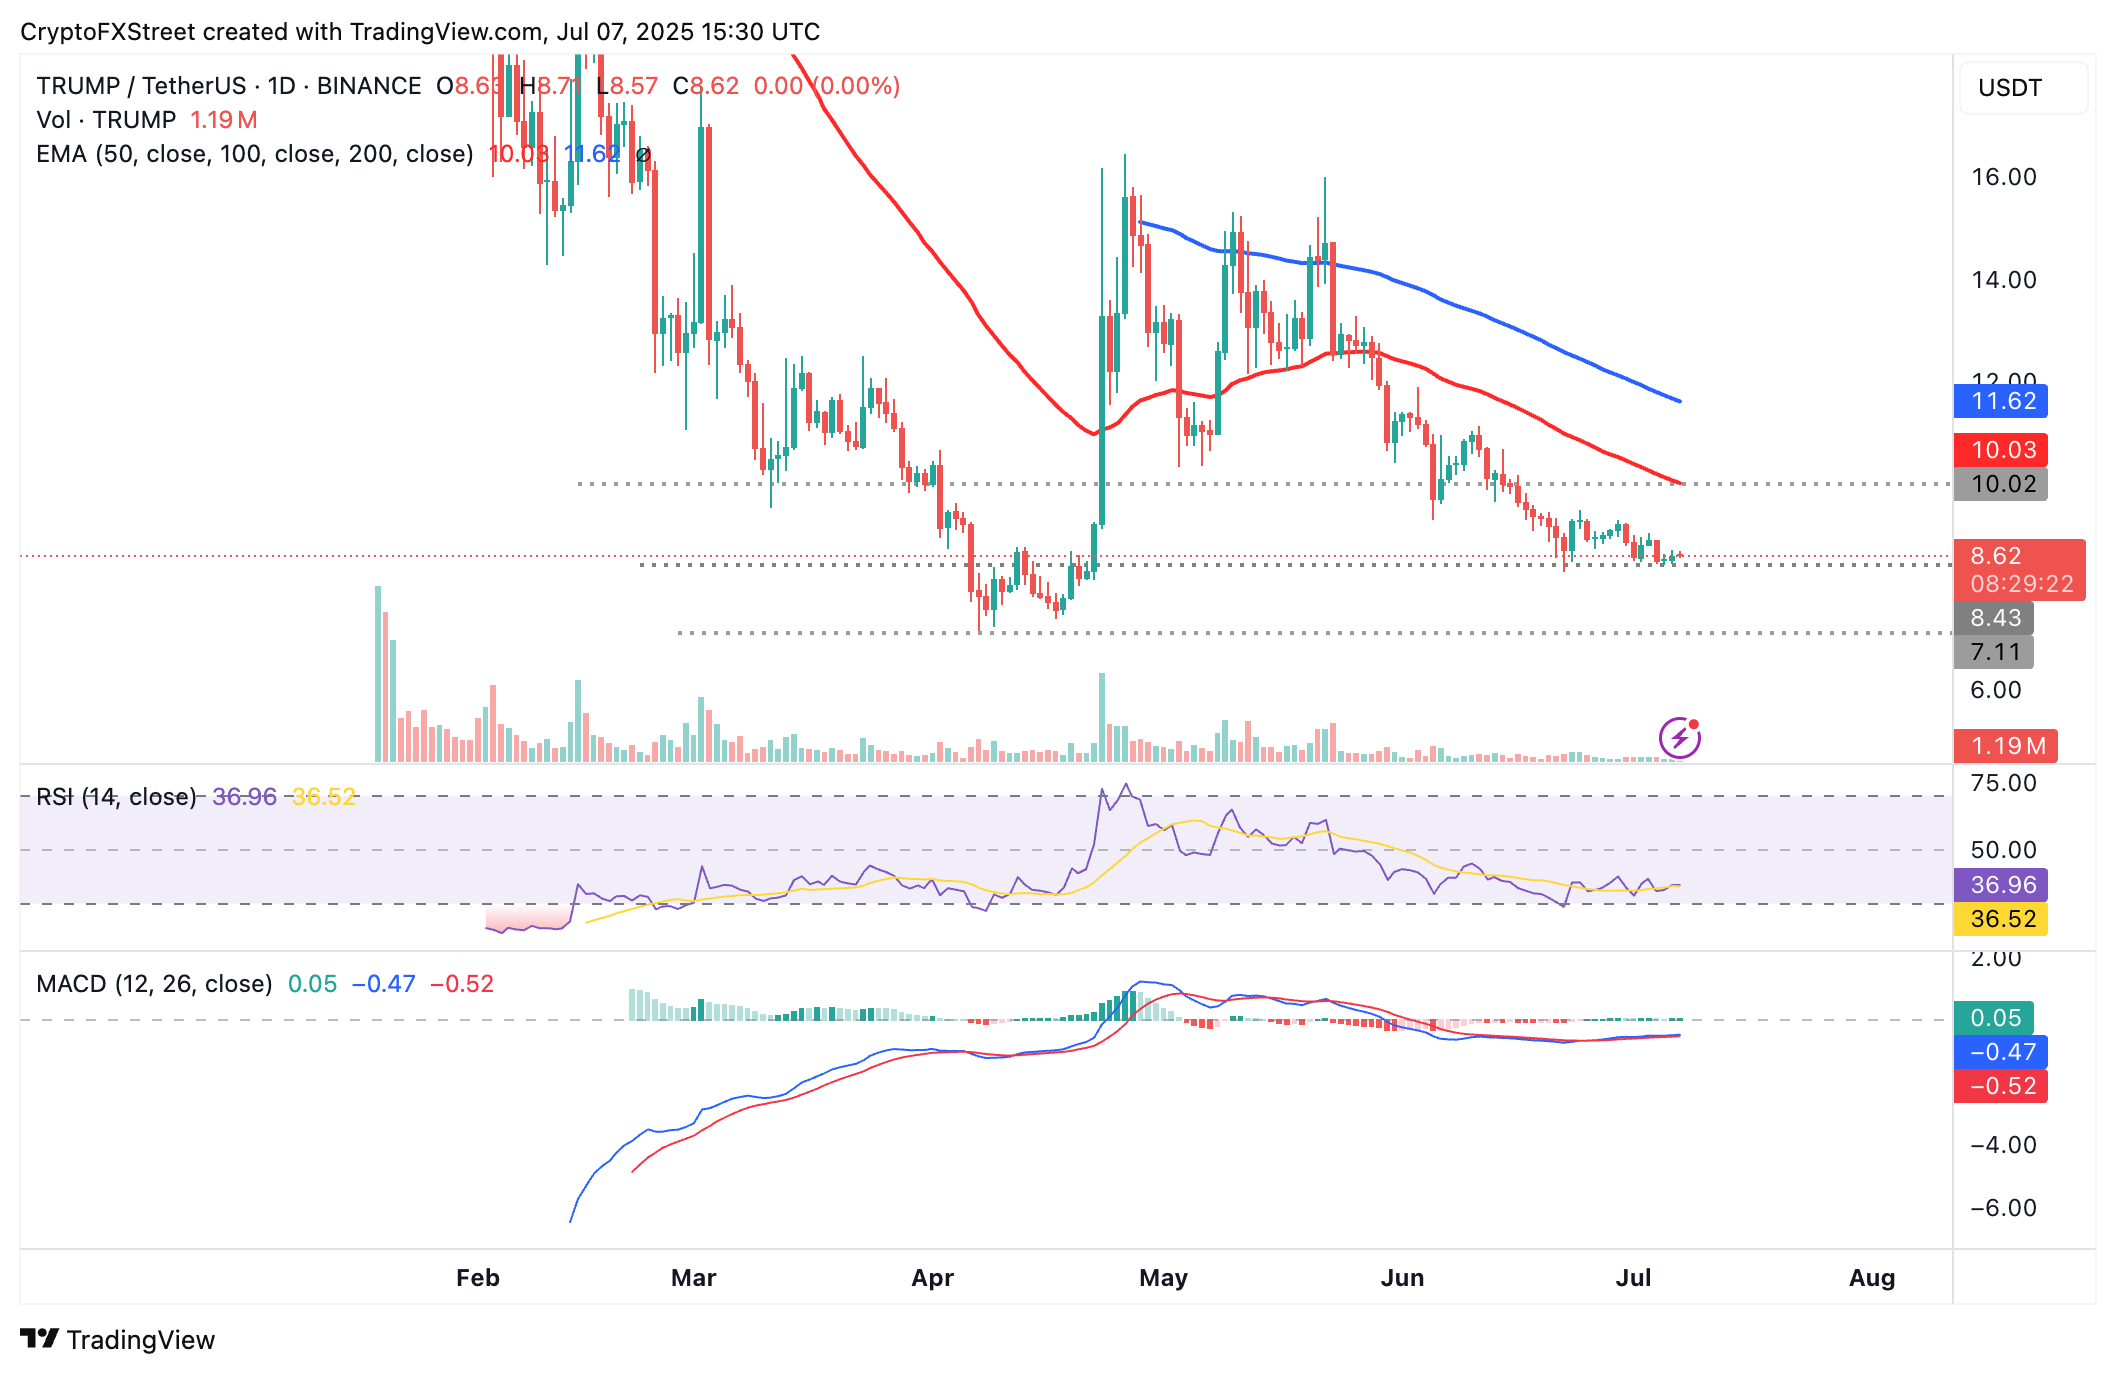
TRUMP/USDT daily chart
Still, TRUMP faces the risk of dropping to test support at $7.11, which was probed on April 7 following the announcement of tariffs in the US. The token holds below the downward-trending 50-day Moving Average (EMA) at $10.03 and the 100-day EMA at $11.62. These levels could dampen recovery momentum, marking potential pain points for the bulls.
Open Interest, funding rate FAQs
Higher Open Interest is associated with higher liquidity and new capital inflow to the market. This is considered the equivalent of increase in efficiency and the ongoing trend continues. When Open Interest decreases, it is considered a sign of liquidation in the market, investors are leaving and the overall demand for an asset is on a decline, fueling a bearish sentiment among investors.
Funding fees bridge the difference between spot prices and prices of futures contracts of an asset by increasing liquidation risks faced by traders. A consistently high and positive funding rate implies there is a bullish sentiment among market participants and there is an expectation of a price hike. A consistently negative funding rate for an asset implies a bearish sentiment, indicating that traders expect the cryptocurrency’s price to fall and a bearish trend reversal is likely to occur.
Recommended Articles


