
Stellar Price Forecast: XLM eyes triangle breakout rally amid PayPal’s stablecoin integration buzz

Stellar edges higher to extend the gains from Sunday, inching closer to the descending triangle pattern’s upper boundary.
The growing buzz surrounding the potential integration of PayPal’s PYUSD stablecoin on Stellar fuels the uptrend.
The XLM Open Interest jumps 10% amid a triangle breakout and PayPal’s PYUSD integration chances.
Stellar (XLM) ticks higher by nearly 1% at press time on Friday, adding minor gains to the 5% surge from Sunday. Stellar nears the resistance trendline of a descending triangle pattern after bouncing off its support floor on Wednesday, accounting for a near 12% surge.
The increasing social chatter around PayPal’s announcement of PayPal USD (PYUSD) coming to Stellar fuels the optimism, resulting in a 10% surge in XLM Open Interest. The technical outlook remains bullish, with positive catalysts accumulating.
PayPal plans to expand PYUSD to Stellar
On June 11, PayPal announced plans to make its stablecoin PYUSD available on the Stellar network. The integration of PYUSD on Stellar will join the current stablecoin leaders, Tether’s USD (USDT) and Circle’s USD (USDC), on the network.
PayPal aims to boost its cross-border remittance services and the PayPal Finance (PayFi) infrastructure. As the plans await approval from the New York State Department of Financial Services (NYDFS), social chatter surrounding potential integration increases.
Sunday’s recovery could be linked to the broader market recovery or the increasing chances of an approval this week. A recent tweet from StephisCrypto highlights the growing rumors that could extend XLM’s recovery.
Double-digit gains in XLM Open Interest signal increased optimism
CoinGlass’ data shows that the XLM Open Interest (OI) has surged by 10% in the last 24 hours, reaching $181.73 million. An OI spike is associated with increased buying activity, driving inflows in XLM derivatives, which indicates heightened confidence among traders.
Alongside increased OI, the volume jumps by 10% to $214.68 million, while the long/short ratio of 0.99 suggests a marginal bearish tilt in the number of active positions.
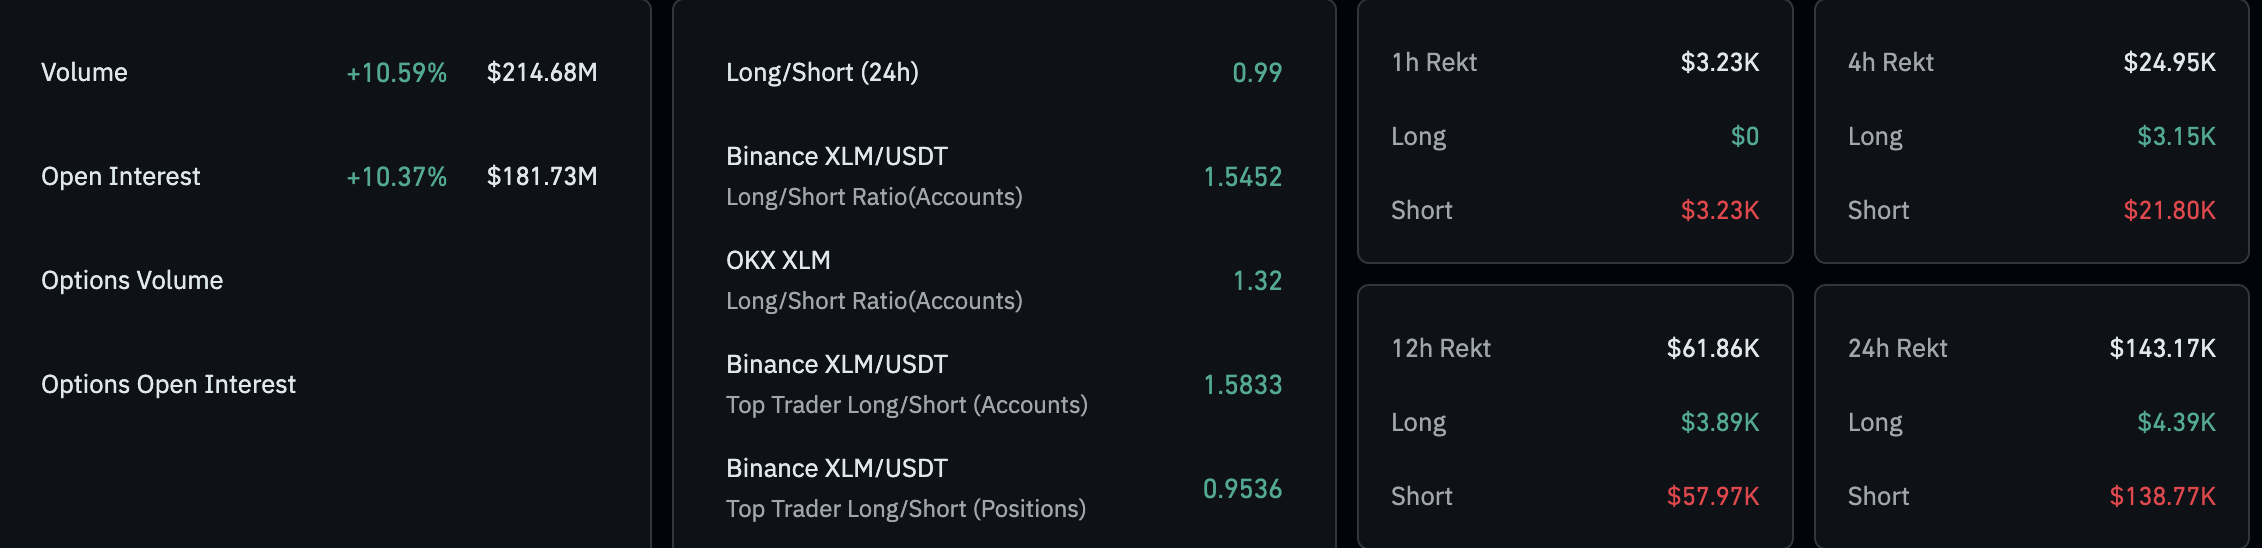
XLM derivatives. Source: Coinglass
XLM eyes a potential triangle breakout rally
XLM edges higher by nearly 1% at press time on Monday, extending the uptrend towards a critical resistance trendline formed by connecting the highs of December 3 and May 10. In combination with a $0.2190 support floor, marked by a green band on the chart shared below, XLM forms a descending triangle pattern.
A potential daily close above the trendline near $0.2600 round figure could prolong the breakout rally towards the June high of $0.2851.
The Moving Average Convergence/Divergence (MACD) indicator displays successively increasing green histogram bars above the zero line, aligning with the bullish recovery. However, sidelined investors could await the MACD and signal lines crossing above the zero line, signaling a trend reversal.
Meanwhile, the Relative Strength Index (RSI) at 52 crosses above the halfway line, an early sign of a shift in trend momentum.
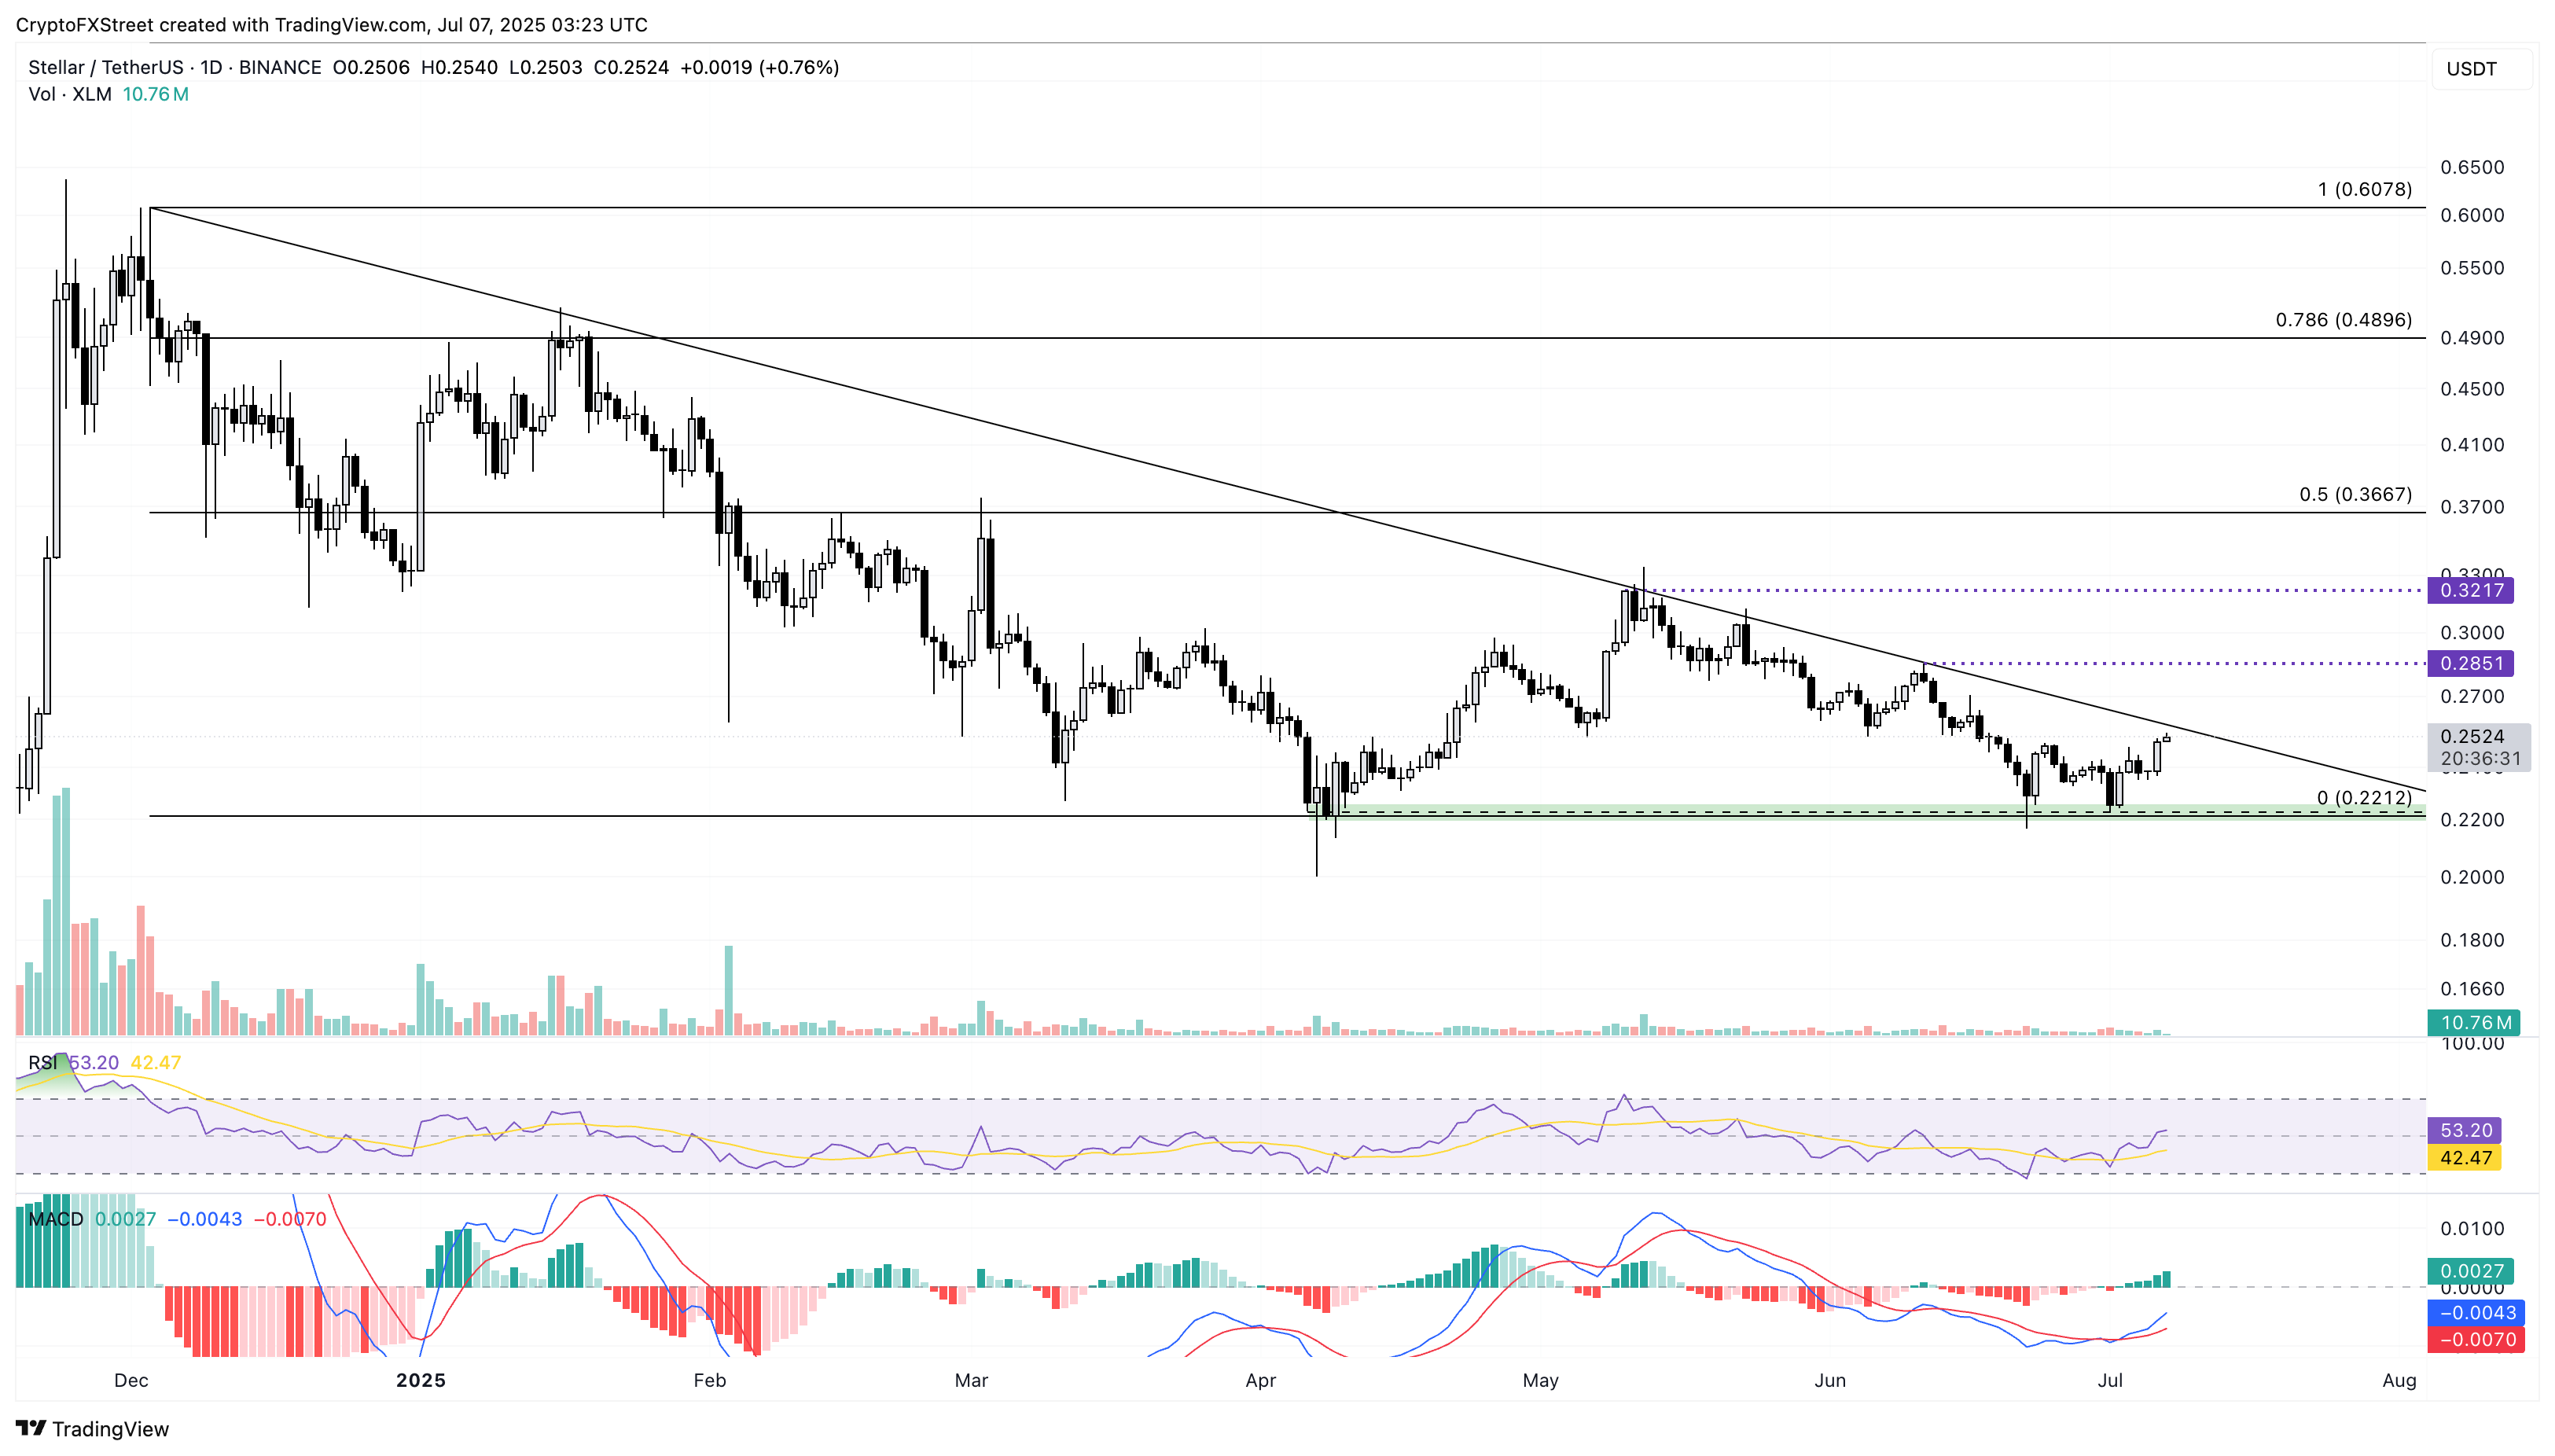
XLM/USDT daily price chart.
However, a reversal from the resistance trendline could cause XLM to decline toward the $0.2190 support floor, prolonging the oscillation within the triangle pattern.
* The content presented above, whether from a third party or not, is considered as general advice only. This article should not be construed as containing investment advice, investment recommendations, an offer of or solicitation for any transactions in financial instruments.


