
Ripple Price Forecast: XRP eyes 14% pennant pattern breakout after historic $37 million outflow
- XRP trades broadly sideways as sentiment remains elevated in the crypto market ahead of a potential pennant pattern breakout.
- XRP records the largest weekly outflow of $37.2 million in history, ending a remarkable 80-week inflow streak.
- XRP struggles to sustain the uptrend, eyeing a potential return above $3.00 amid confluence resistance at $2.25.
Ripple's (XRP) price moves broadly sideways at around $2.32 at the time of writing on Monday, as cryptocurrency prices consolidate following a brief sell-off over the weekend. A slight increase in the derivatives market's Open Interest (OI) suggests that interest is growing among traders despite outflows into XRP-related products surging to $37.2 million.
Exploring the $37.2 million outflow as XRP consolidates
Inflows into digital assets generally increased last week, reaching $3.3 billion, as reported by CoinShares. This surge propelled the year-to-date (YTD) inflow to a record $10.8 billion, led by $2.9 billion into Bitcoin products and $326.2 million in Ethereum-related products.
Intriguingly, XRP posted the largest weekly outflow of $37.2 million, breaking an impressive 80-week inflow streak.
CoinShares did not highlight any reasons why XRP-related products experienced the largest outflows, while most other digital assets, including Solana (SOL), Sui (SUI), Cardano (ADA) and Chainlink (LINK), recorded inflows, as shown in the chart.
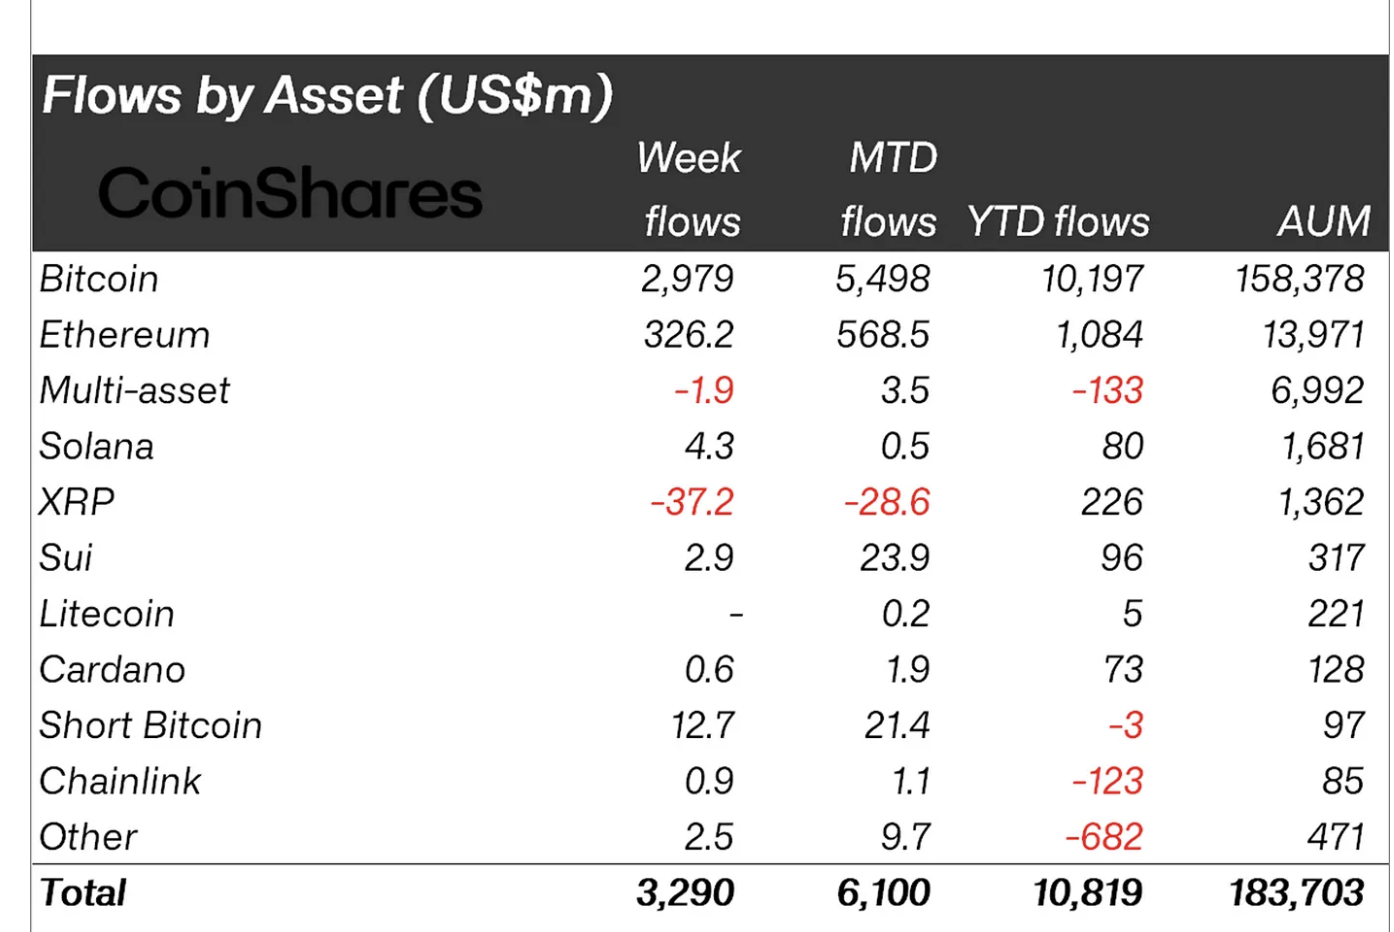
Digital asset inflow data | Source: CoinShares
The derivatives market OI's 2% increase over the past 24 hours to $4.74 billion, coupled with an approximately 10% rise in trading volume to $2.97 billion, suggests that trader interest and market participation are up-trending.
The long-to-short ratio of 3.0371 on Binance's XRP/USDT pair leans bullishly, suggesting that traders are betting more on the price increasing than sliding.
However, higher long positions liquidations amounted to $2.6 million compared to $1.43 million over the past 24 hours, cautioning traders to temper their expectations this week.
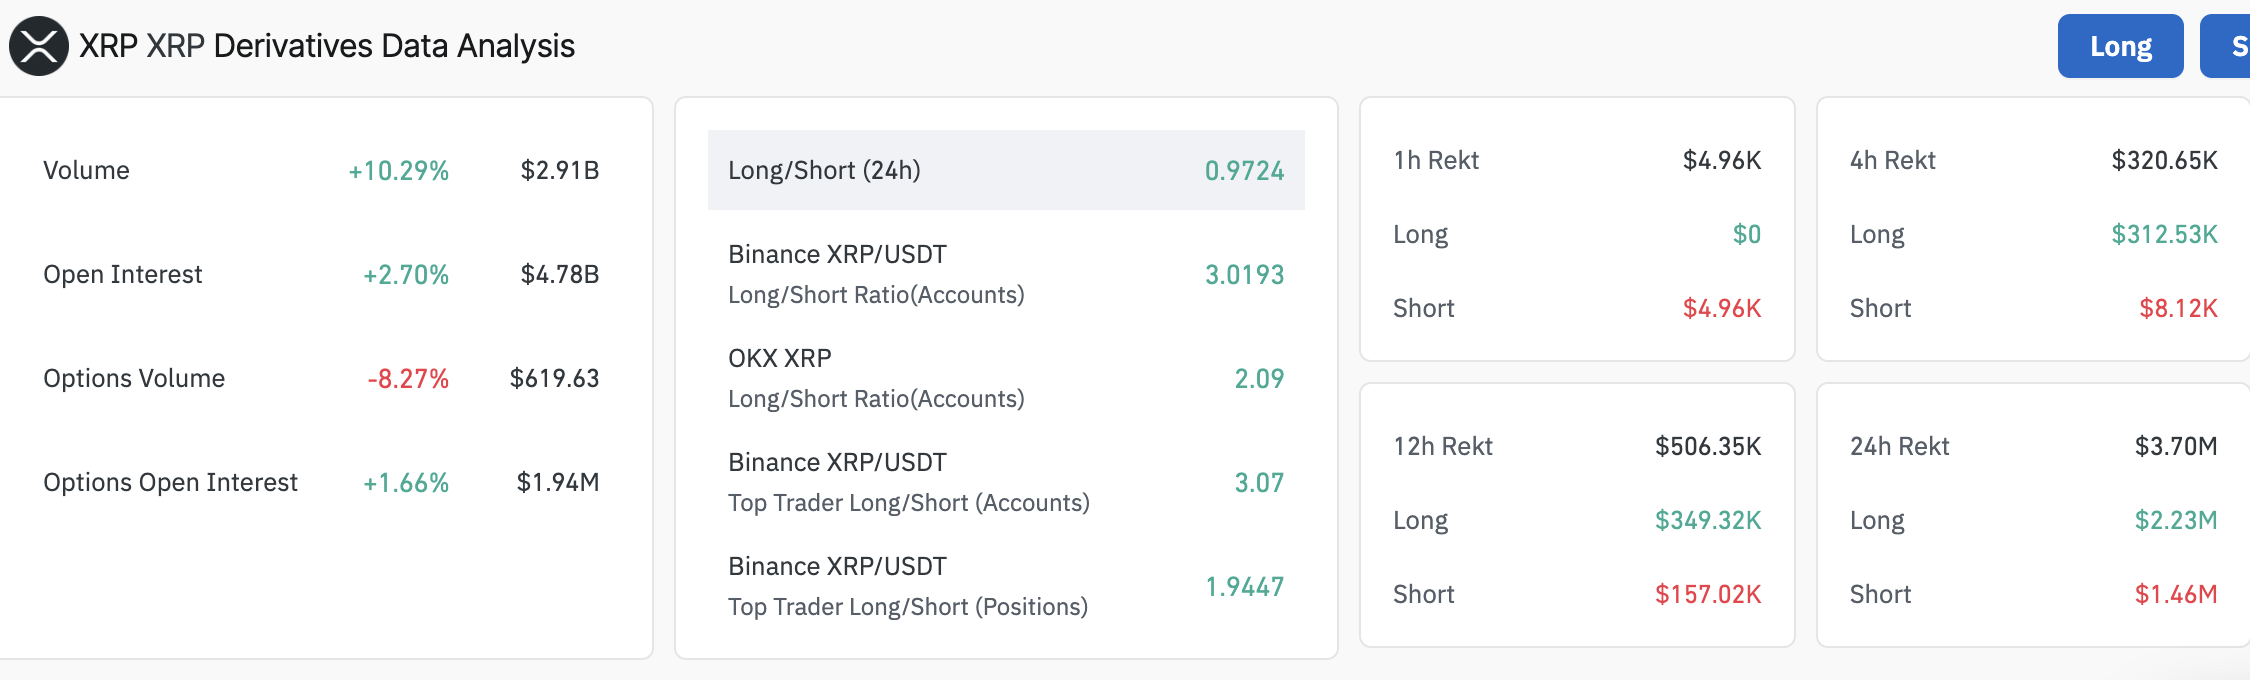
XRP's derivatives market data | Source: CoinGlass
Can XRP steady uptrend ahead of a potential pennant breakout?
XRP's price faces increasing overhead pressure reflecting changing sentiment in the broader market, as traders adjust positions following a bullish last week and a weekend that leaned slightly bearish.
The international money remittance token declined over 1% on the day after rejection from $2.35, a confluence resistance established by the 4-hour, 50-period Exponential Moving Average (EMA) and the 100-day EMA.
Beyond the 200 EMA at $2.31, the next area of interest for long traders would be around $2.26, which was tested as resistance in late April.
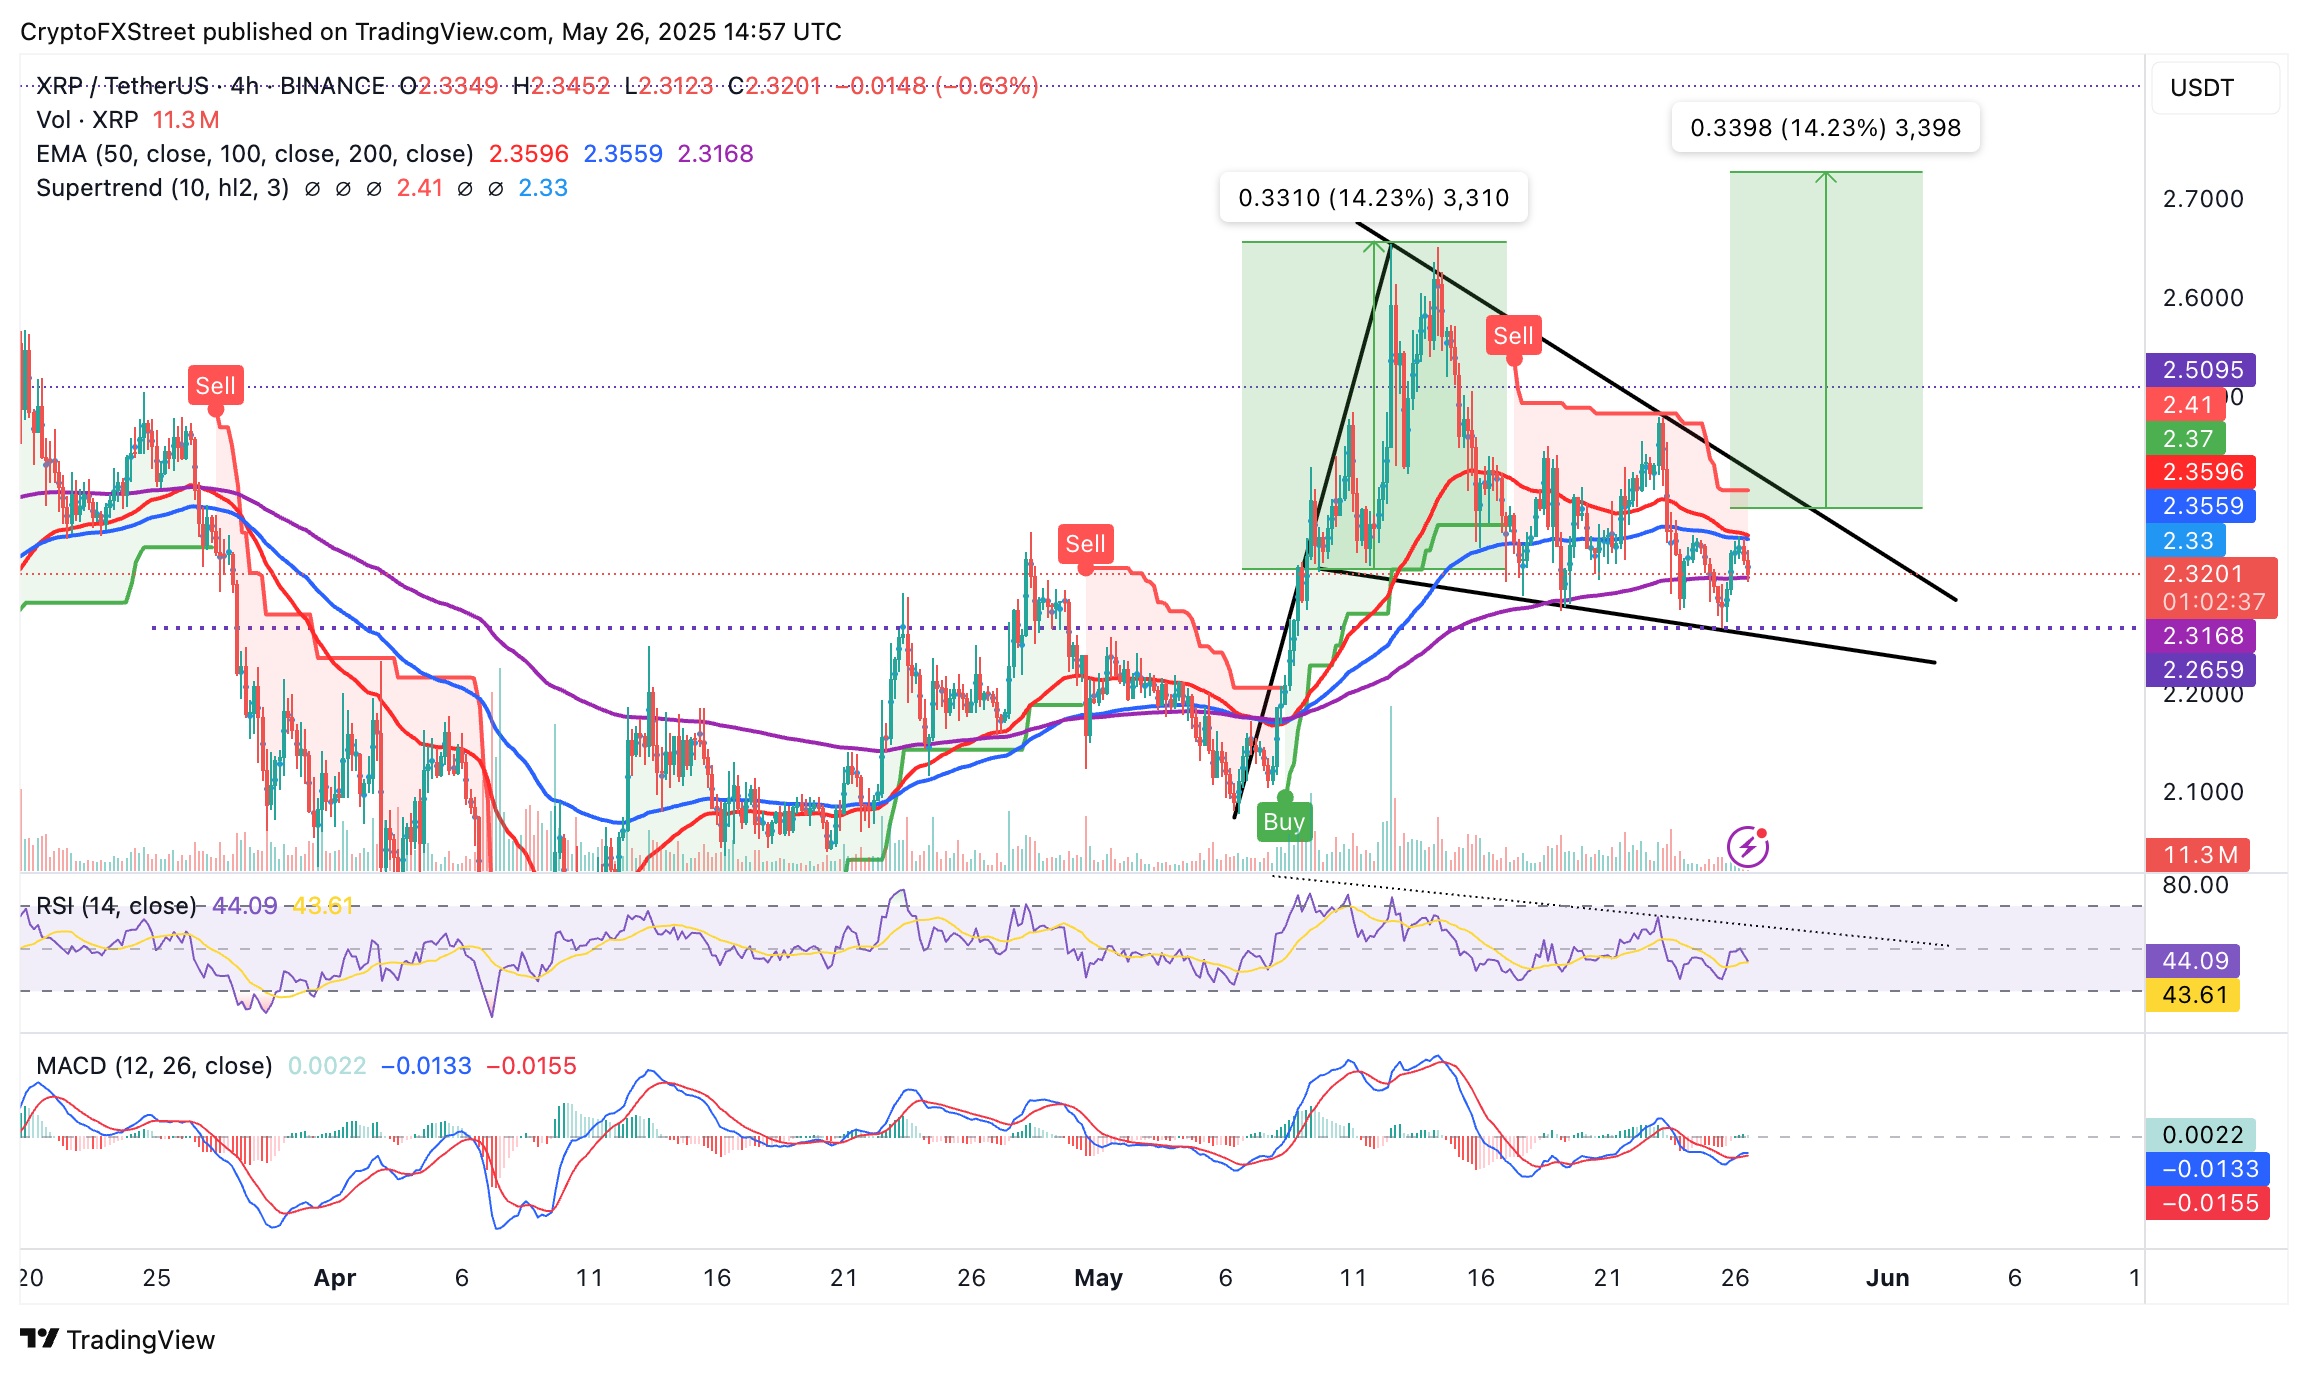
XRP/USD 4-hour chart
On the flip side, traders could look for a break above the confluence resistance at $2.26, which will likely pave the way for confirming the bullish pennant pattern illustrated on the chart.
A break above the pattern's upper trendline would validate the previous uptrend's continuation, potentially setting XRP on a 14.2% projected path to $2.72. This target is determined by measuring the distance between the pennant's widest points and extrapolating above the breakout point. A significant increase in trading volume would accompany such a breakout.
The Moving Average Convergence Divergence (MACD) indicator highlights a buy signal when the blue MACD line crosses above the red signal line. The likely rebound toward and above the mean line could encourage traders to buy XRP, thus increasing the demand for the token and the probability of retesting resistance at $3.00.
Cryptocurrency metrics FAQs
The developer or creator of each cryptocurrency decides on the total number of tokens that can be minted or issued. Only a certain number of these assets can be minted by mining, staking or other mechanisms. This is defined by the algorithm of the underlying blockchain technology. On the other hand, circulating supply can also be decreased via actions such as burning tokens, or mistakenly sending assets to addresses of other incompatible blockchains.
Market capitalization is the result of multiplying the circulating supply of a certain asset by the asset’s current market value.
Trading volume refers to the total number of tokens for a specific asset that has been transacted or exchanged between buyers and sellers within set trading hours, for example, 24 hours. It is used to gauge market sentiment, this metric combines all volumes on centralized exchanges and decentralized exchanges. Increasing trading volume often denotes the demand for a certain asset as more people are buying and selling the cryptocurrency.
Funding rates are a concept designed to encourage traders to take positions and ensure perpetual contract prices match spot markets. It defines a mechanism by exchanges to ensure that future prices and index prices periodic payments regularly converge. When the funding rate is positive, the price of the perpetual contract is higher than the mark price. This means traders who are bullish and have opened long positions pay traders who are in short positions. On the other hand, a negative funding rate means perpetual prices are below the mark price, and hence traders with short positions pay traders who have opened long positions.
Recommended Articles


