Bitcoin Up $18,000, But HODLer Profits Same As On April 1—Here’s Why

Source Newsbtc

On-chain data shows the profit margin of the Bitcoin long-term holders is currently the same as when BTC was still $85,000. Here’s what’s behind this.

Bitcoin Long-Term Holder NUPL Has Returned To 0.69

In a new post on X, the on-chain analytics firm Glassnode has talked about the trend in the Net Unrealized Profit/Loss (NUPL) for the Bitcoin long-term holders. The NUPL is an indicator that keeps track of the difference between the unrealized profit and unrealized loss held by the BTC investors as a whole.

When the value of this metric is positive, it means the holders are carrying more profit than loss. On the other hand, it being under zero suggests the average address is underwater.

In the context of the current topic, the NUPL of the entire network isn’t of relevance, but rather that of just one segment of it: the long-term holders (LTHs). The LTHs refer to the BTC investors who have been holding onto their coins since more than 155 days ago.

Now, here is the chart shared by the analytics firm that shows the trend in the Bitcoin NUPL for the LTHs over the past year:

Bitcoin LTH NUPL

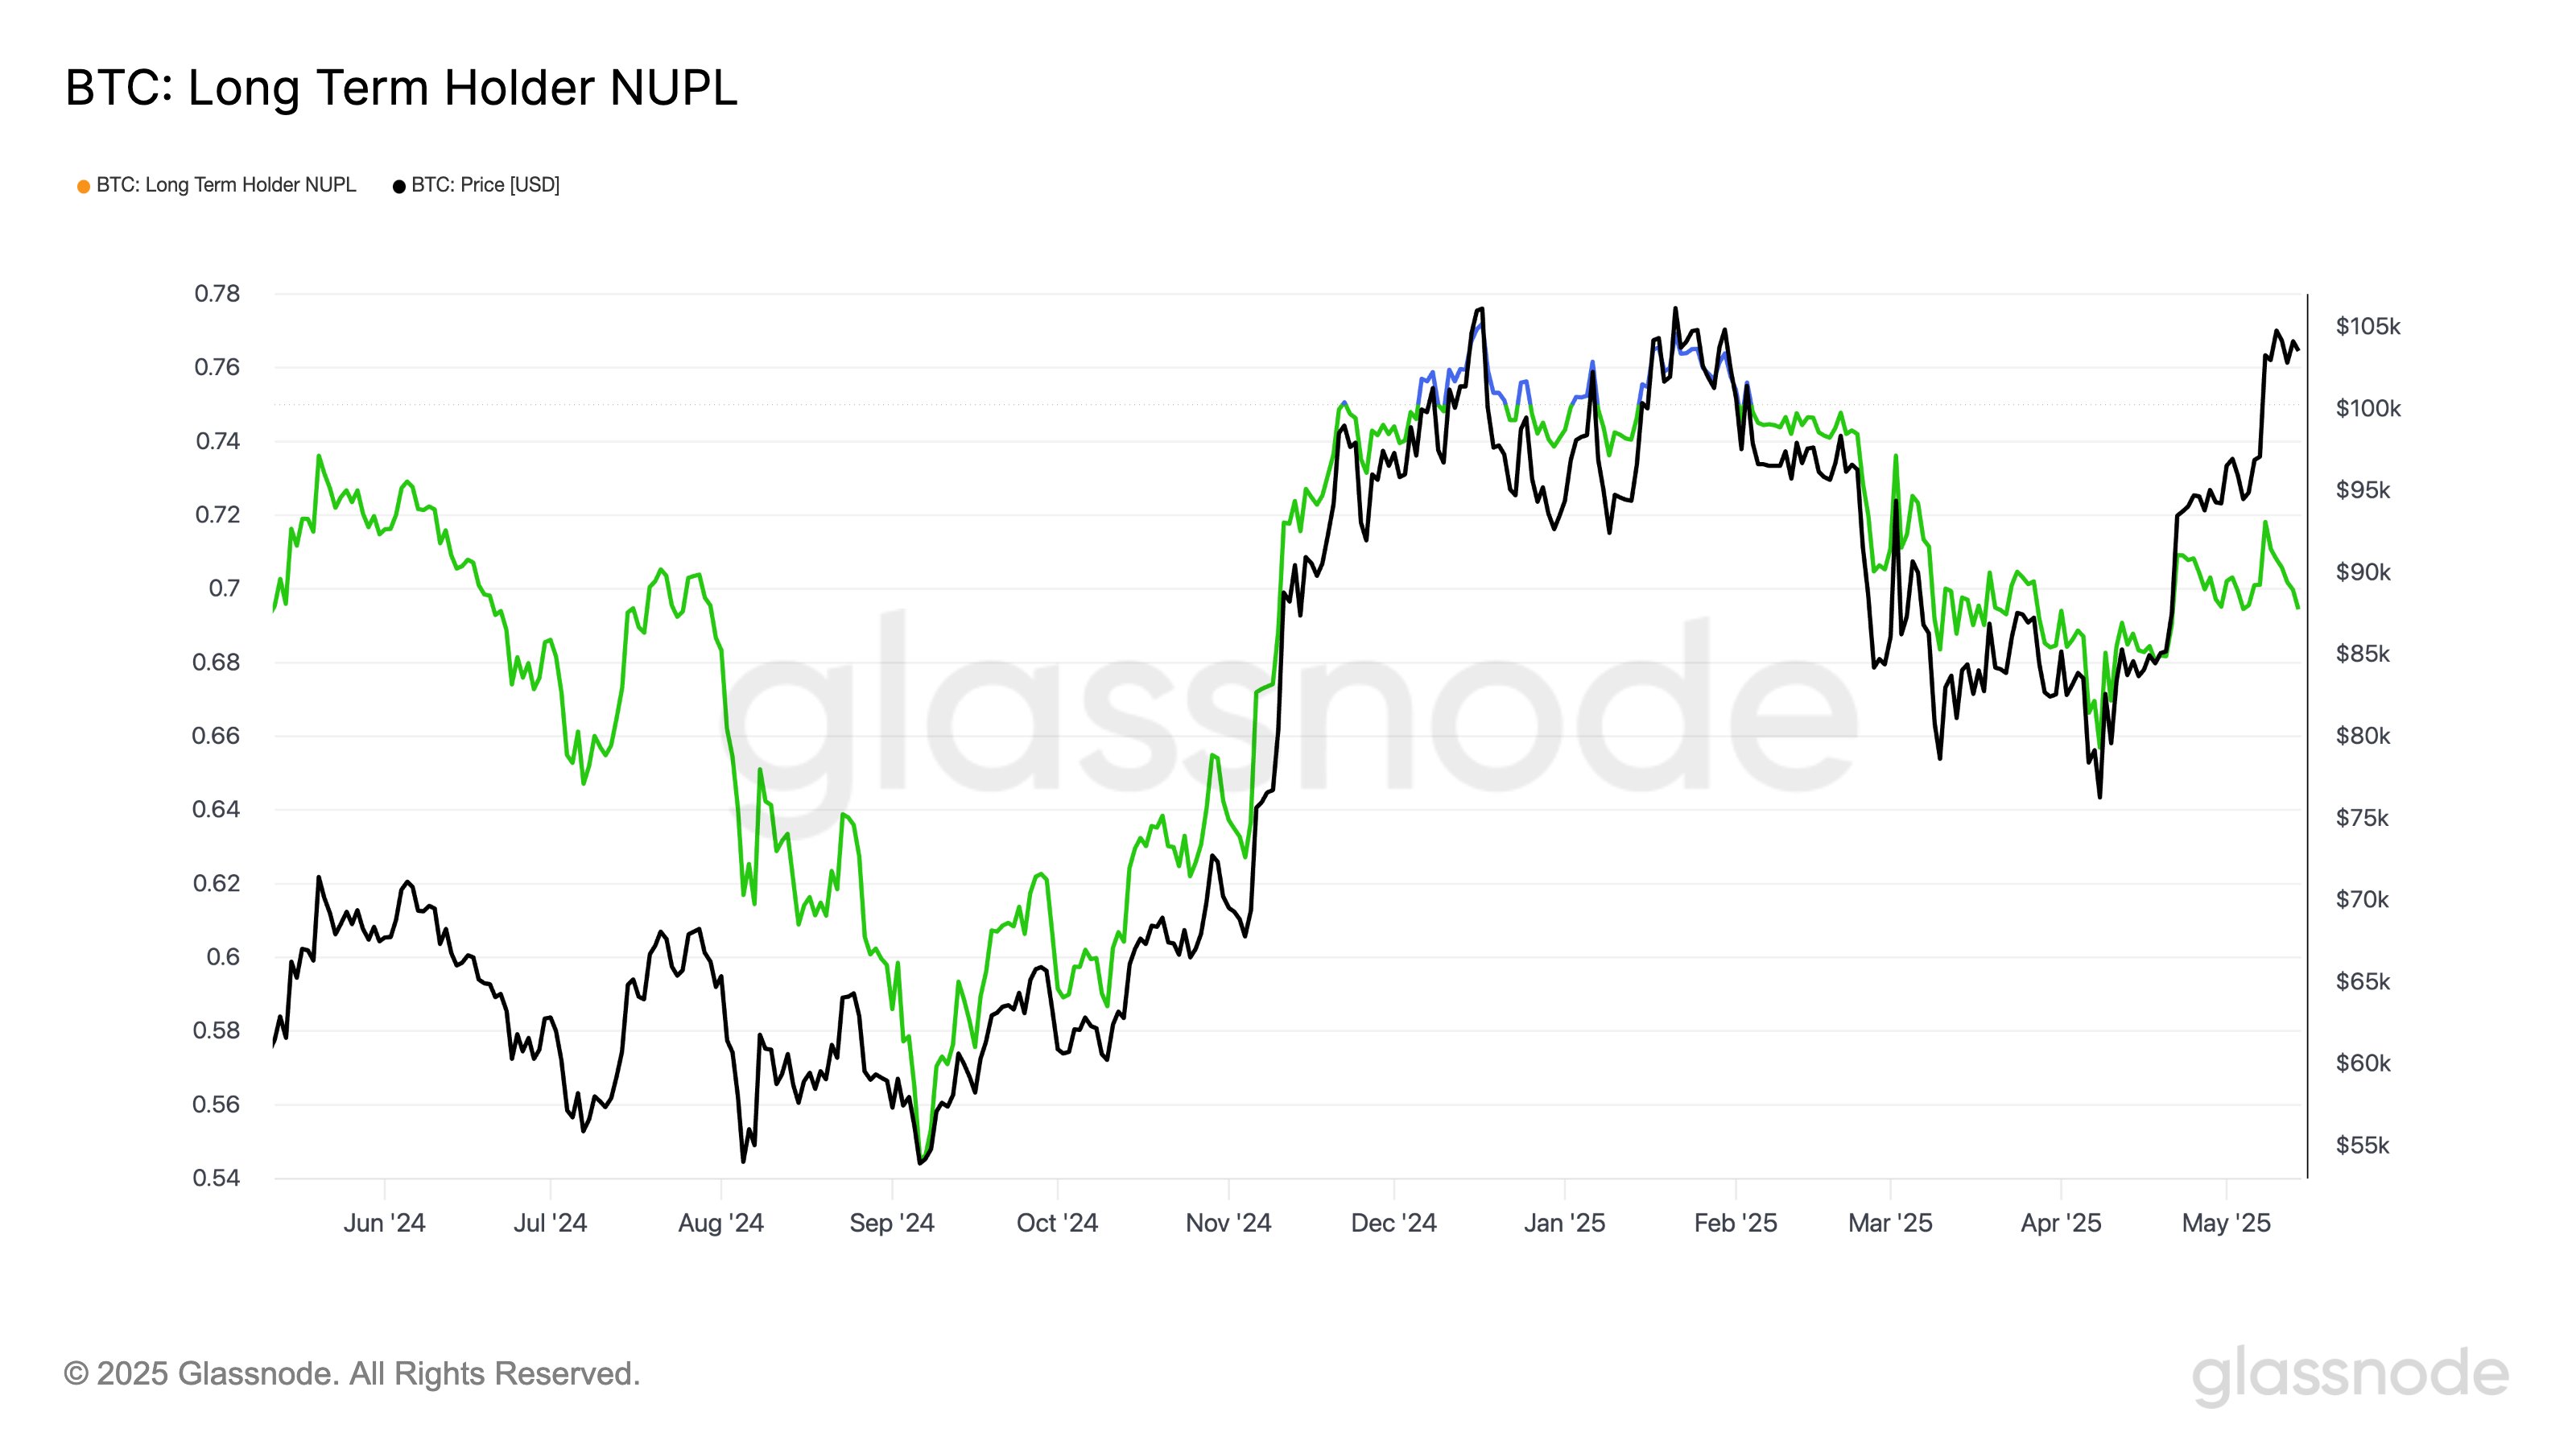
As is visible in the above graph, the Bitcoin LTH NUPL has remained above the zero level for the past year, implying that the HODLers of the market have stayed in the green.

But naturally, as the BTC price has shown some volatile moves in this period, the indicator’s value has also witnessed some fluctuations. From the chart, it’s apparent that the bull run at the end of 2024 took the indicator into an extreme territory, but the market downturn this year resulted in a cooldown for it.

With the recent price recovery run, the metric again noted a reversal, but even at its peak, it still couldn’t come close to touching the high from the earlier bull run.

An interesting trend has followed since this latest peak in the Bitcoin LTH NUPL; the indicator has observed a sharp retrace, despite the fact that the coin’s value has only been moving flat in this window.

The metric is now sitting at 0.69, which is the same level as back at the start of April, when the cryptocurrency was still just trading around $85,000. What’s making it so that HODLer profitability is the same today despite the price being notably higher? And what’s the reason for the latest decline in the metric even though the price has been going sideways?

The answer to these questions lies in what the LTH group represents. As mentioned earlier, this cohort includes investors who purchased their Bitcoin within the past 155 days. This five-month cutoff now includes the buyers from December 2024.

In other words, the promotion of these top buyers into the group has diluted the unrealized gain among its members.

BTC Price

At the time of writing, Bitcoin is floating around $103,500, up over 1% in the last 24 hours.

Bitcoin Price Chart
Disclaimer: For information purposes only. Past performance is not indicative of future results.
placeholder
Bitcoin Must Clear This Critical Cost Basis Level For Continued Upside, Analyst SaysIn a recent CryptoQuant Quicktake post, contributor Crazzyblockk highlighted key Bitcoin (BTC) cost basis zones that the leading cryptocurrency must clear – or avoid breaking below – to
Author  NewsBTC
4 Month 23 Day Wed
In a recent CryptoQuant Quicktake post, contributor Crazzyblockk highlighted key Bitcoin (BTC) cost basis zones that the leading cryptocurrency must clear – or avoid breaking below – to
placeholder
Ripple Price Forecast: XRP rally faces uncertainty after Court denies SEC-Ripple joint motionRipple (XRP) price trades broadly sideways at around $2.41 on Friday, rising slightly after a minor correction from this week’s peak of $2.65 to support $2.34.
Author  FXStreet
5 Month 16 Day Fri
Ripple (XRP) price trades broadly sideways at around $2.41 on Friday, rising slightly after a minor correction from this week’s peak of $2.65 to support $2.34.
placeholder
Solana Price Forecast: SOL flashes bearish signals, risks double-digit crashSolana (SOL) price shows early signs of a potential breakdown as it trades lower at $165.40 on Monday. SOL is approaching a key support level that could determine its next major move. Technical indicators flash red, and bearish sentiment intensifies, with short positions hitting a monthly high.
Author  FXStreet
5 Month 19 Day Mon
Solana (SOL) price shows early signs of a potential breakdown as it trades lower at $165.40 on Monday. SOL is approaching a key support level that could determine its next major move. Technical indicators flash red, and bearish sentiment intensifies, with short positions hitting a monthly high.
placeholder
Ethereum Price Tests Ascending Channel Resistance – Breakout Or Breakdown?Ethereum pushed above the $2,820 mark yesterday, strengthening the bullish case for a breakout after weeks of consolidation. The move has created renewed optimism among traders who expect ETH to
Author  NewsBTC
6 Month 12 Day Thu
Ethereum pushed above the $2,820 mark yesterday, strengthening the bullish case for a breakout after weeks of consolidation. The move has created renewed optimism among traders who expect ETH to
placeholder
Gold price sits near its highest level since April 22 amid fears of wider Middle East warGold price (XAU/USD) continues scaling higher for the third consecutive day on Friday, rising to the $3,444 area, or its highest level since April 22 during the Asian session amid the global flight to safety.
Author  FXStreet
Yesterday 06: 03
Gold price (XAU/USD) continues scaling higher for the third consecutive day on Friday, rising to the $3,444 area, or its highest level since April 22 during the Asian session amid the global flight to safety.
goTop
quote