
Bitcoin Price Prediction: What To Expect From BTC In 2026
Bitcoin price enters 2026 with split expectations. Some call for a rally toward $200,000, like Tom Lee. Others, including veteran trader Peter Brandt, warn about retests before deeper weakness.
Still, voices like YoungHoon Kim argue recent dips look like temporary manipulation before strength returns. With predictions in conflict, the truth sits somewhere between fear and euphoria. We dive deeper to see which signs on the chart and on-chain matter most as the new year begins.
December Patterns And a Bottom Signal That Hasn’t Triggered Yet
Bitcoin is ending December in the red zone again (almost there). That has mattered before. Since 2022, every time Bitcoin closed December in red, January flipped green. That pattern helped set the foundation for each move higher in 2025— including the April 2025 rally that eventually pushed the BTC price toward the $126,000 peak in October.
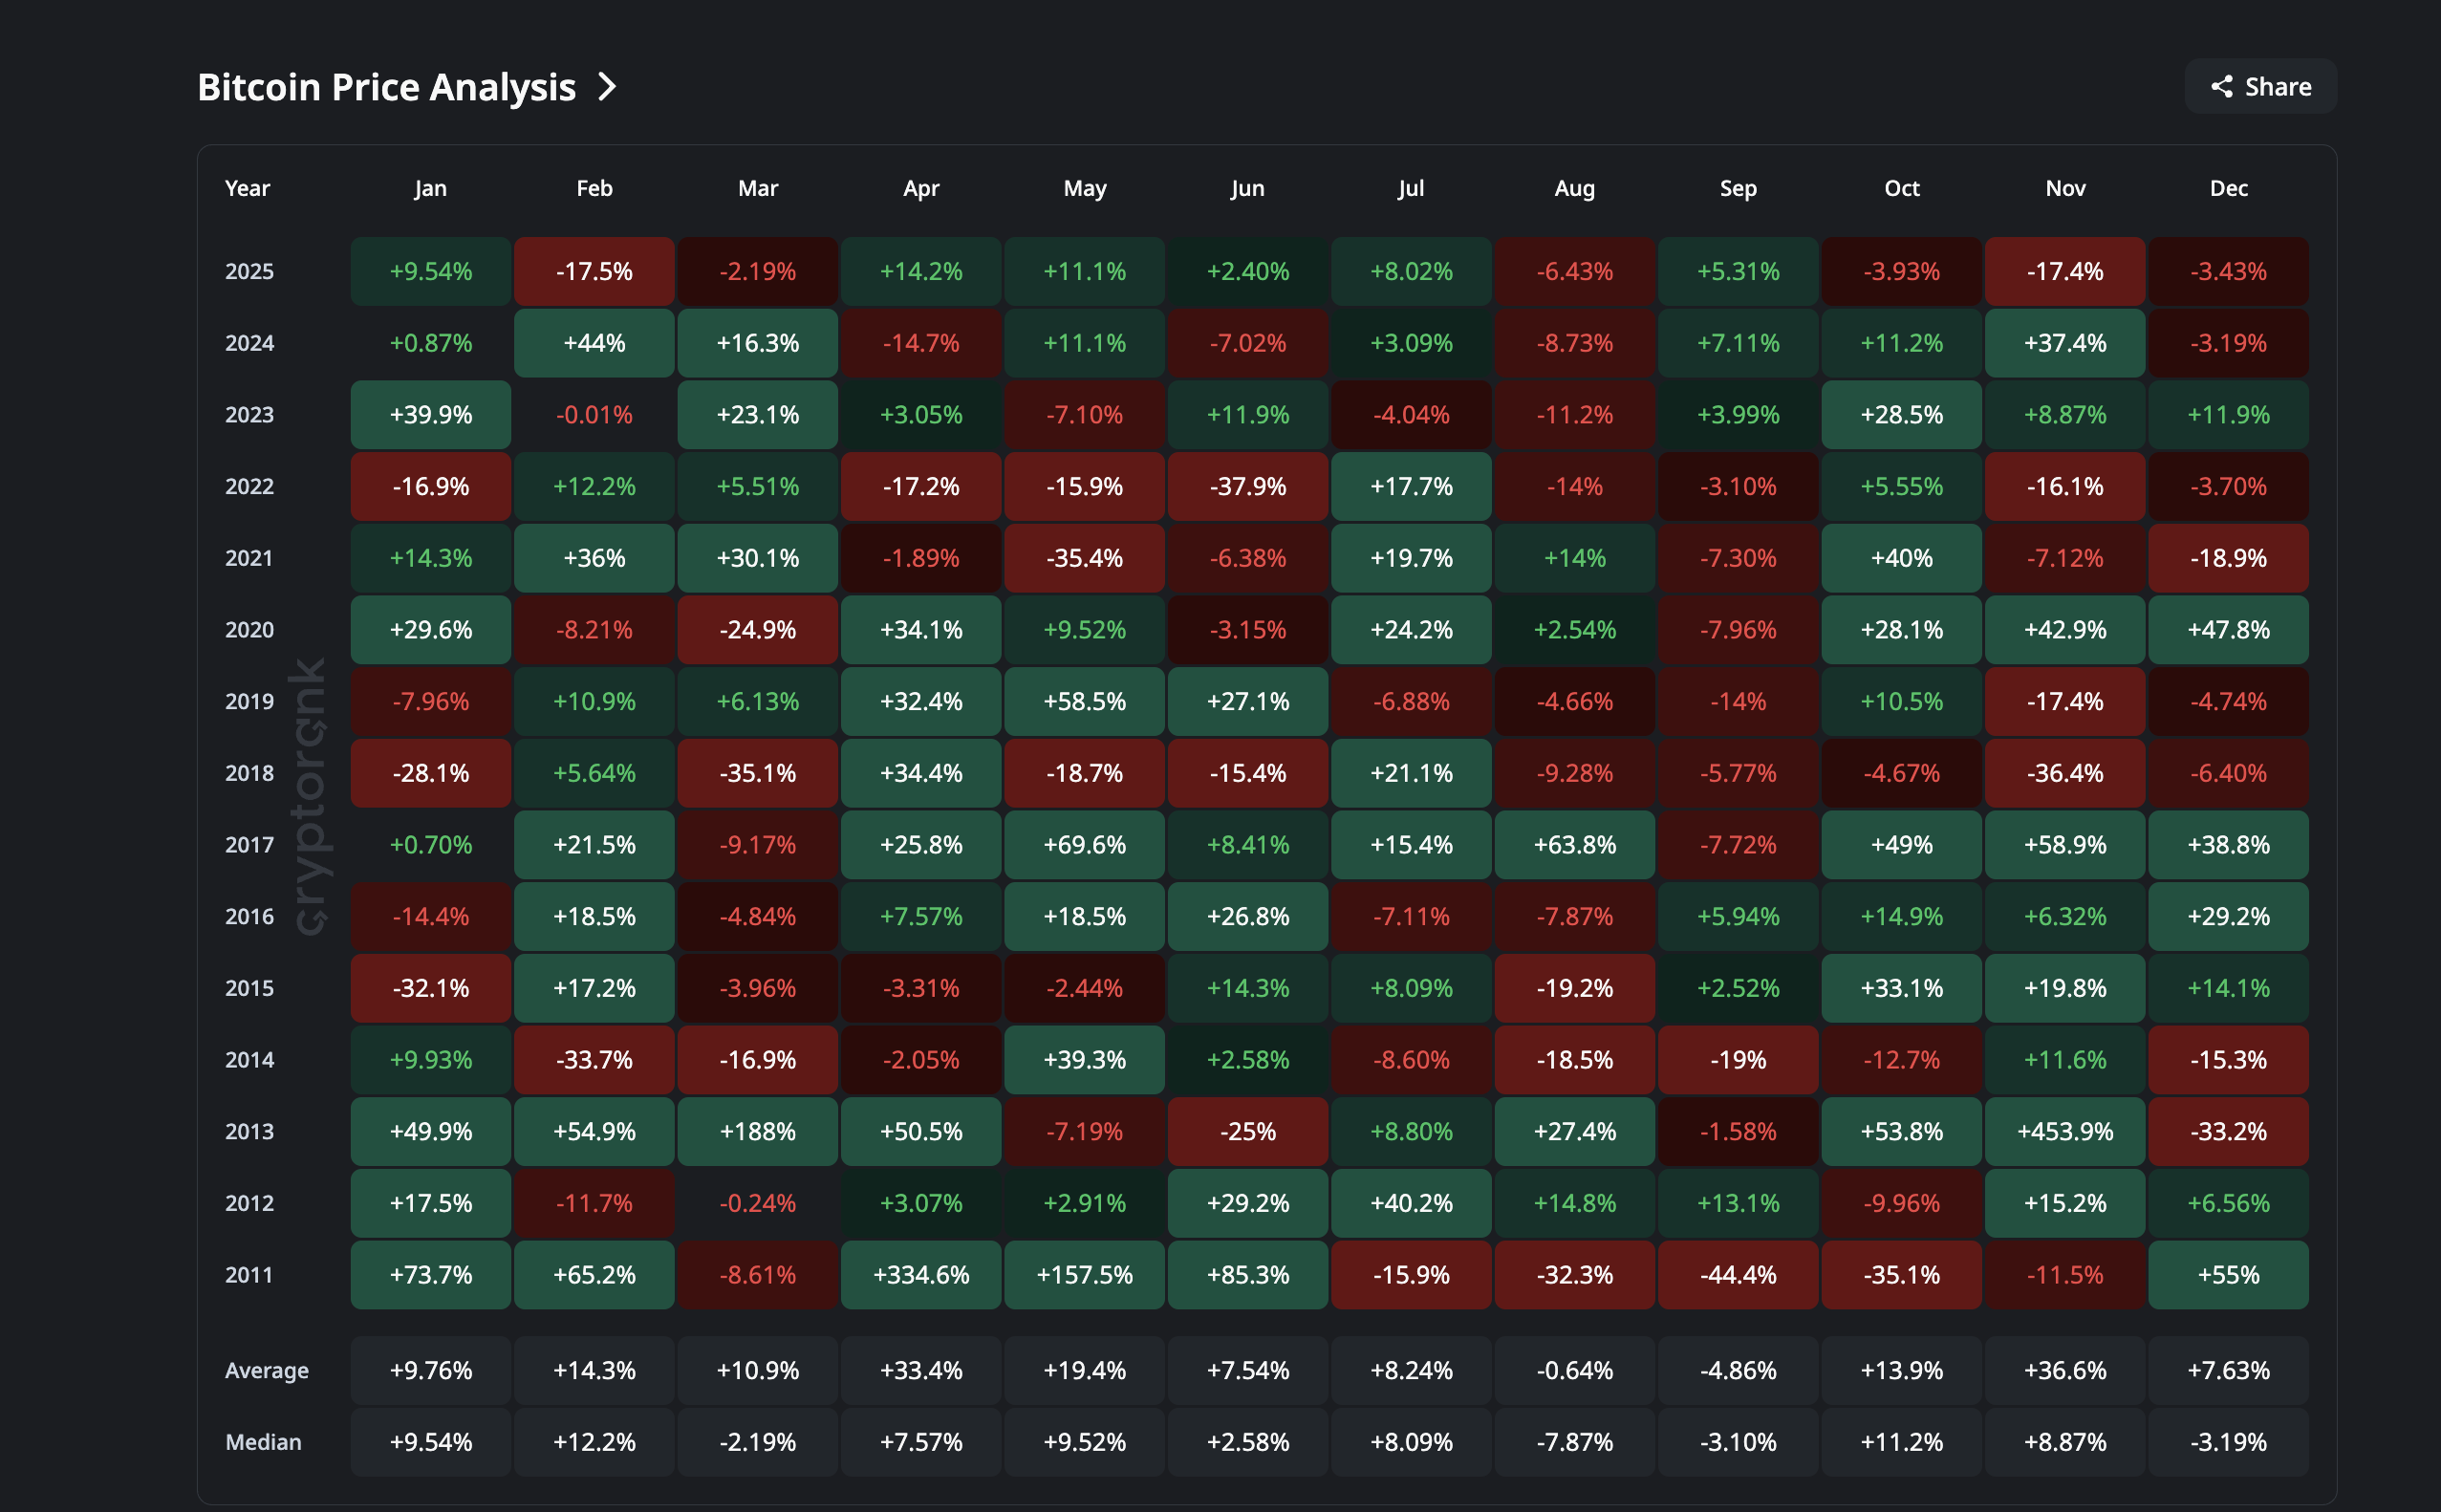 Bitcoin Price History: CryptoRank
Want more token insights like this? Sign up for Editor Harsh Notariya’s Daily Crypto Newsletter here.
Right now, a similar setup is appearing. And the reason for the reddish December lies with the short-term BTC holders.
Short-term holder NUPL (Net Unrealized Profit/Loss), which tracks profit and loss sentiment for recent buyers, remains in the capitulation zone. The last time this happened was in April 2025, which marked a bottom and helped start the run toward that $126,000 high in October 2025.
This time, the same capitulation signal has appeared. On November 21, short-term holder NUPL hit −0.27, even bettering the April bottom sign. Today, it sits around −0.14, still inside capitulation territory. The bottom signal is technically present. The reaction is not.
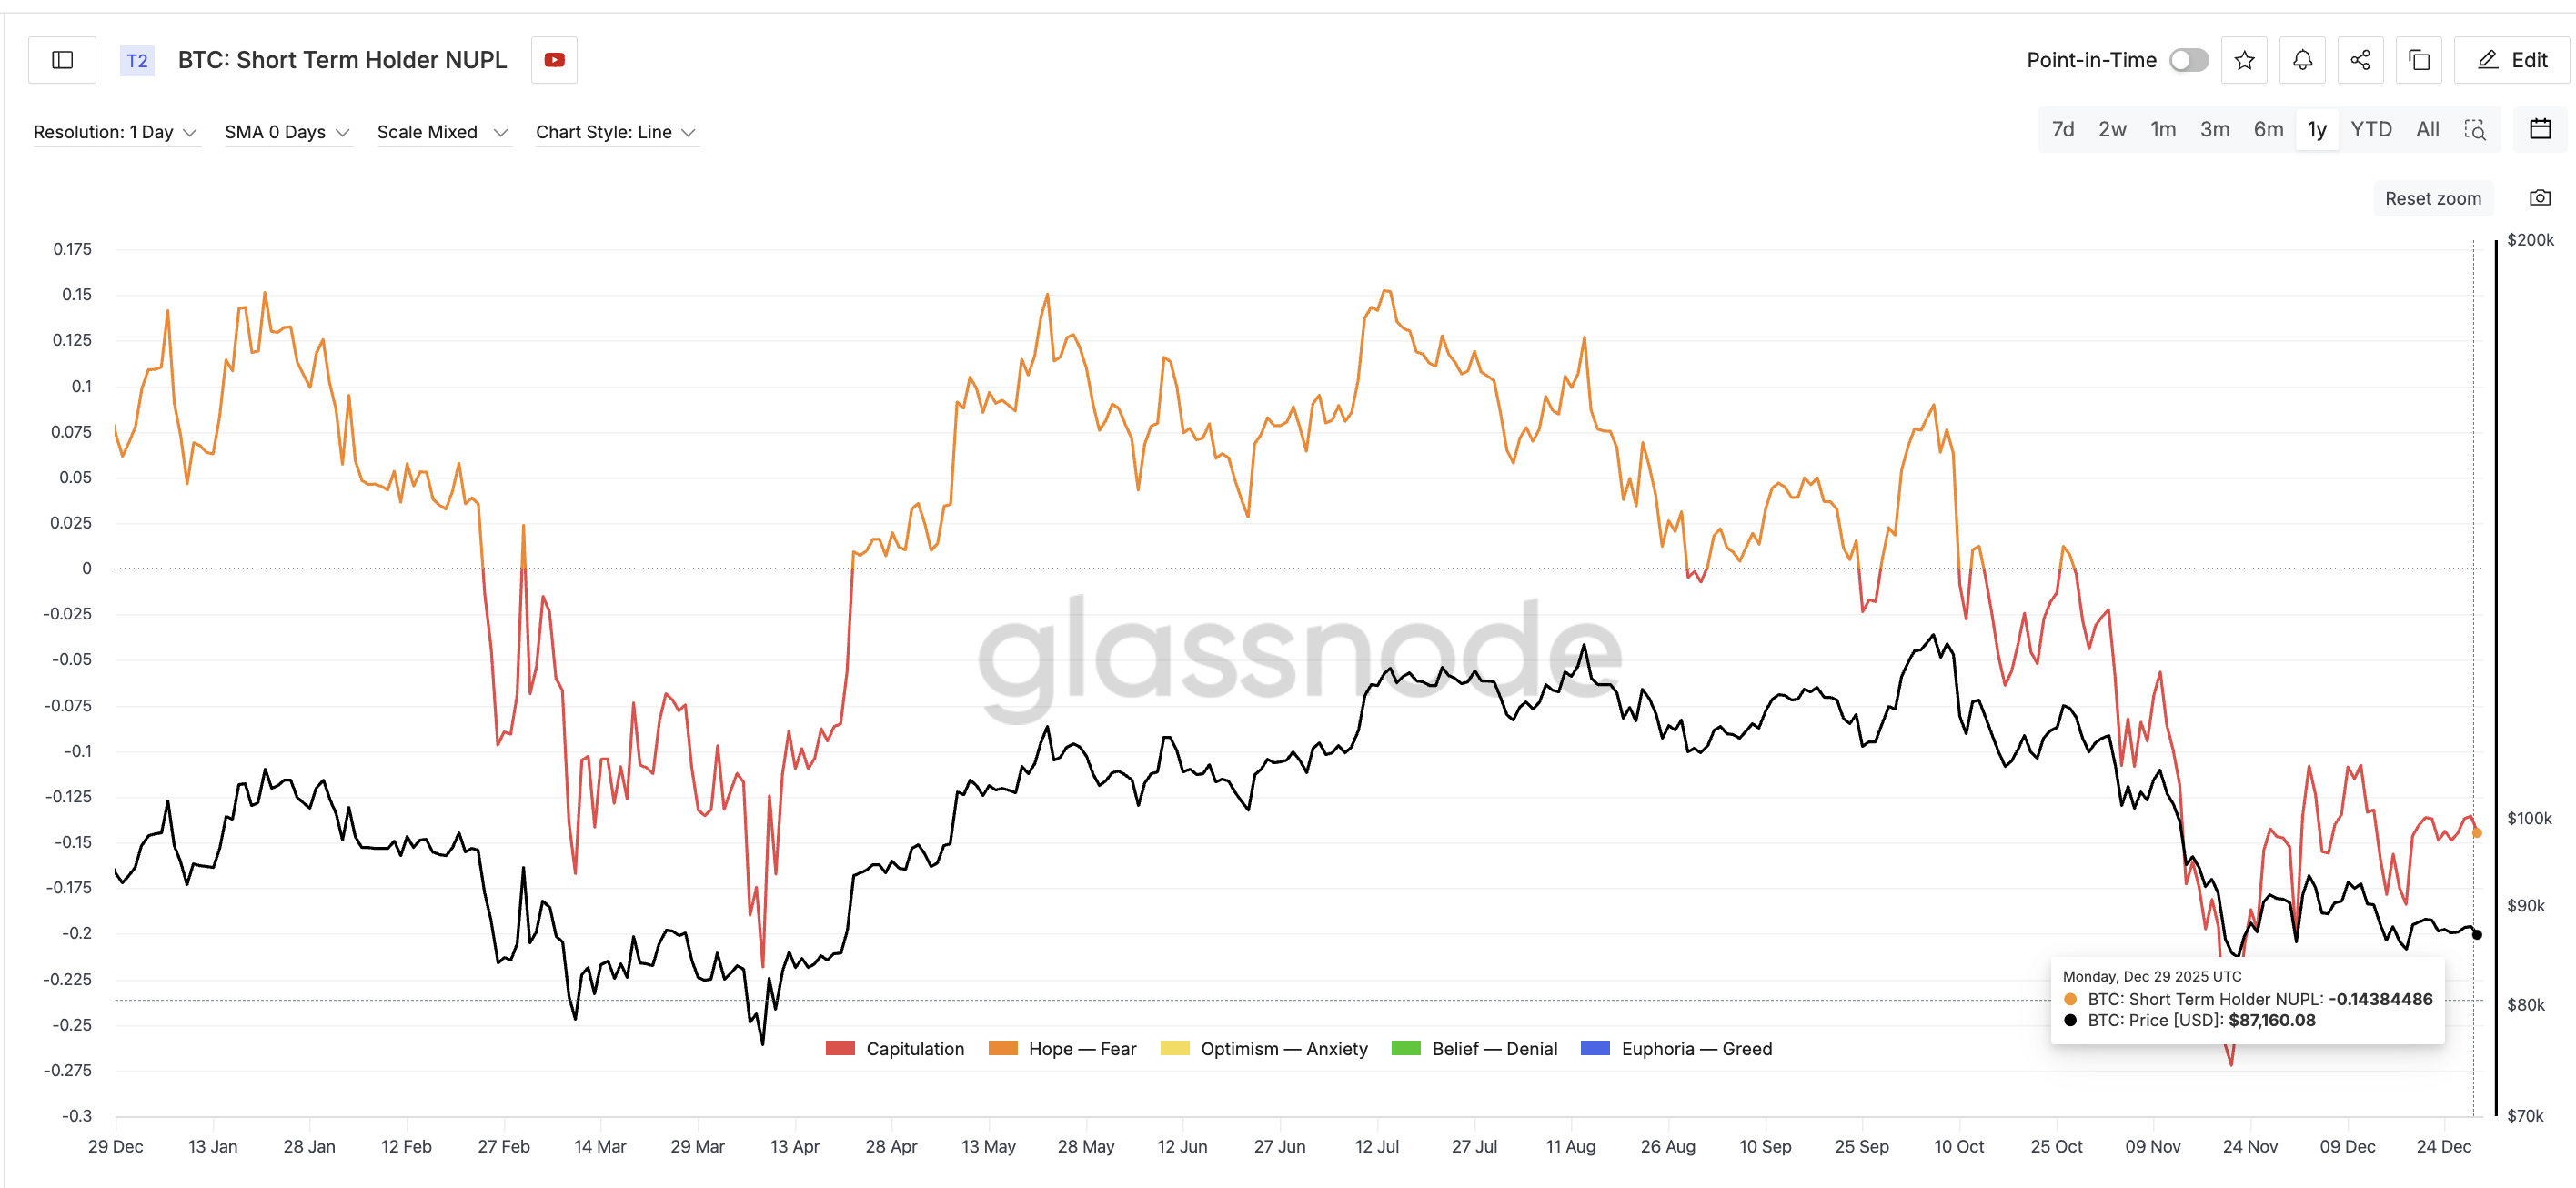 Capitulation Metric: Glassnode
Speaking to BeInCrypto, Hunter Rogers, co-founder of the global Bitcoin yield protocol TeraHash, underlined how meaningful this metric is:
“Speaking of one on-chain signal to pay attention to, for me, it’s short-term holders’ behavior versus long-term holders’ stability. As long as long-term holders stay firm, the cycle survives,” he mentioned.
So if the April capitulation helped build a bottom that later sent Bitcoin to new highs, the question today is simple:
Why hasn’t the same signal triggered a similar upside reaction yet? The answer lies in how long-term holders were behaving.
And that leads us to the next section: the groups that usually step in to absorb this capitulation — long-term holders and whales — have not been fully present this time. And they are still not fully there, weakening the lead up to 2026.
Long-Term Holders Step Back
Long-term holders (LTHs) usually step in when short-term holders capitulate. They absorb supply, stabilize price, and start the next leg. That’s what happened in April 2025. LTH net accumulation peaked at 22,237 BTC in one day back then and stayed in green throughout. It created a cushion for the price to recover.
This time, the cushion is thinner.
Since October 1, long-term holders have been selling. They finally stopped, but the buying has been modest. The recent peak (December 2025) in LTH accumulation sits near 4,862 BTC, and most days hover closer to 3,500 BTC. That’s barely 20% of the April strength.
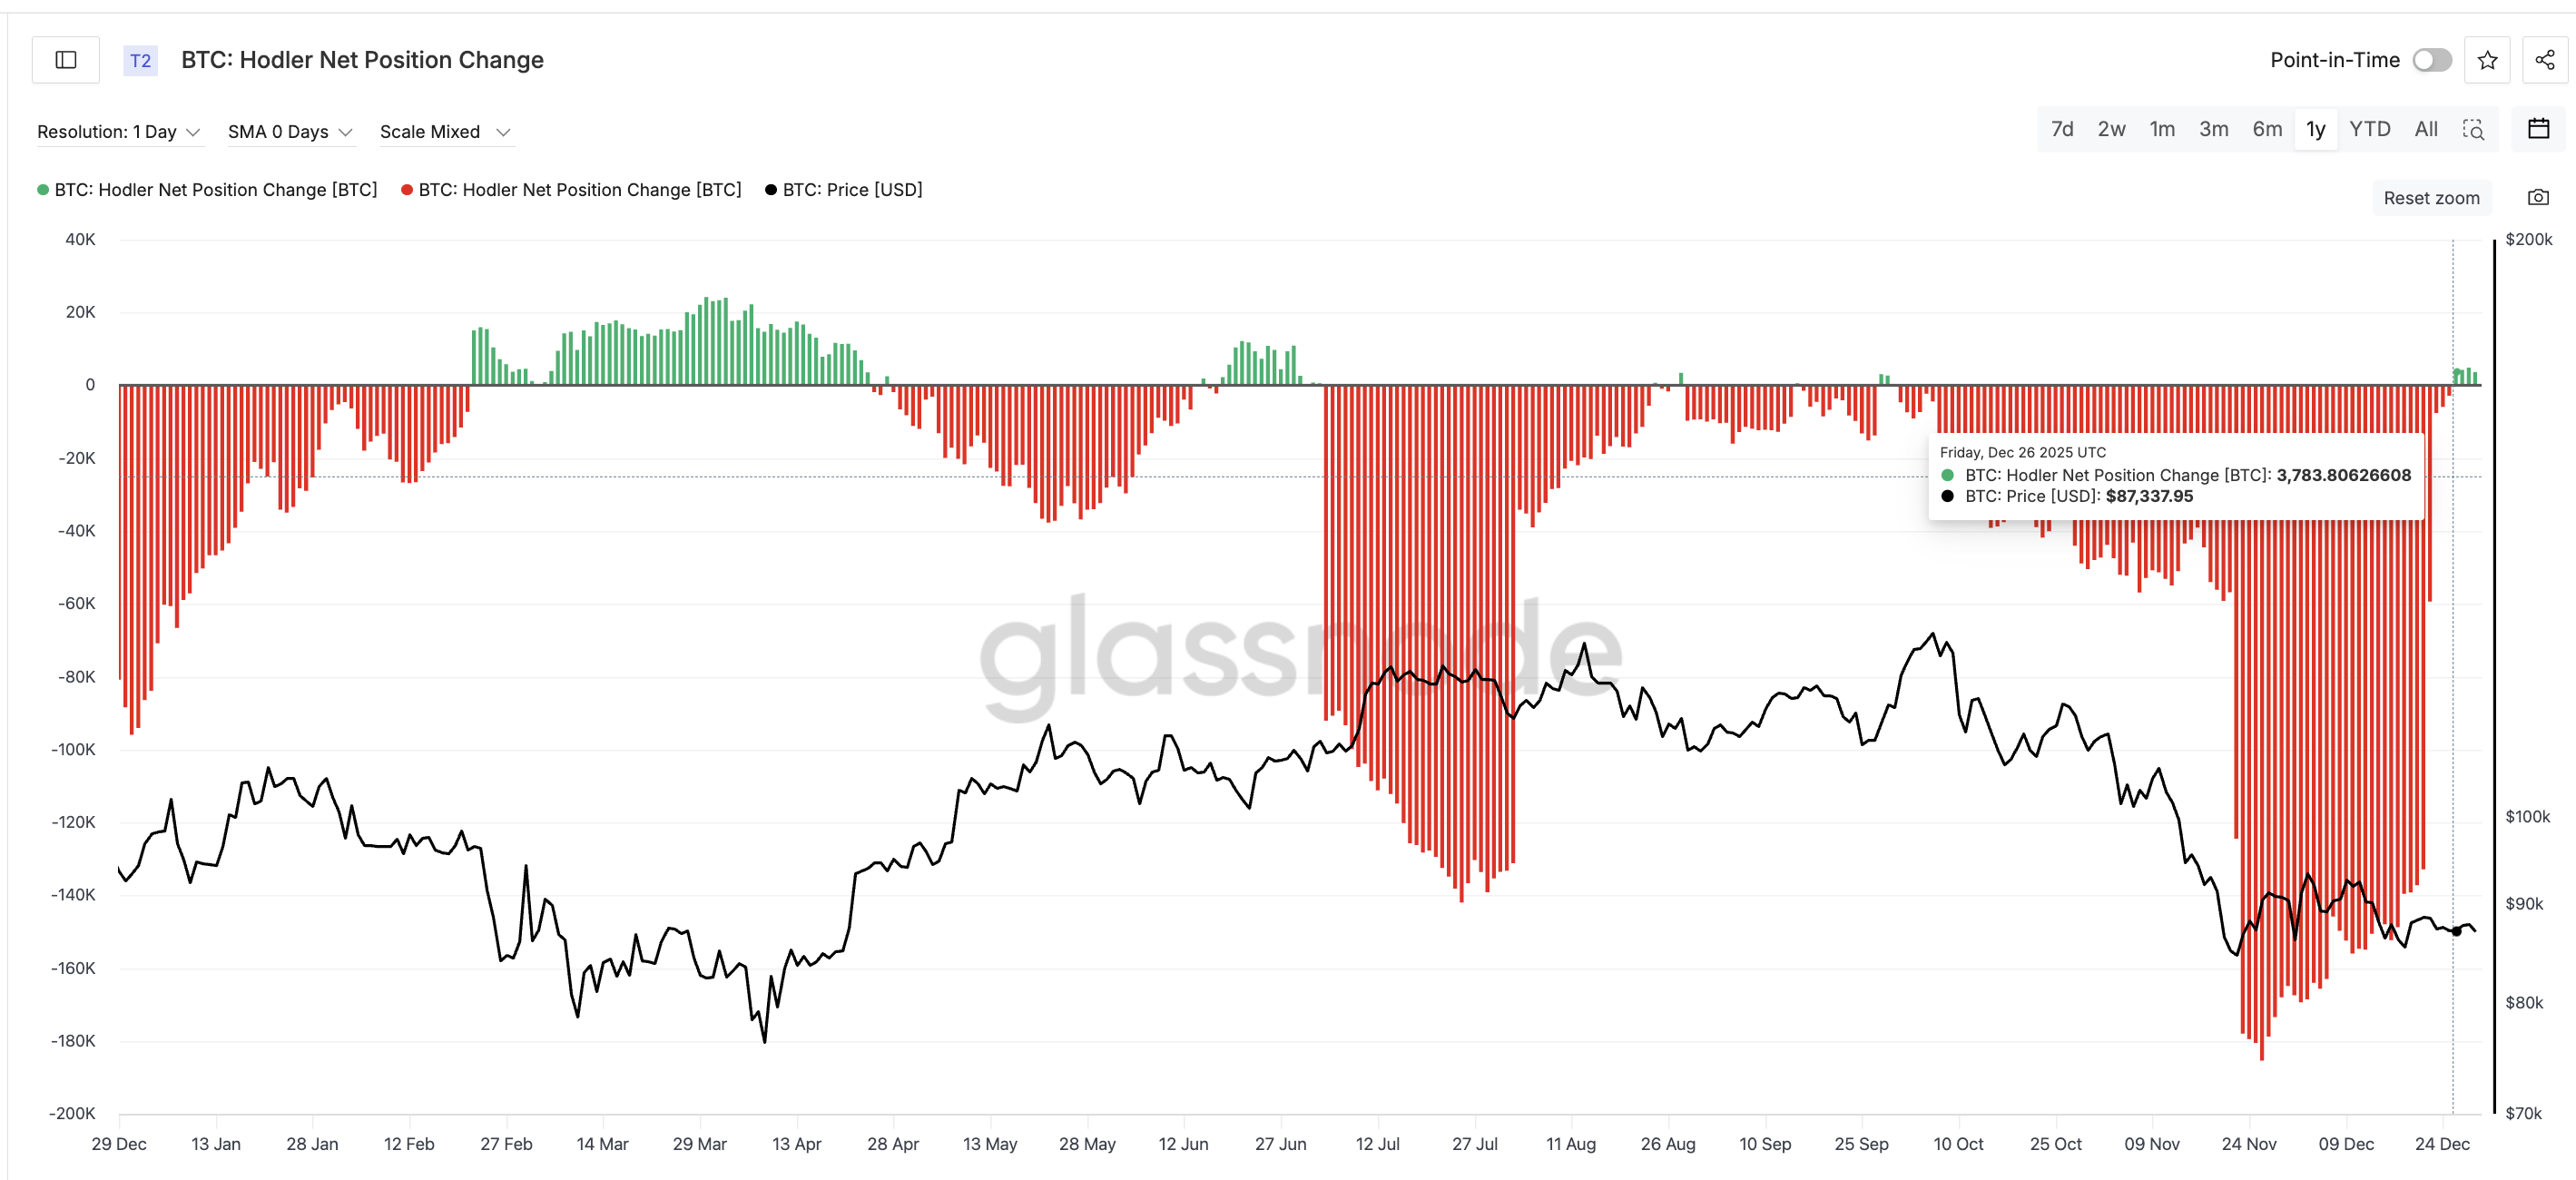 HODLers Back To Buying: Glassnode
The signal has improved, but it isn’t strong enough to flip the market by itself, going into 2026.
Rogers expanded on how critical this group is for cycle survival:
“As long as long-term holders stay firm, the cycle survives. Continued long-term holder stability supports outcomes where Bitcoin remains in a reset phase and potentially works higher over time,” he mentioned.
So the stability exists. The aggression does not. And without aggression, rallies stall.
Whales Go Quiet, and That Changes Everything
Then there are the whales.
Whale wallet counts holding 10,000–100,000 BTC remain at a yearly low. These wallets were rising into the April bottom and kept rising through July. That uptrend backed the run toward $126,000. Today, it’s the opposite. The lack of whale absorption leaves a gap. That gap is why the November capitulation didn’t ignite the price the same way April did.
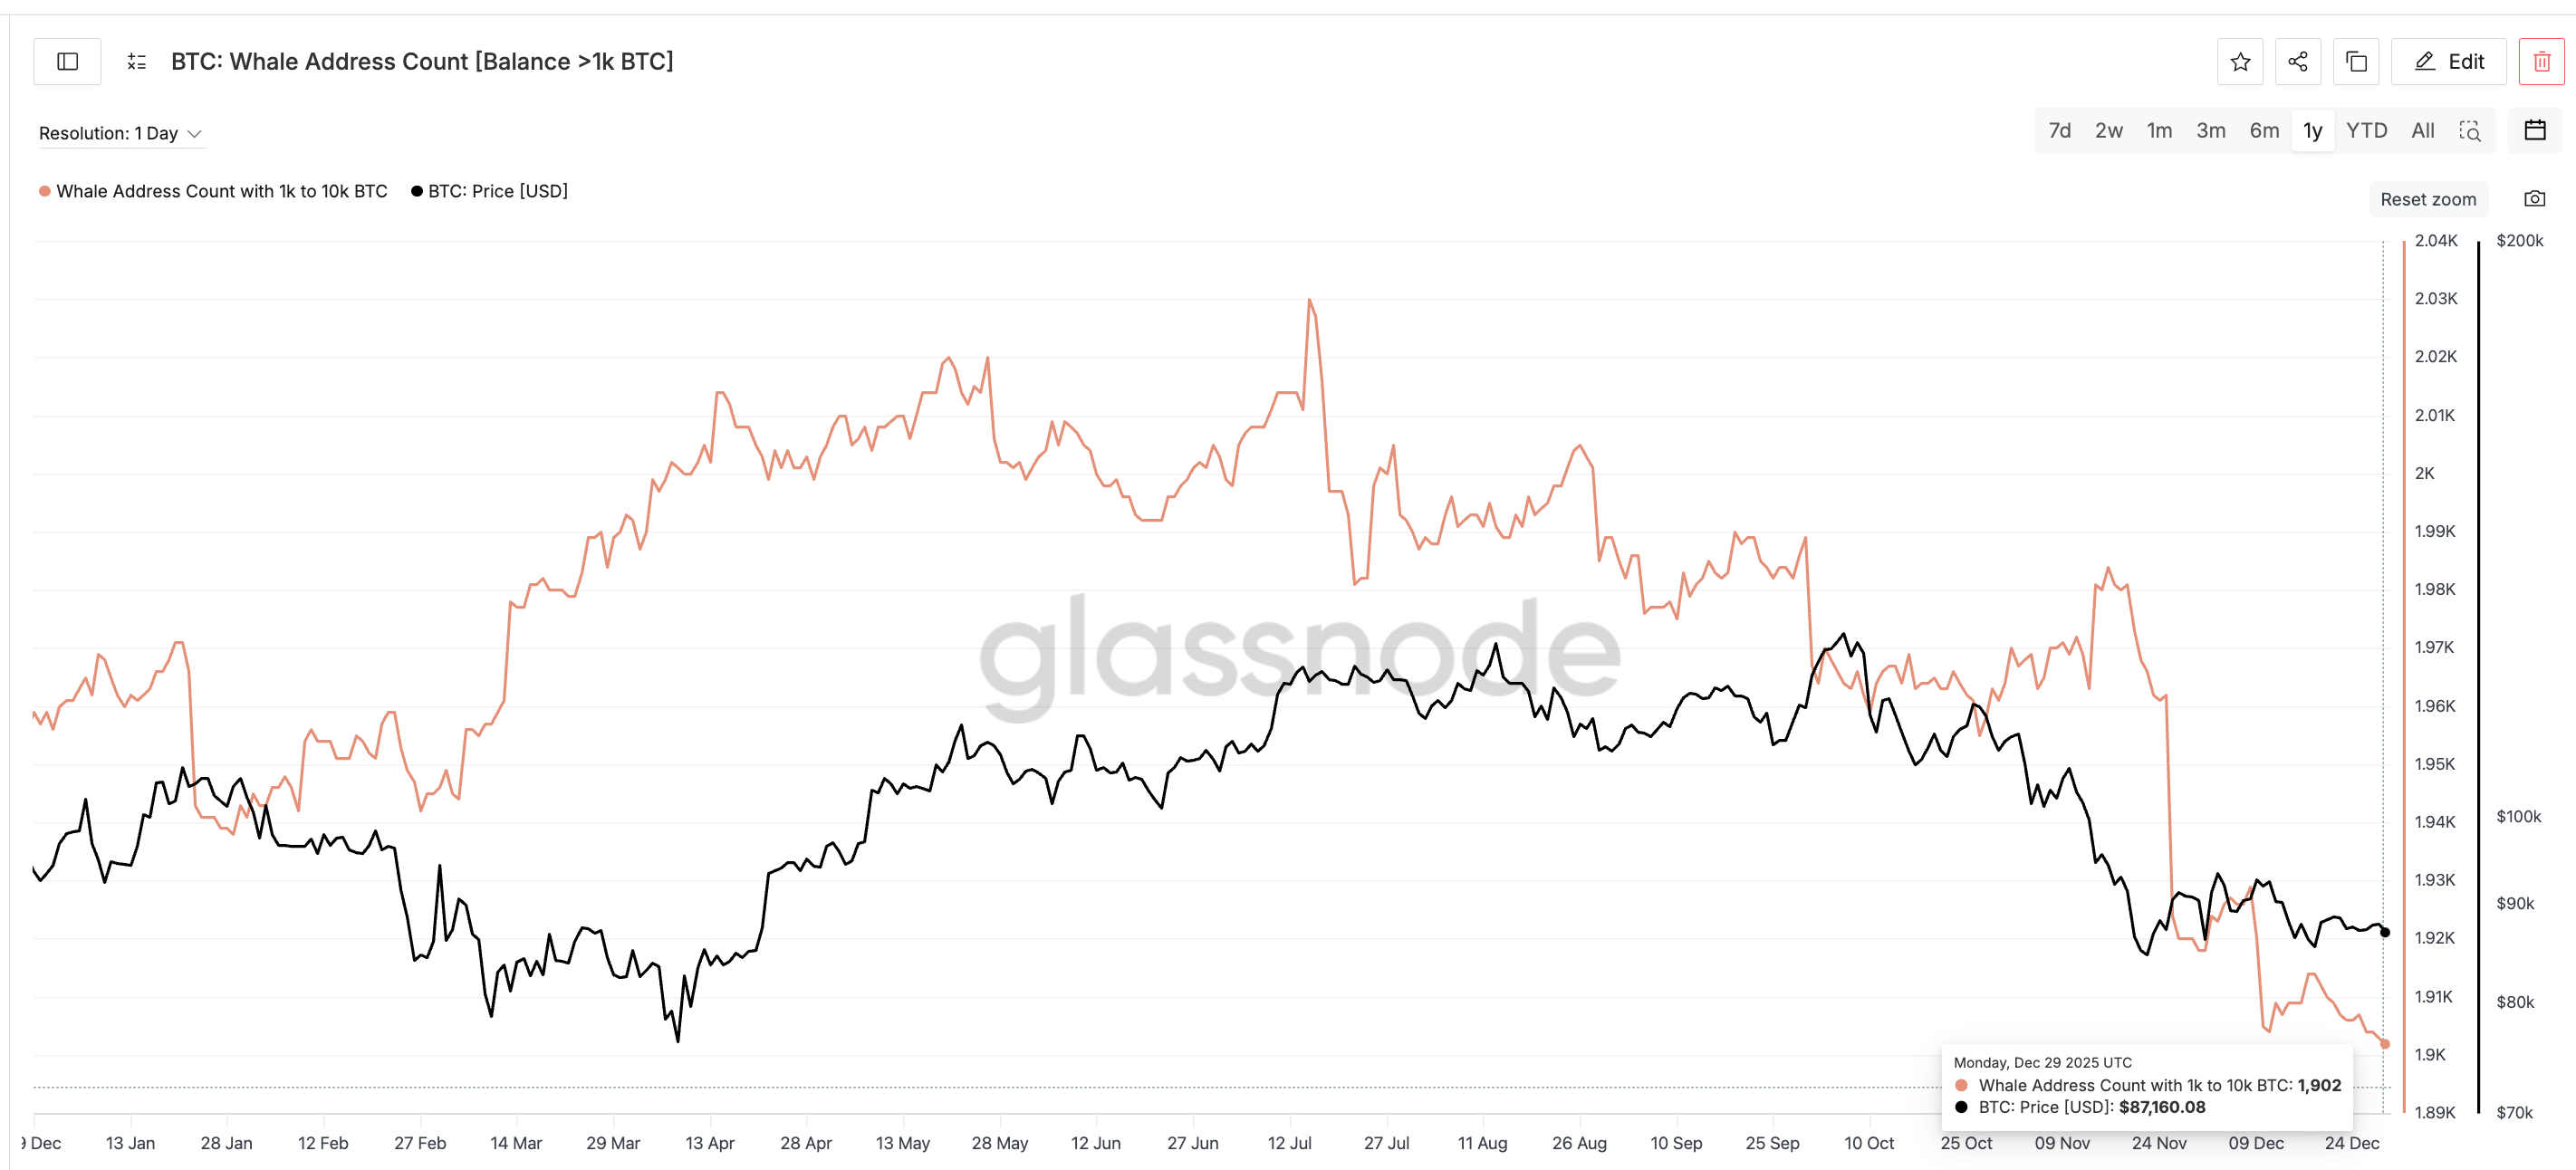 Whales Still Absent: Glassnode
Rogers highlighted this dynamic too:
“Retail still has a late reaction, while whales tend to absorb all the supply during weakness. This pattern keeps playing out again and again,” he highlights.
Right now, the disconnect is clear. Short-term capitulation has appeared, but long-term holders and whales are not absorbing the supply the way they did before major BTC upside phases. Whales are not acting as the shock absorbers yet, which keeps the market vulnerable to breakdown pressure rather than breakout momentum.
Rogers warned that this has direct implications for bullish targets:
“So, can Bitcoin go above $150,000 in 2026? Possibly. But it requires patience, liquidity, broader institutional adoption, and time,” he said
He also pushed back on the most aggressive forecasts:
“Various scenarios of Bitcoin reaching $250,000 or more this year aren’t realistic to me at this point,” he added
This, in a way, goes against the aggressive Bitcoin price prediction made by the likes of Tom Lee and YoungHoon Kim, at least for now.
But the real question is, despite the short-term capitulation sign, why are long-term holders and whales not coming in aggressively? The answer sits on the chart and inside the price structure.
What The Bitcoin Price Chart Says About 2026
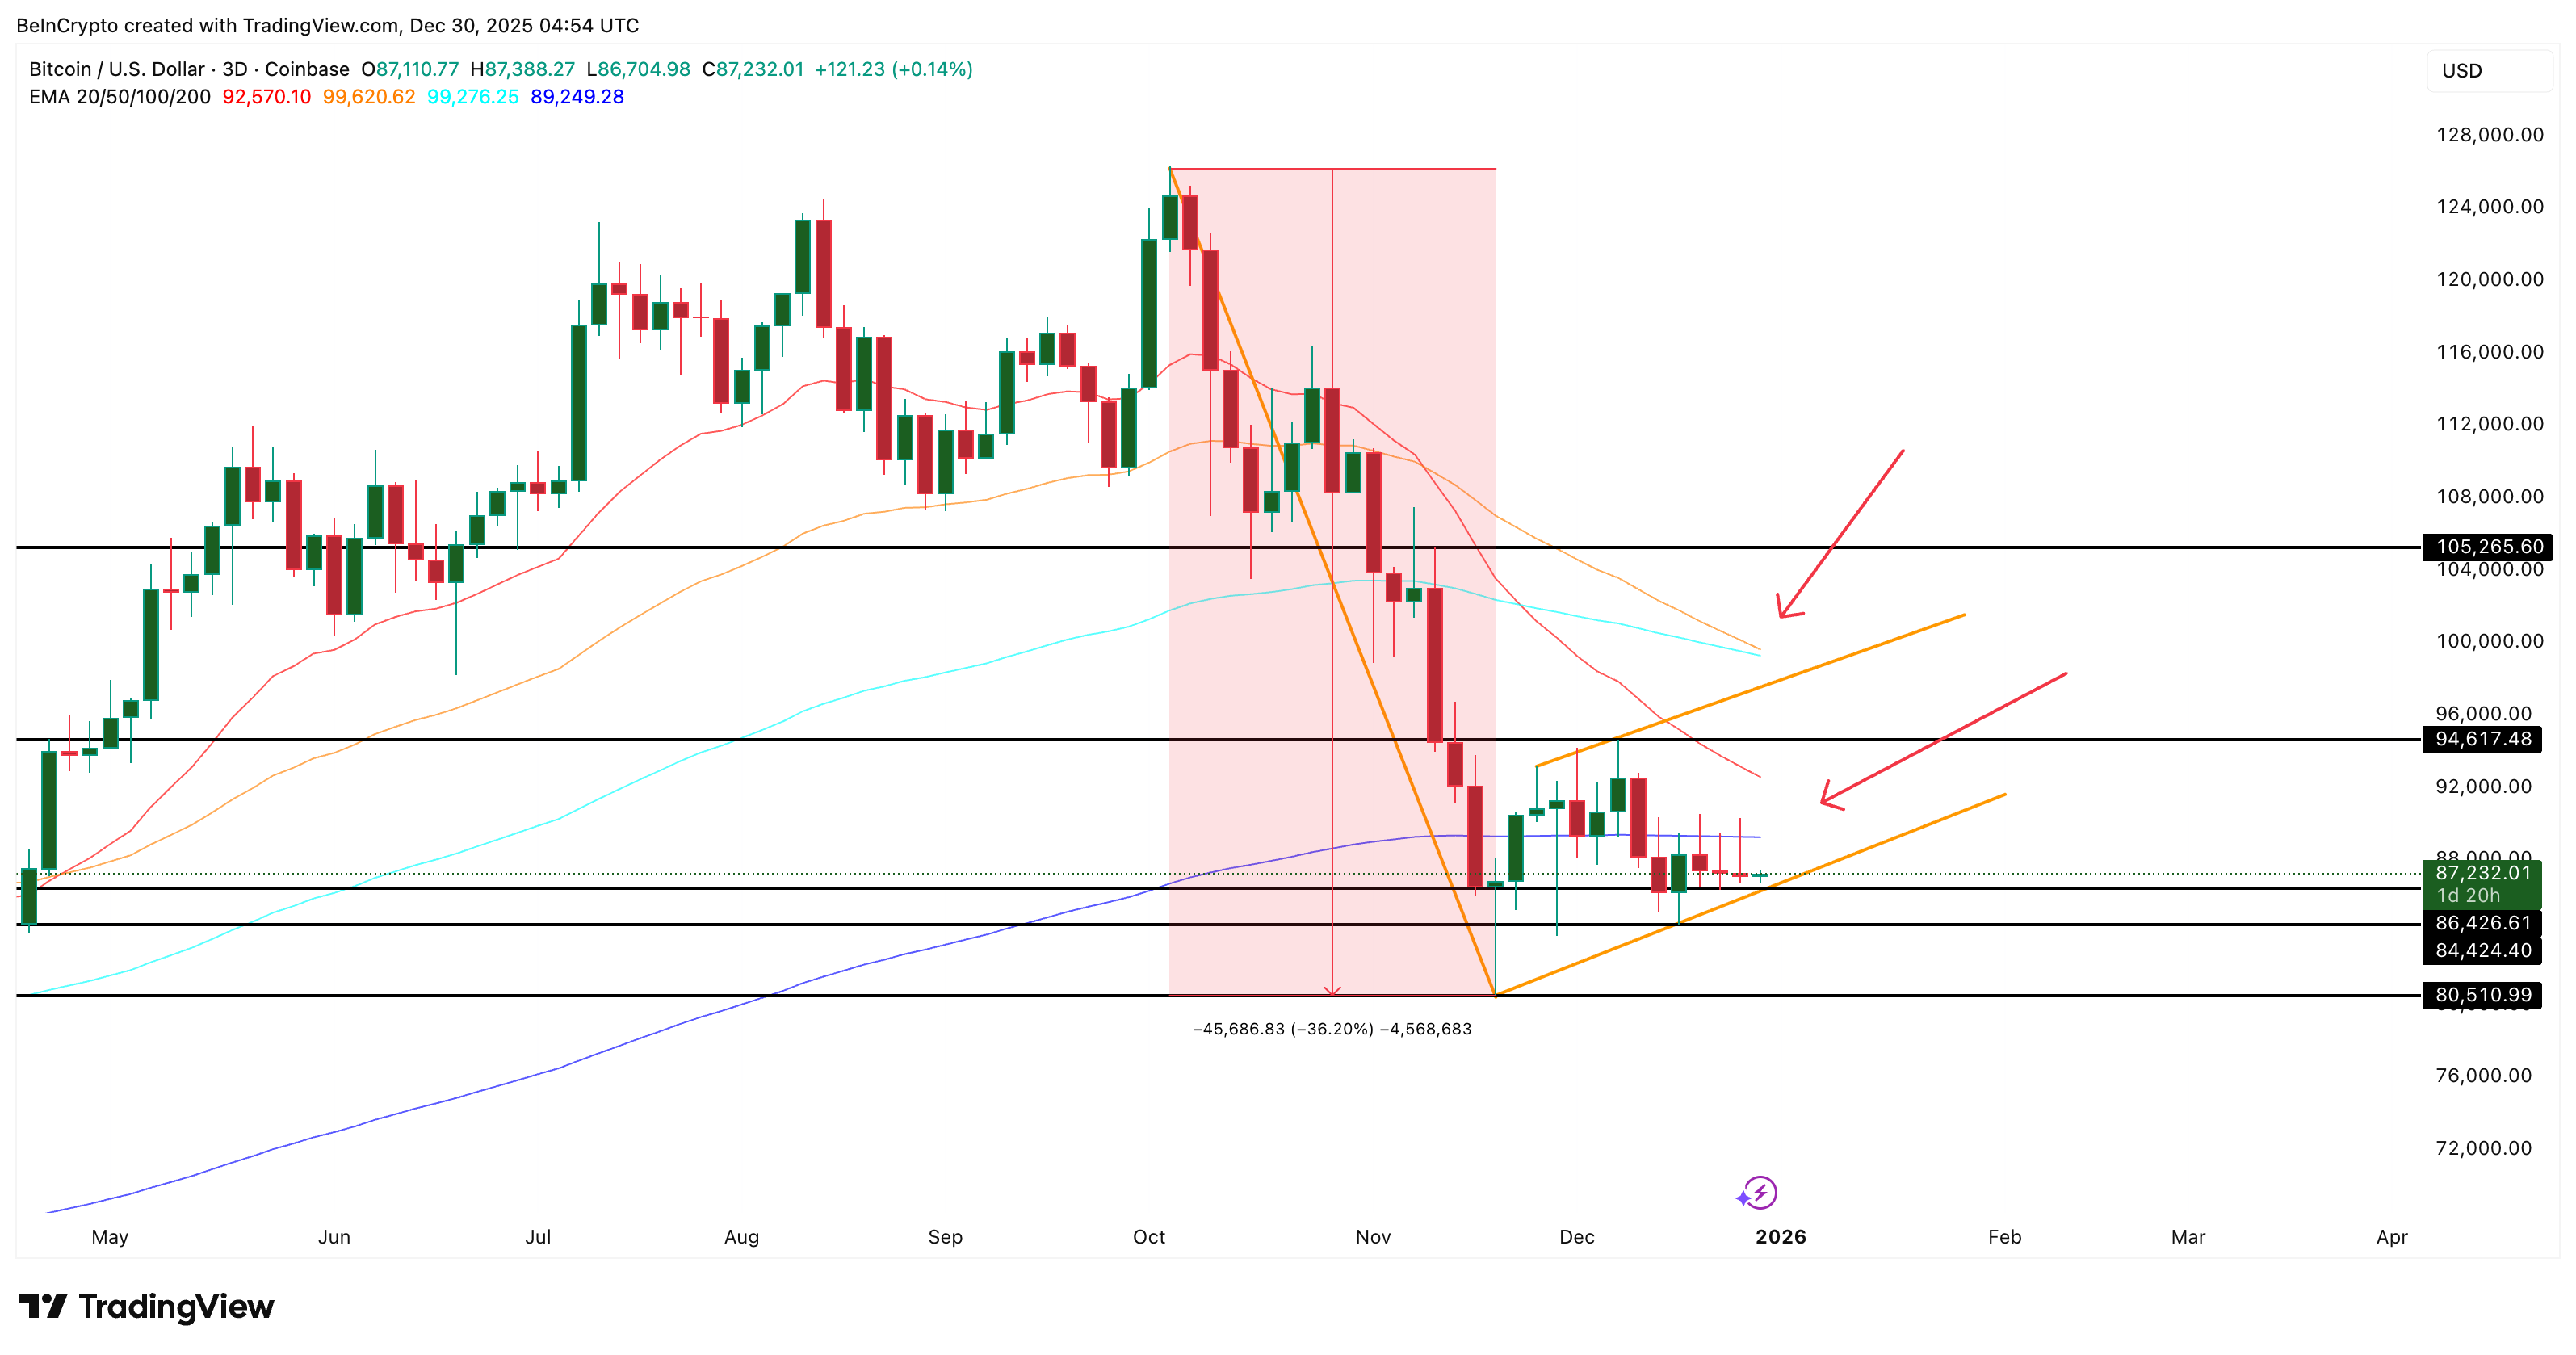
On the three-day chart, Bitcoin is sitting inside what looks like a bear flag.
The measured move of that structure puts a breakdown risk of roughly 36%. This risk grows because two bearish EMA crossovers are close. EMAs are moving averages that react faster to price. The 50-period EMA is closing in on the 100-period EMA, and the 20-period EMA is closing in on the 200-period EMA.
If both cross, it signals weakness while the flag is testing support near $86,420. That combination can explain why whales and other deep pockets are still cautious, highlighting behavioral concerns.
 Bearish BTC Chart: TradingView
Hunter Rogers told BeInCrypto the same thing:
“Bitcoin’s moves in 2026 will be decided more by behavior around cost and risk,” he said
Right now, that behavior is stuck. Whales are not committing, and the price is struggling to leave this range.
For upside to matter, Bitcoin needs to reclaim $105,200. That would invalidate the breakdown projection. If it does, the previous peak near $126,000 could be reached again or even bettered.
As Rogers put it:
“The market already showed a peak near $126,000, yet this alone doesn’t end a cycle. What ends it is a forced selling below the collective cost,” he believes.
That “collective cost” sits near the realized price in the mid-$50000s.
Rogers called this his line in the sand:
“As long as the price stays firmly above the broad realized cost area around the mid-$50000s, the market structure is stable,” he highlighted
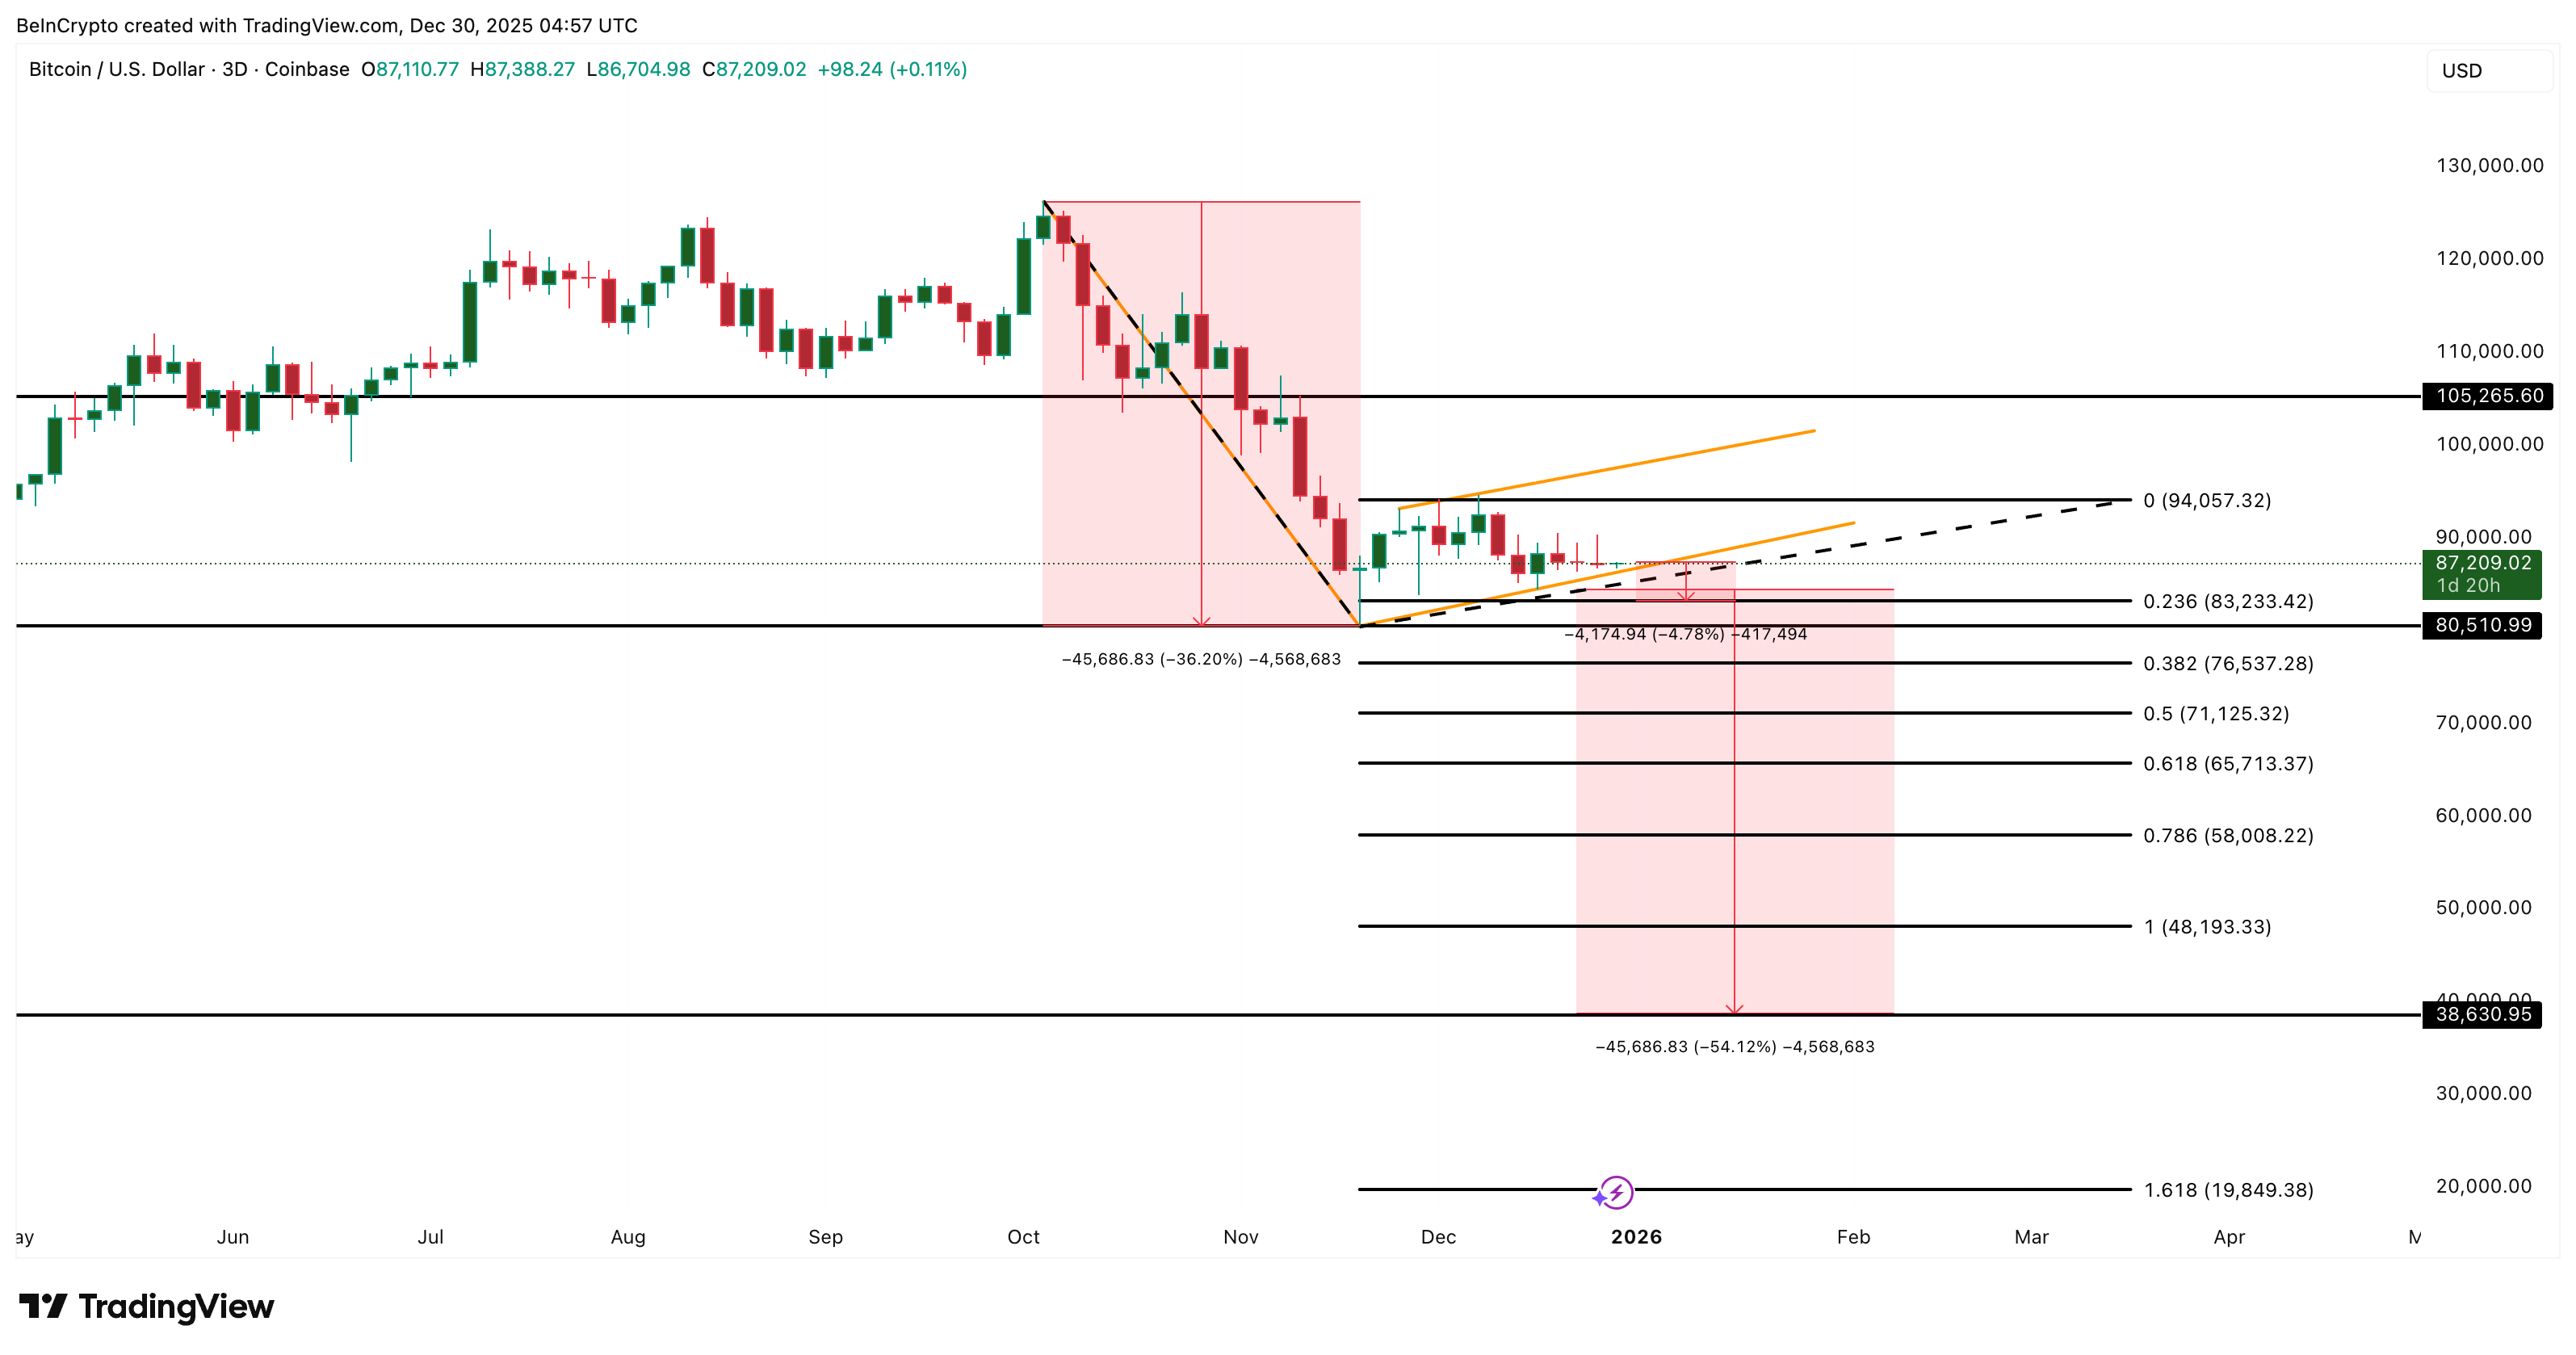
A sustained drop under that zone would flip the outlook and could align with the lower bear flag target near $38,630. That move would threaten the structure and could force long-term holders into losses. Above $105,260, the structure improves.
Below the mid-$50,000s, the structure breaks. That is why the $58,000 level on the chart is the key.
 Bitcoin Price Analysis: TradingView
What’s Next For BTC in 2026?
Right now, Bitcoin’s situation is pretty direct and simple:
- The bottom signal has appeared. (STH capitulation)
- The demand that usually follows has not. (whales and hodlers)
- A bearish chart setup hangs over it. (bear flag breakdown looms)
A breakout above $105,000 or a breakdown under $83,300 could answer the question the market keeps avoiding: Will 2026 see a new Bitcoin price peak or a fresh breakdown?
Recommended Articles


