


Ripple Price Forecast: XRP extends losses amid suppressed network activity
- XRP holds below $1.90, weighed down by a deteriorating technical picture as the RSI edges lower.
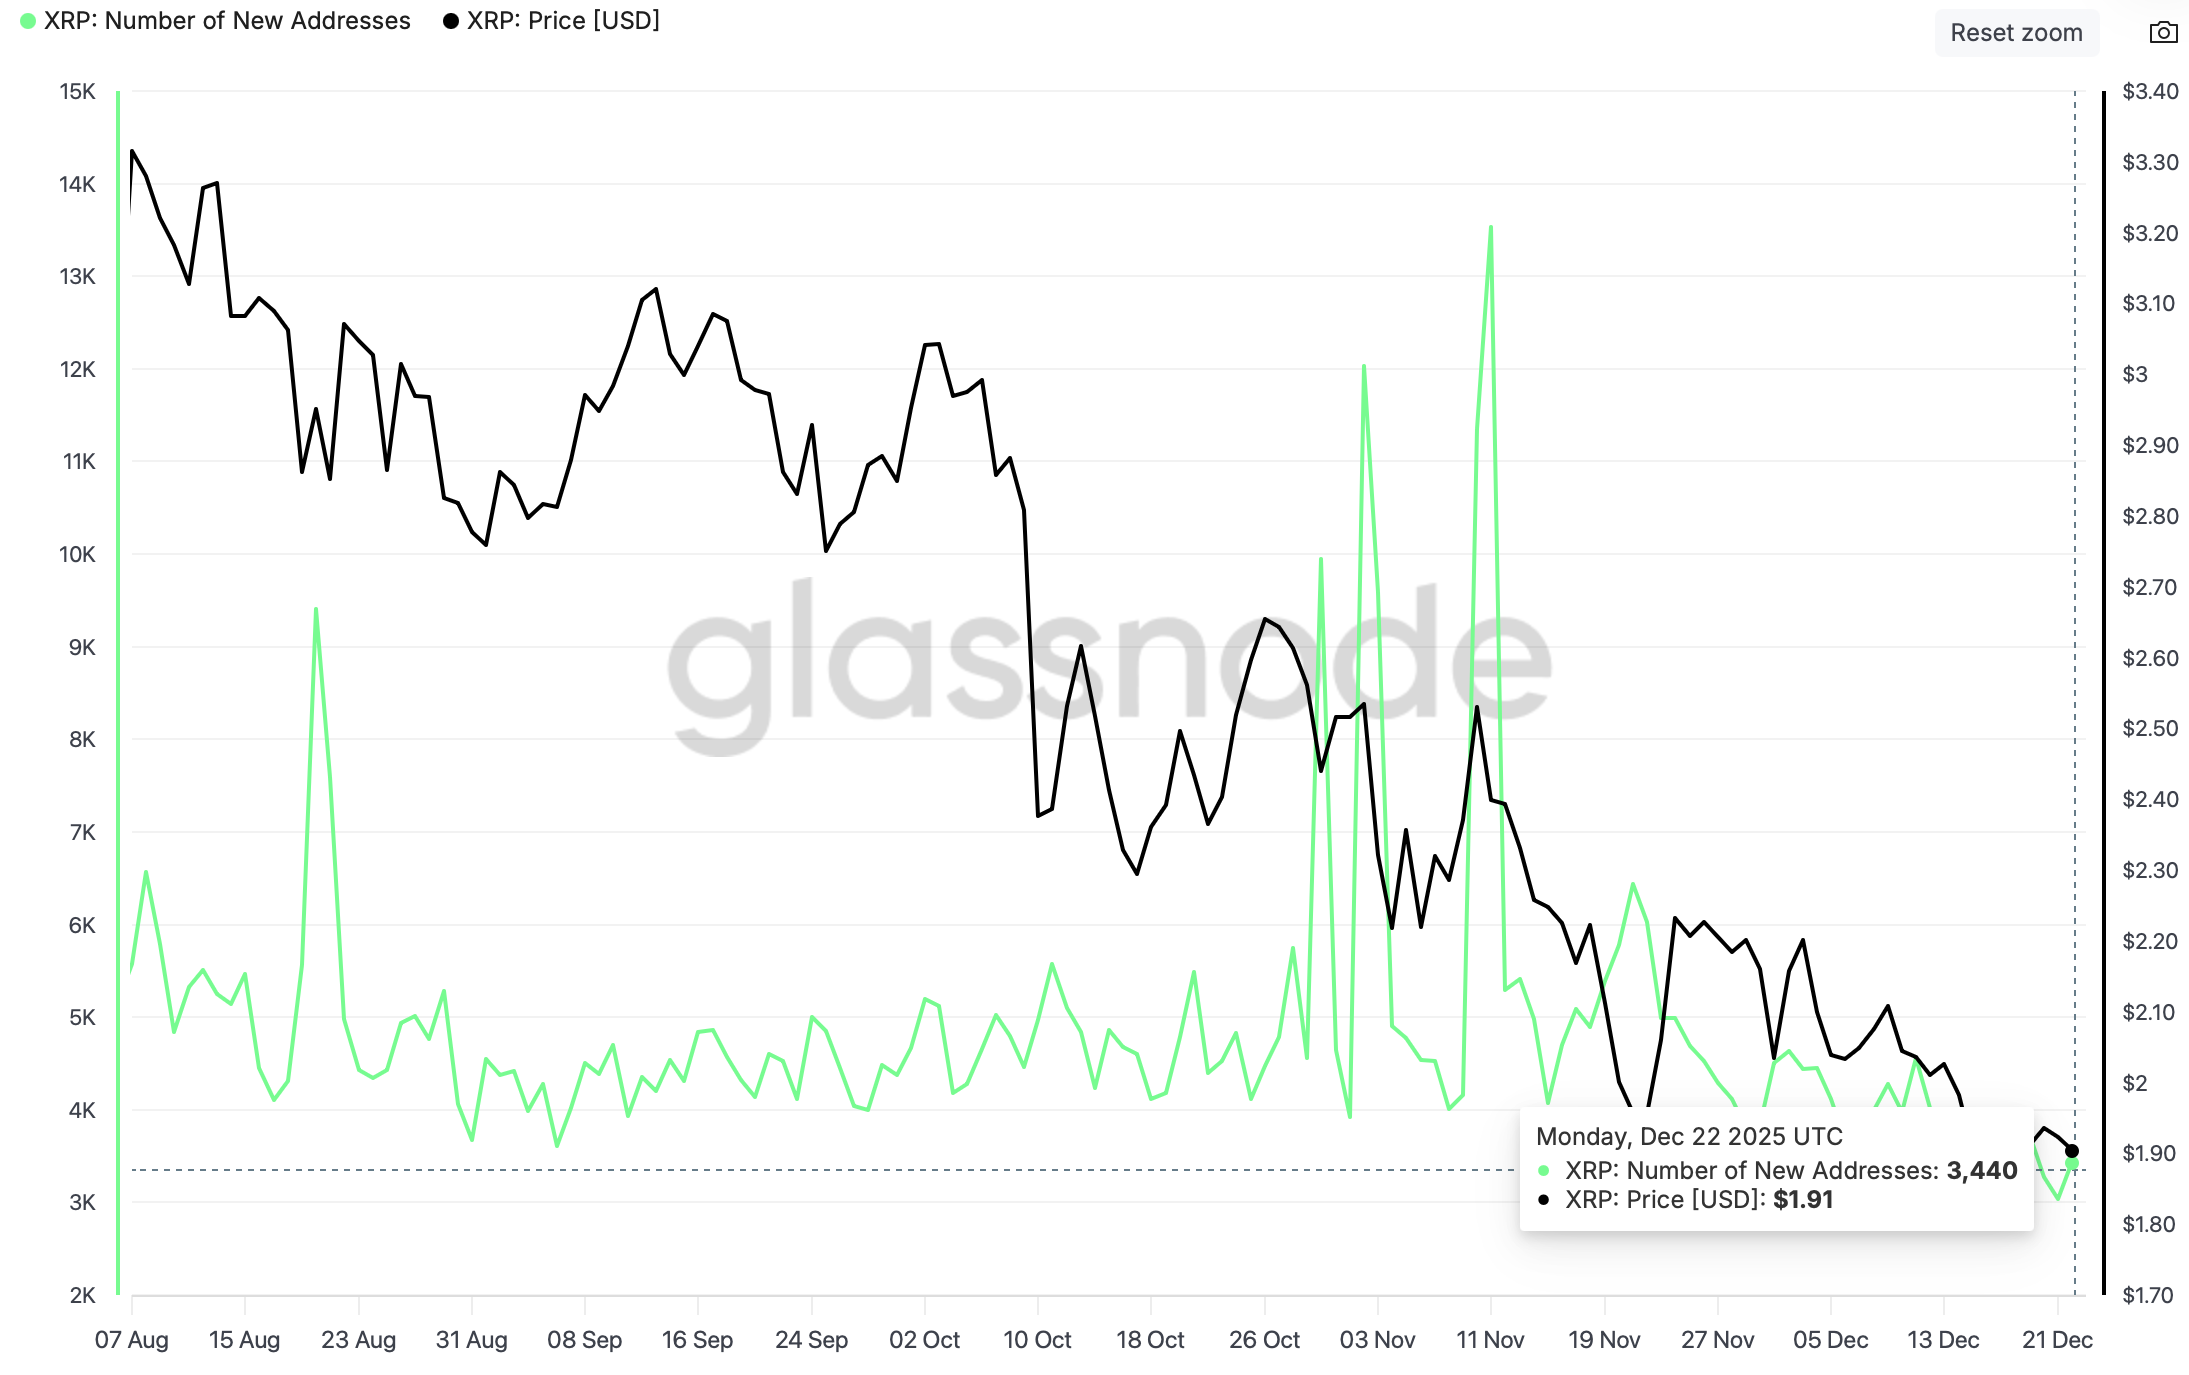
- The XRP Ledger faces a significant slump in on-chain activity, with newly created addresses averaging 3,440.
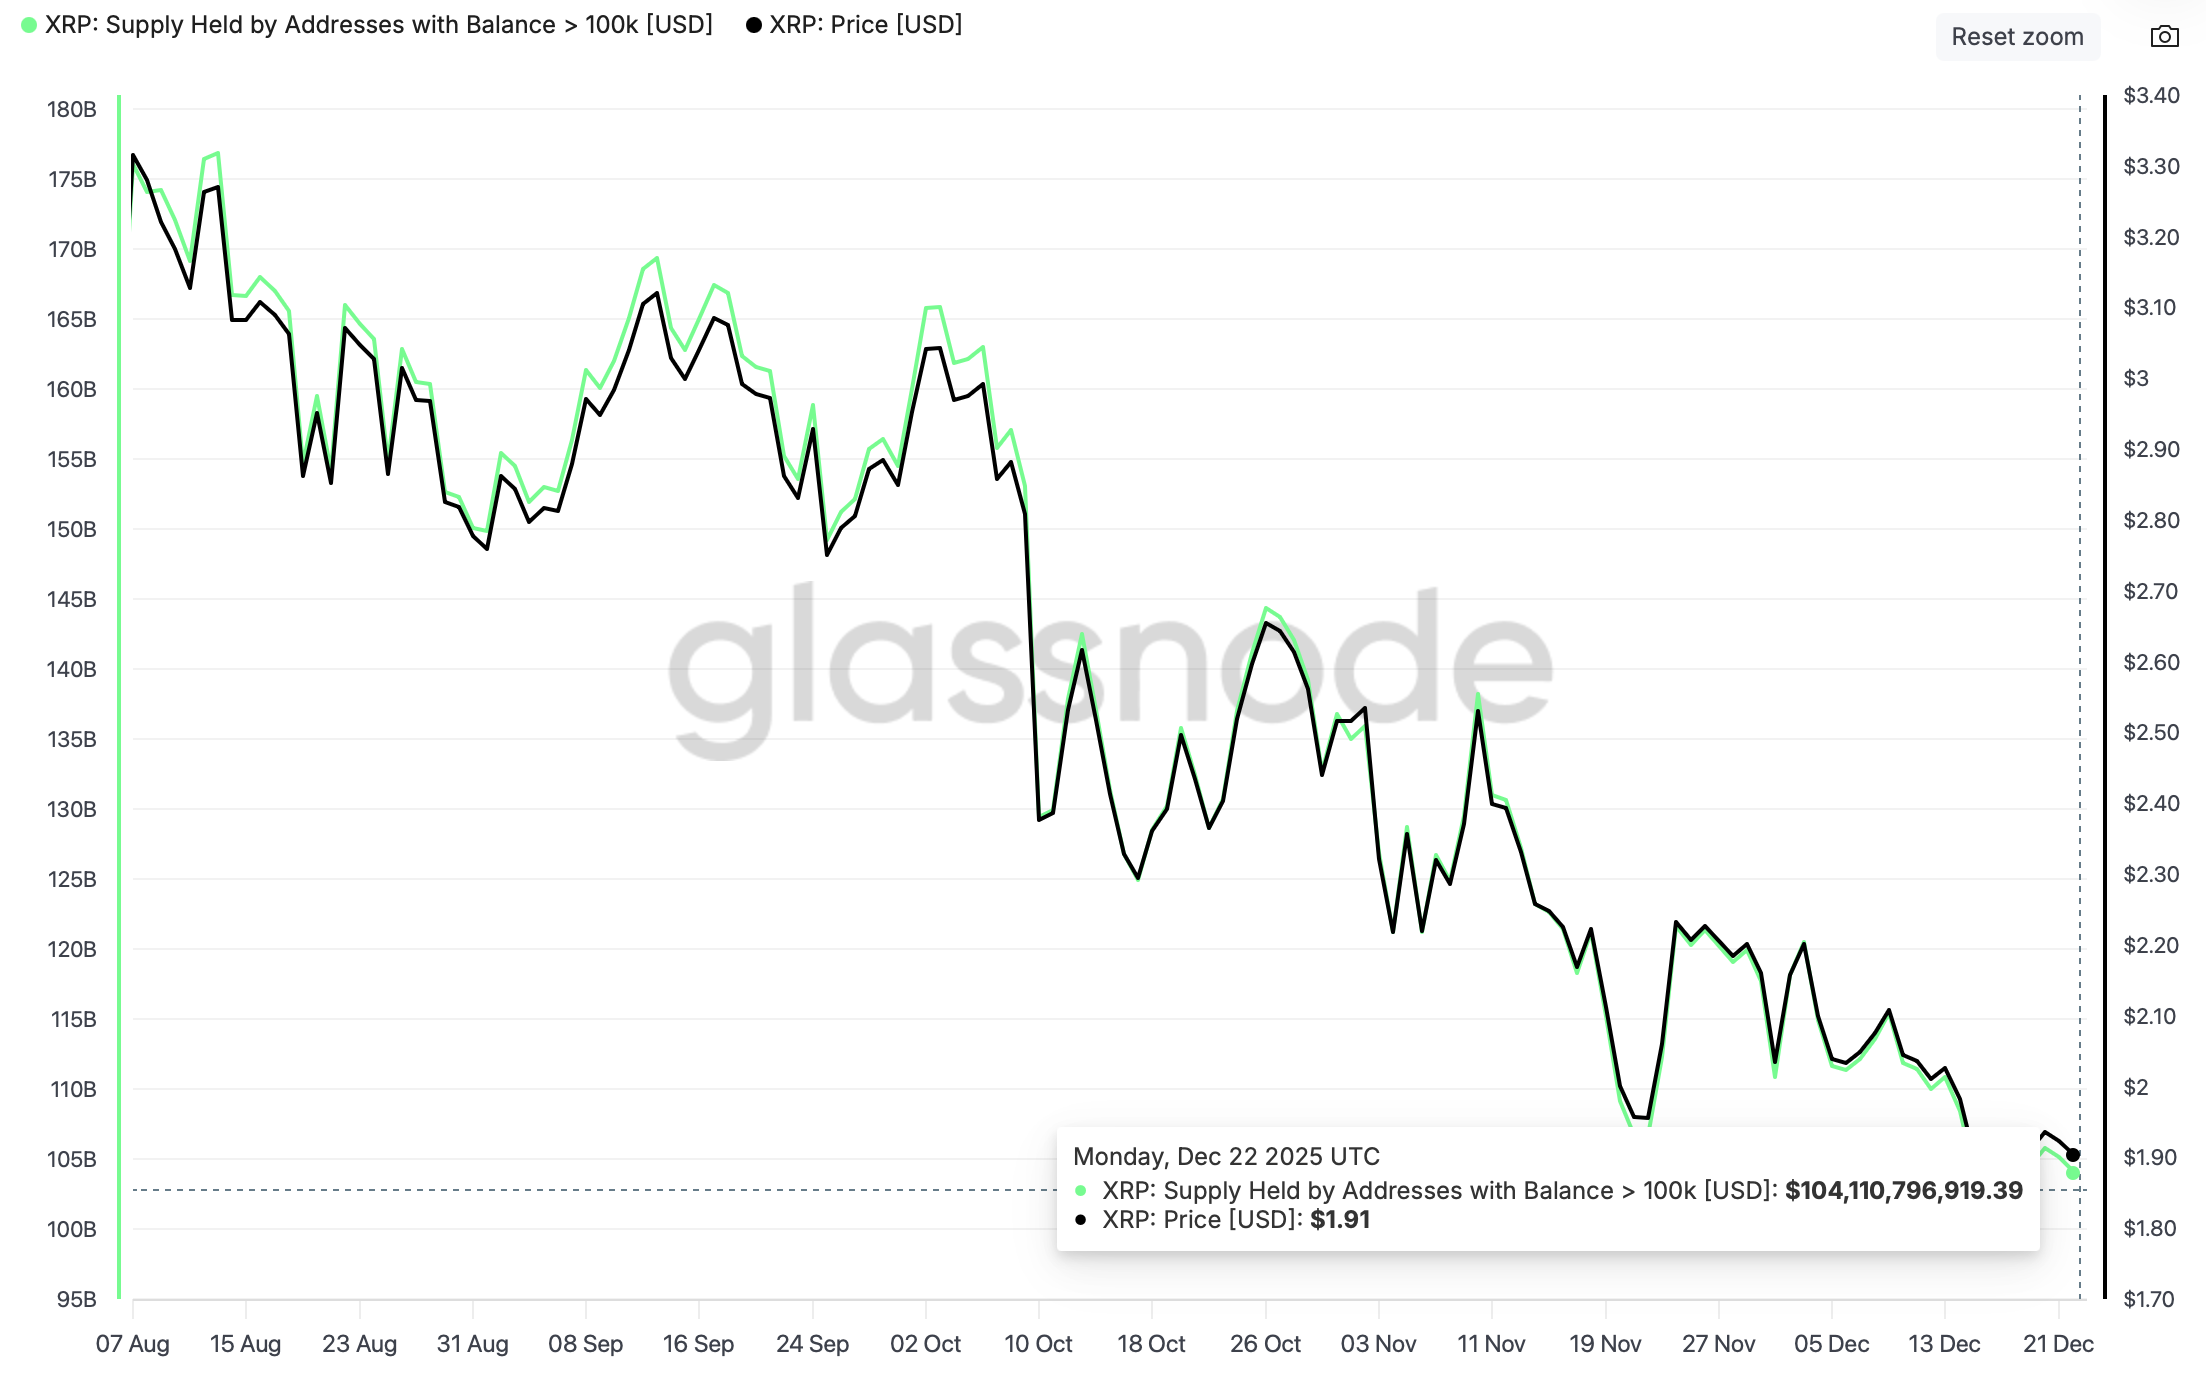
- XRP whales persistently reduce risk exposure, with the value held by addresses with more than 100,000 tokens falling to $104 billion.
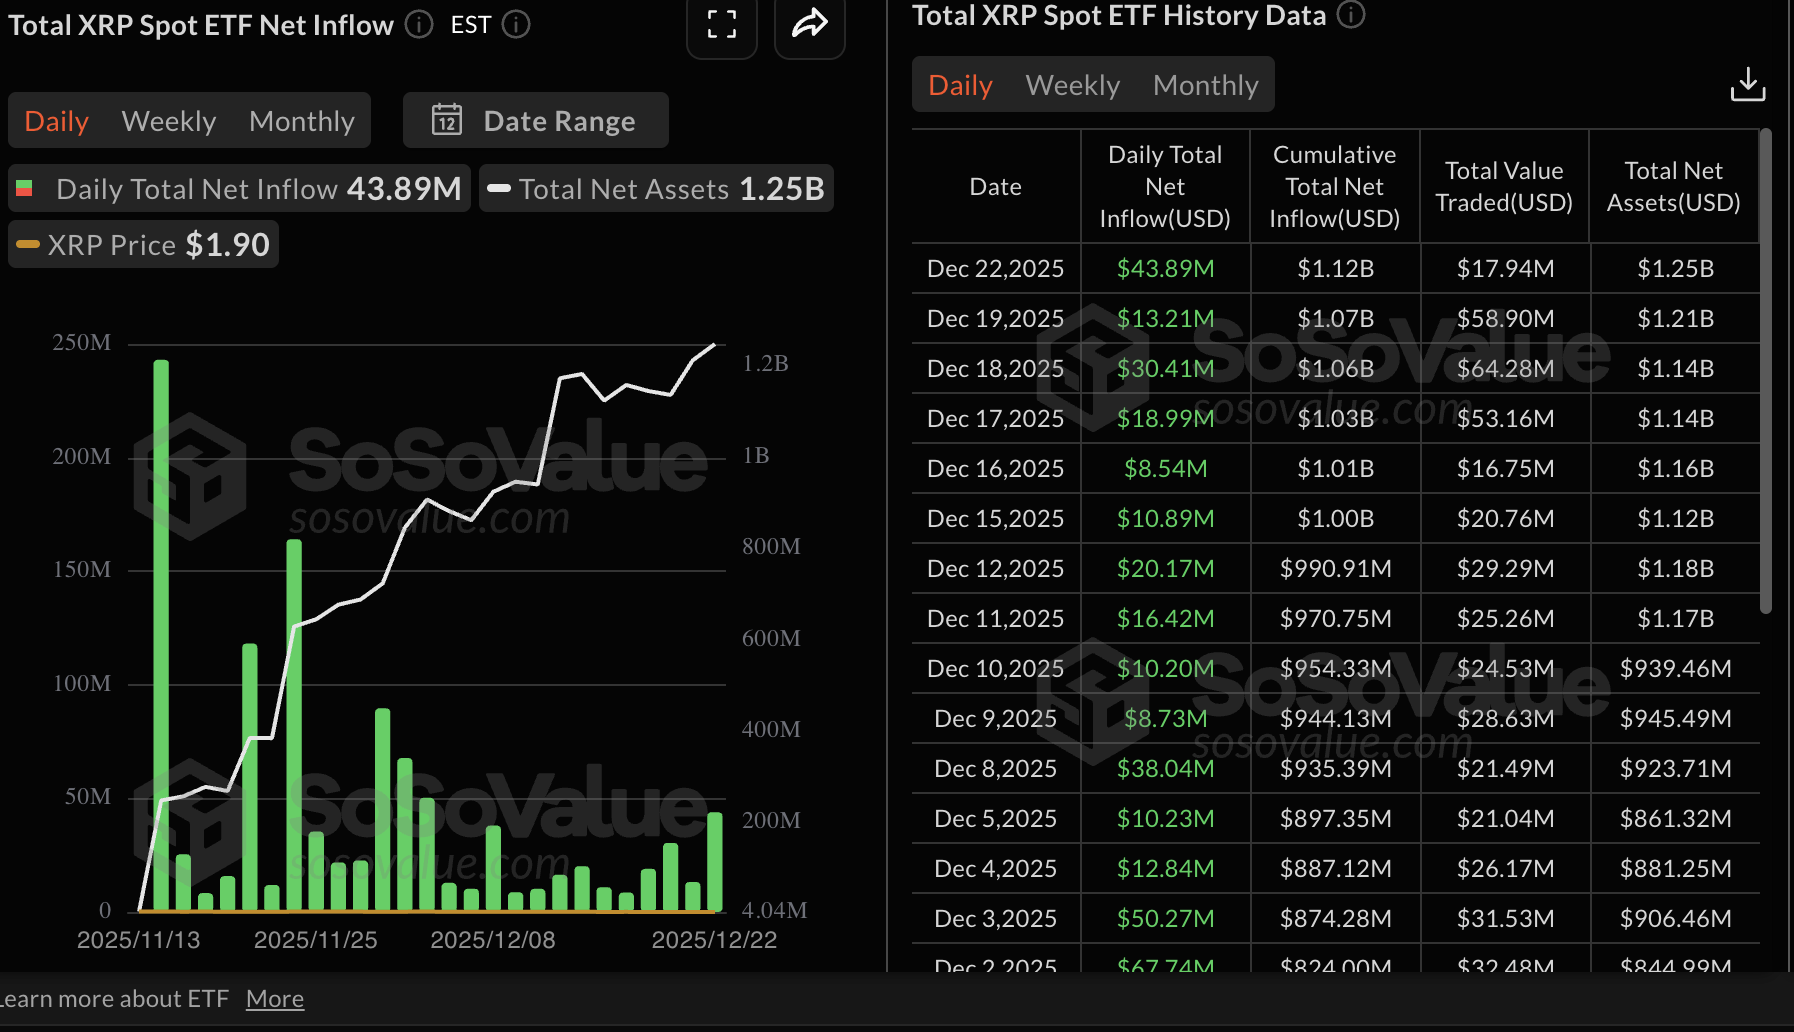
Ripple (XRP) is extending its decline below $1.90 at the time of writing on Tuesday, as headwinds intensify across the crypto market. Negative market sentiment has persisted despite a surge in inflows to XRP spot Exchange Traded Funds (ETFs) .
As reported, US-listed XRP ETFs posted nearly $44 million in inflows on Monday, up from approximately $13 million on Friday. The cumulative net inflow stands at $1.12 billion, and net assets at $1.25 billion.
XRP Ledger on-chain activity dips
The number of newly created addresses on the XRP Ledger (XRPL) has remained relatively suppressed, averaging 3,440 as of Monday, down from 4,501 on December 1 and approximately 13,500 on November 11.
A low number of active addresses indicates that adoption of XRP on the protocol has declined, which in turn reduces demand. Unless a reversal occurs and new addresses increase, it could be difficult for XRP to sustain its recovery amid headwinds.
Meanwhile, the Supply Distribution metric shows that the notional value held by addresses with over 100,000 coins has declined to approximately $104 billion as of Monday, from nearly $106 billion on Sunday and almost $108 billion, recorded on December 1.
Glassnode’s chart below highlights a steady decline in the value held by this cohort of investors, whose average value was $129 billion on October 10 and $191 billion on July 21. XRP reached a new record high of $3.66 on July 22 but gradually trimmed gains in the following months until the October 10 crash, which accelerated the decline to $1.25.
If the whales continue reducing exposure, overhead pressure will persistently overwhelm demand, keeping the XRP price in a downward spiral.
Technical outlook: XRP edges lower amid a weakening technical structure
XRP is trading at $1.87 at the time of writing on Tuesday, while holding below the falling 50-day Exponential Moving Average (EMA) at $2.12, the 100-day EMA at $2.31 and the 200-day EMA at $2.40, which keeps bears in control. The Relative Strength Index (RSI) has declined to 39 within the bearish region. A persistent decline below 40 leaves room toward 30 before oversold conditions emerge, while a push above 50 would strengthen an upside bias.
Meanwhile, the Moving Average Convergence Divergence (MACD) showcases marginally positive histogram bars. Despite the blue MACD line staying above the red signal line, momentum is fragile. A close below Friday's low of $1.77 would open the door for extended losses toward April's support at $1.61.
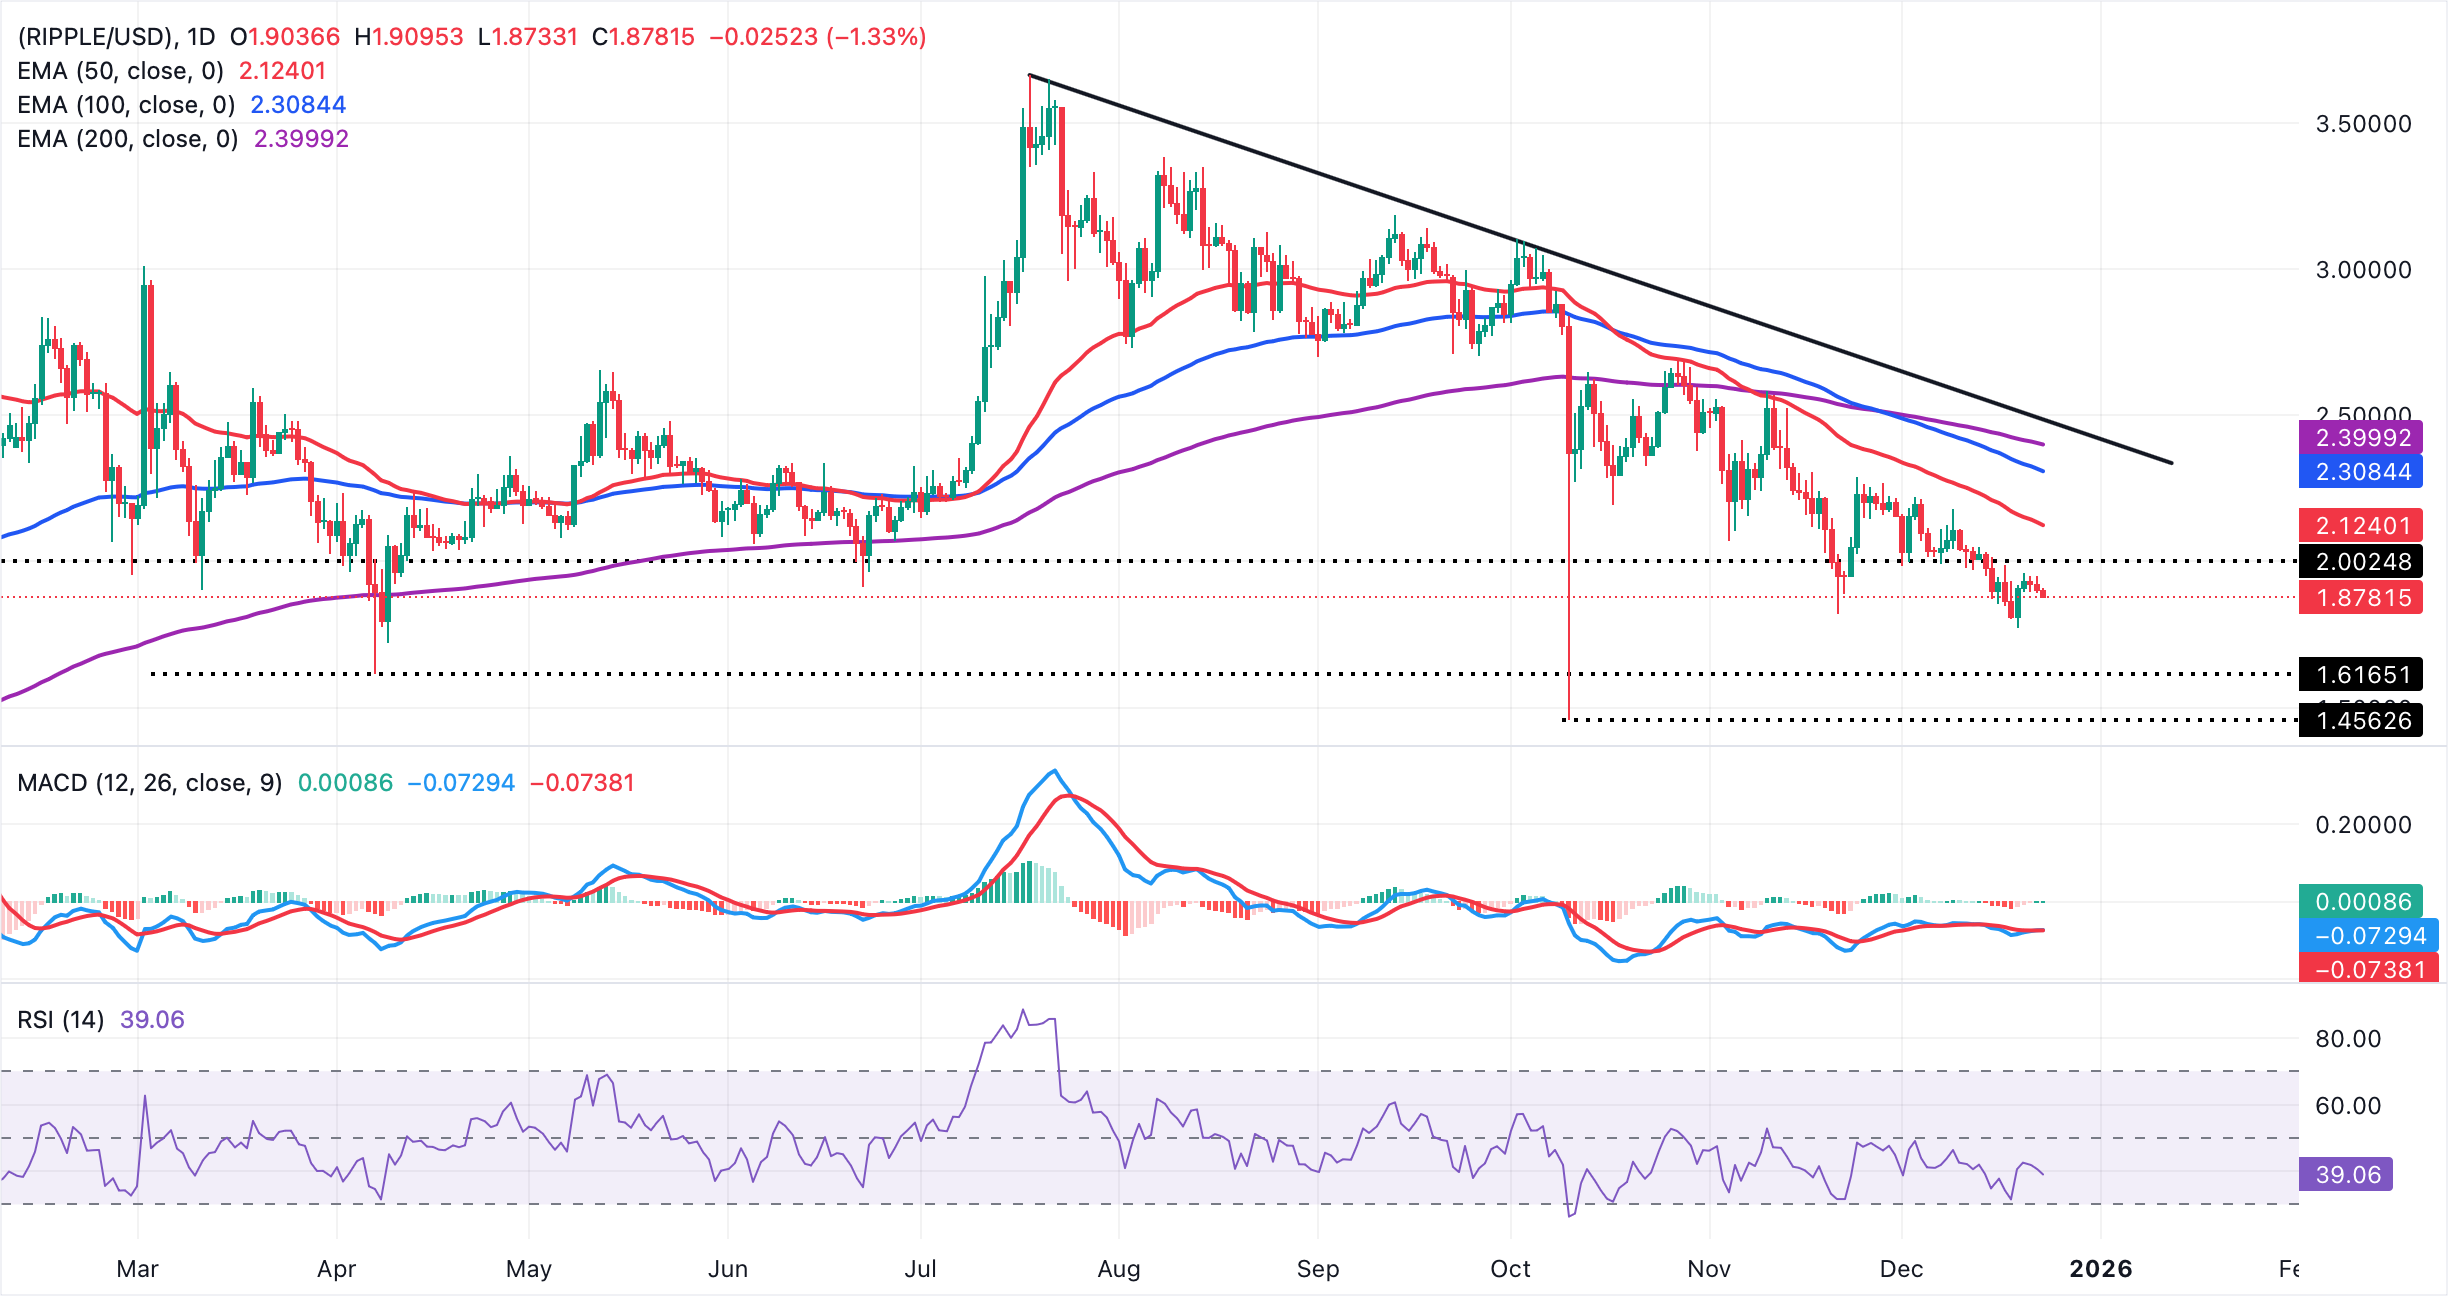
A recovery would need a daily close above the 50-day EMA at $2.12 to ease bearish pressure, opening scope toward the 100-day EMA at $2.31 and the 200-day EMA at $2.40. Failure to reclaim this EMA band would keep the downtrend intact. If the MACD histogram slips back into negative territory, selling pressure could rebuild.
Cryptocurrency metrics FAQs
The developer or creator of each cryptocurrency decides on the total number of tokens that can be minted or issued. Only a certain number of these assets can be minted by mining, staking or other mechanisms. This is defined by the algorithm of the underlying blockchain technology. On the other hand, circulating supply can also be decreased via actions such as burning tokens, or mistakenly sending assets to addresses of other incompatible blockchains.
Market capitalization is the result of multiplying the circulating supply of a certain asset by the asset’s current market value.
Trading volume refers to the total number of tokens for a specific asset that has been transacted or exchanged between buyers and sellers within set trading hours, for example, 24 hours. It is used to gauge market sentiment, this metric combines all volumes on centralized exchanges and decentralized exchanges. Increasing trading volume often denotes the demand for a certain asset as more people are buying and selling the cryptocurrency.
Funding rates are a concept designed to encourage traders to take positions and ensure perpetual contract prices match spot markets. It defines a mechanism by exchanges to ensure that future prices and index prices periodic payments regularly converge. When the funding rate is positive, the price of the perpetual contract is higher than the mark price. This means traders who are bullish and have opened long positions pay traders who are in short positions. On the other hand, a negative funding rate means perpetual prices are below the mark price, and hence traders with short positions pay traders who have opened long positions.
(The technical analysis of this story was written with the help of an AI tool)
Recommended Articles


