


Ethereum ICO Whale Sells 20,000 ETH ($58M), Raising Questions Over Market Timing
Ethereum continues to trade below the critical $3,000 level as selling pressure intensifies and fear dominates sentiment across the crypto market. The broader downturn has pushed ETH nearly 40% below its August all-time high, raising concerns that the asset may be entering a prolonged bearish phase. Analysts who were once confident in a continued rally are now shifting their tone, warning that market structure, volatility, and liquidity conditions are beginning to resemble early-stage bear market behavior.
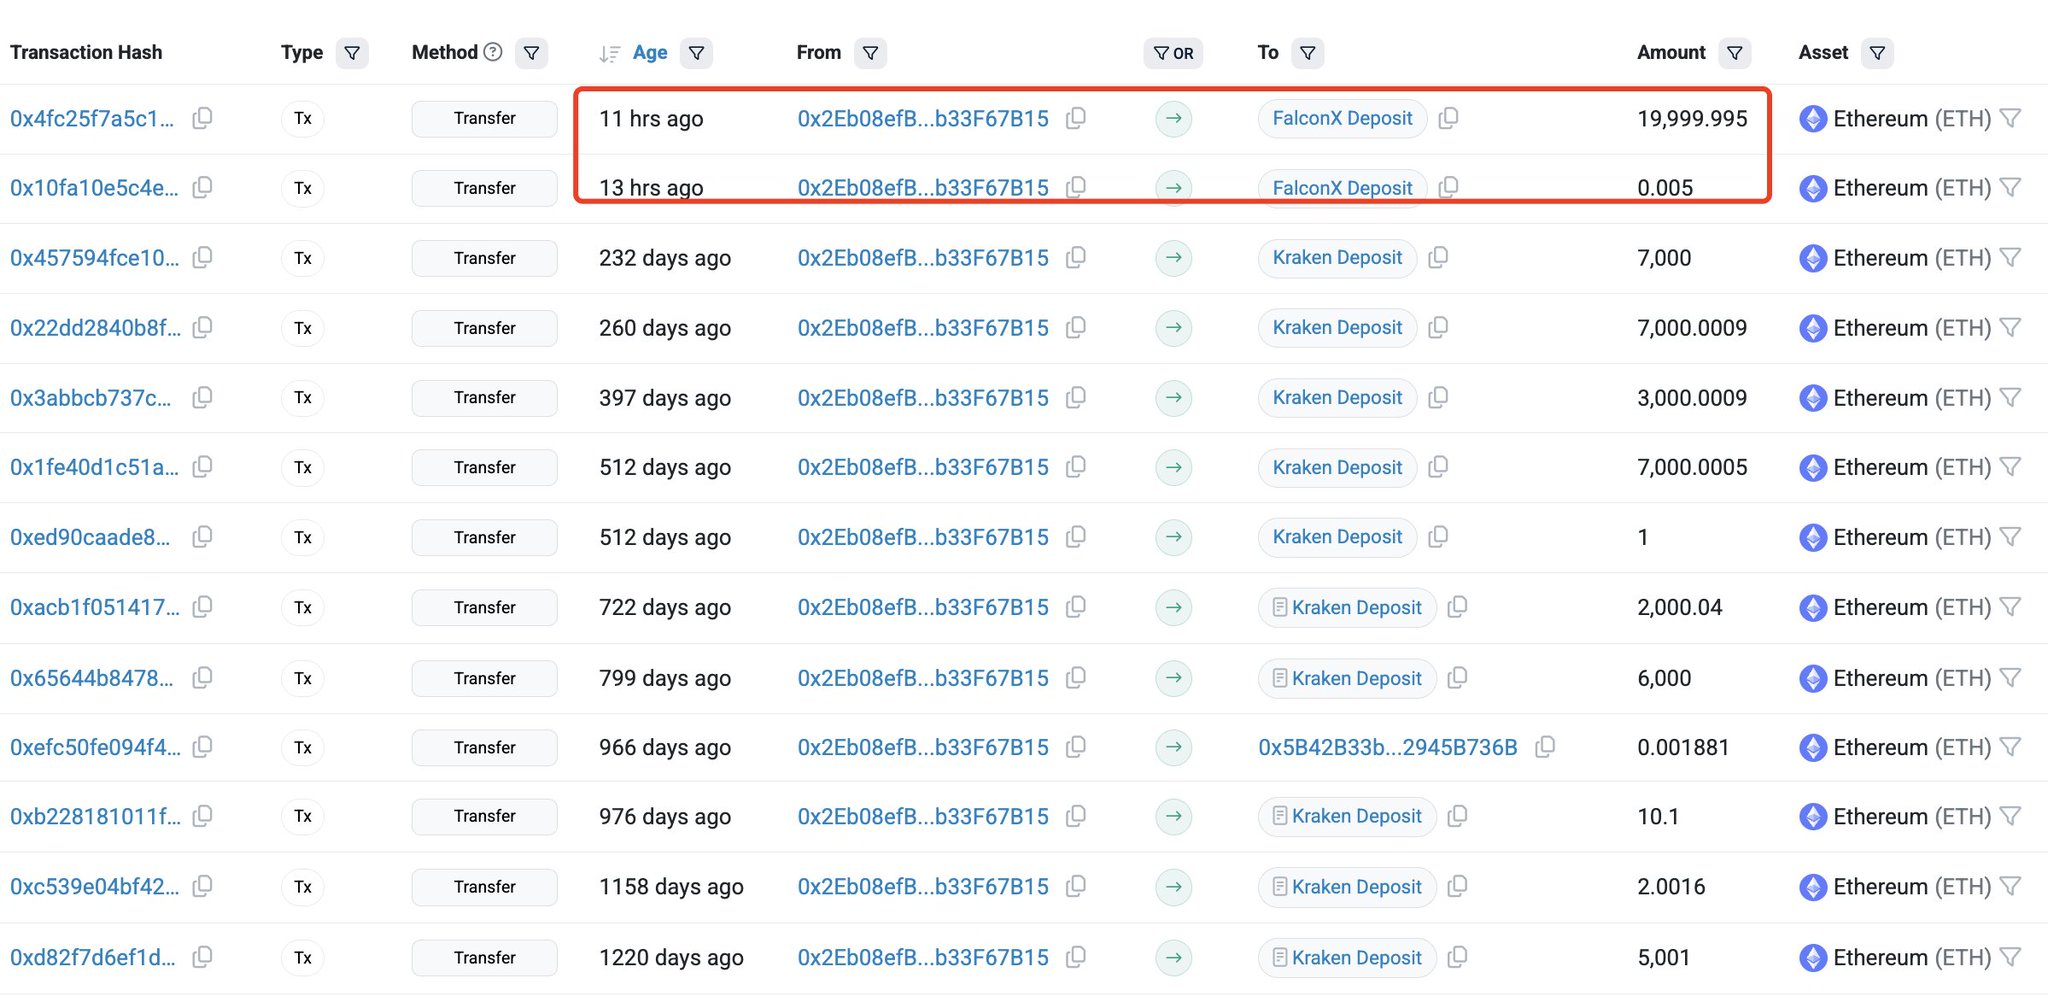
At the same time, investor confidence is being further tested by fresh on-chain activity showing large holders reducing exposure. According to data from Lookonchain, an Ethereum ICO participant has sold another 20,000 ETH, valued at approximately $58.14 million, through FalconX just a few hours ago.
With selling pressure accelerating, derivatives sentiment weakening, and long-term holders beginning to reduce positions, Ethereum now sits at a pivotal moment. Bulls must reclaim the $3,000 region to stabilize momentum, while bears argue that a deeper correction could unfold if support continues to erode.
ICO Whale Selling Raises Pressure as Ethereum Awaits Direction
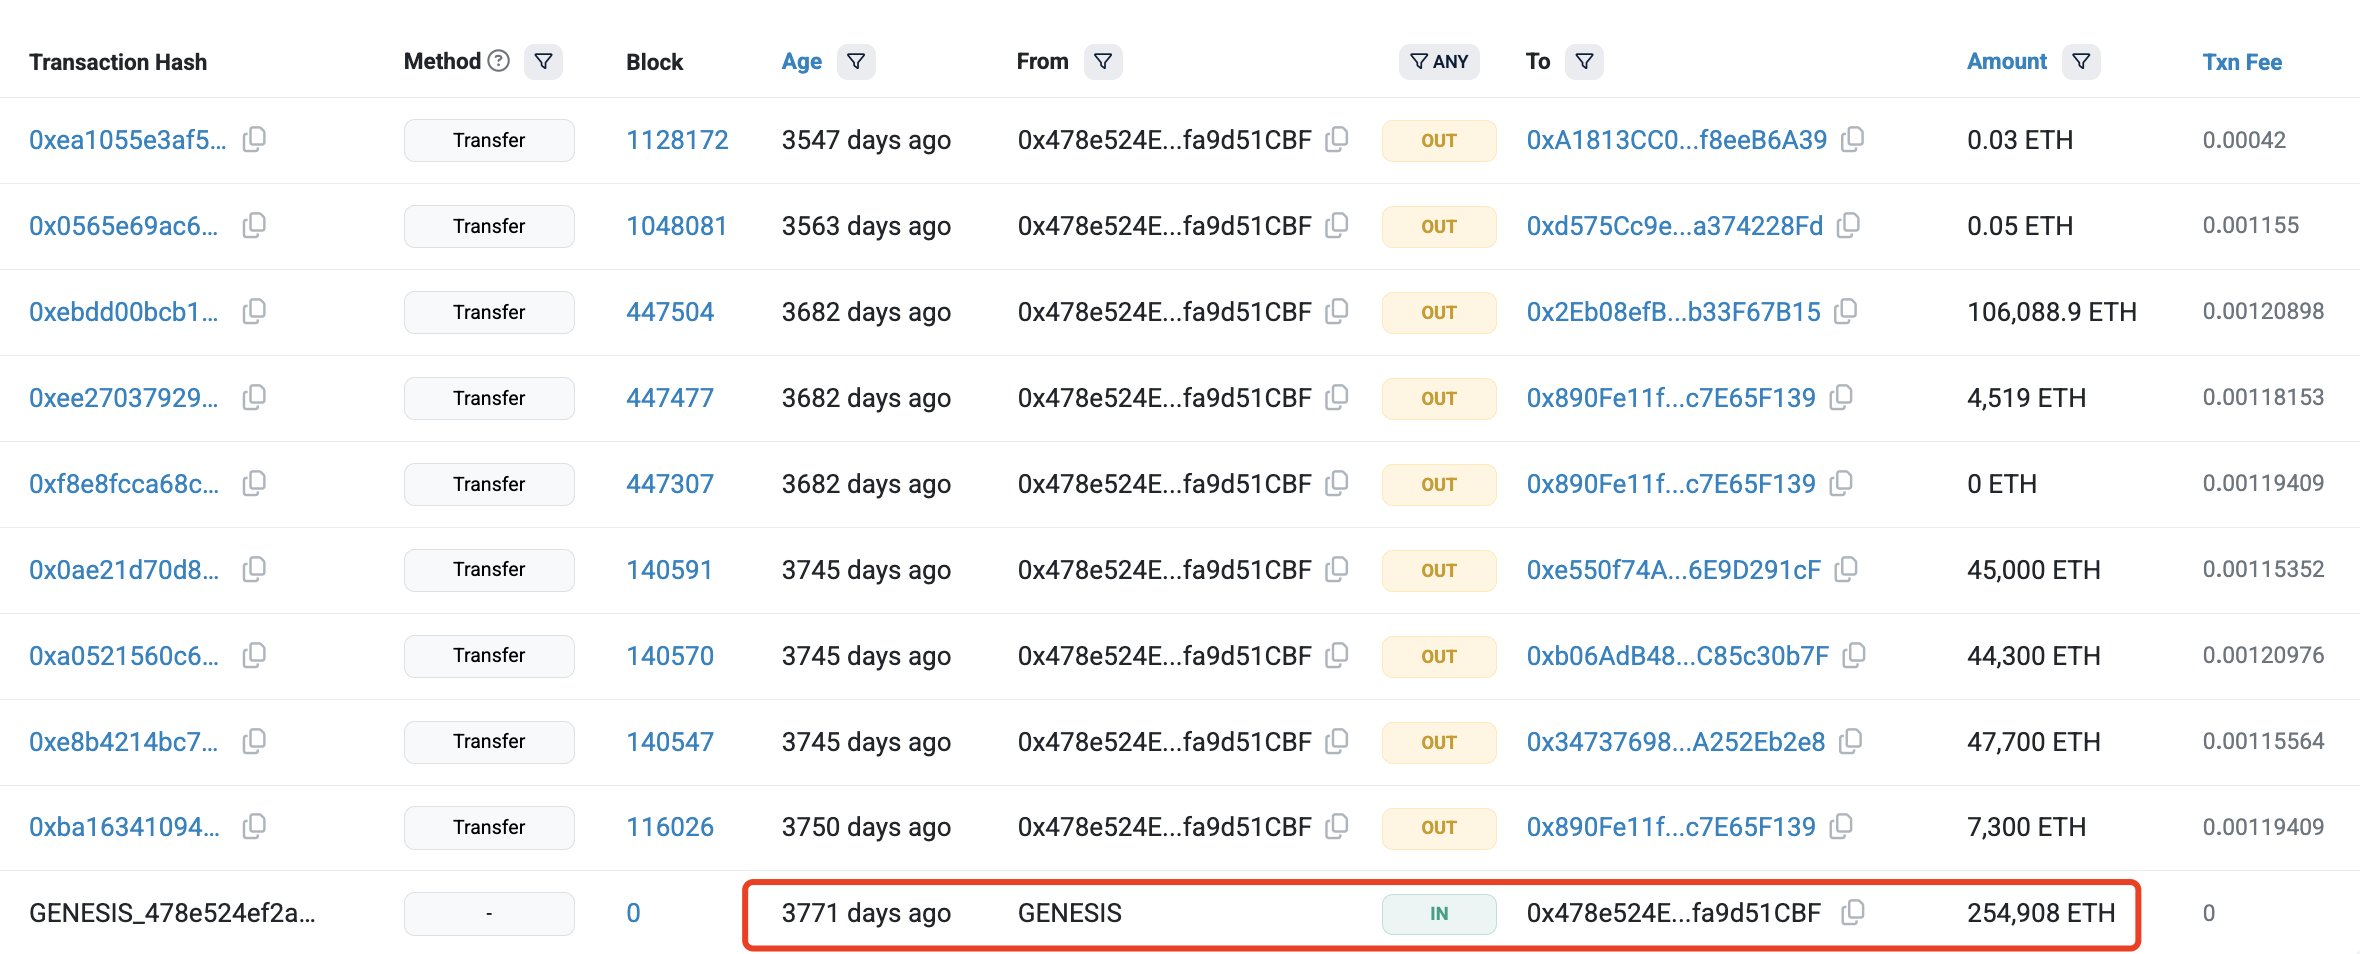
According to Lookonchain, the wallet behind the latest sale — identified as address 0x2eb0 — is no ordinary holder. This Ethereum OG received 254,908 ETH during the ICO, paying just $79,000 at the time. At today’s prices, that allocation is worth roughly $757 million, highlighting the scale of unrealized gains still held by early participants. The recent sale of 20,000 ETH suggests that even long-standing holders with substantial profit cushions are beginning to offload coins, adding to the already fragile market environment.
This selling activity is particularly impactful given the current sentiment. Ethereum has already fallen sharply from its highs, leverage has unwound across derivatives markets, and retail confidence has thinned. When an early participant with a cost basis near zero begins distributing, it sends a psychological signal that further downside is possible. Yet, some analysts argue that these sales may simply represent portfolio rotation rather than a long-term bearish stance.
The coming days will be decisive, as investors watch whether Ethereum can stabilize and rebound or if selling pressure accelerates. A recovery above $3,000 could revive optimism and reset momentum, while continued weakness risks confirming a deeper downtrend for both ETH and the broader market.
Breakdown, Weak Structure, and Fragile Bounce Attempt
Ethereum’s weekly chart reveals a clear deterioration in trend structure following the sharp rejection from the $4,400 region and the subsequent breakdown below the $3,200 support zone. The selloff pushed ETH toward the mid-$2,700s before a modest rebound, but the price remains below key moving averages, signaling that momentum continues to favor sellers.

The 50-week moving average has rolled over, while the 100-week and 200-week moving averages now sit overhead, forming layered resistance that could cap any recovery attempts in the short term.
Volume during the decline expanded noticeably, indicating active distribution rather than passive drifting. The most recent candle shows a small bounce, but with no strong volume follow-through, suggesting hesitation and lack of conviction among buyers.
For Ethereum to regain bullish structure, reclaiming the $3,000–$3,200 area is essential, as this zone acted as a pivotal support throughout earlier phases of the cycle and now threatens to flip into resistance.
Featured image from ChatGPT, chart from TradingView.com
Recommended Articles


