


Ripple Price Forecast: XRP trades under strong bearish grip despite steady ETF inflows
- XRP declines for the second consecutive day, as the crypto market struggles to sustain recovery.
- XRP ETFs record steady inflows, but sentiment remains lagging.
- A weak derivatives market, as reflected by Open Interest remaining below $4 billion, underlines risk-off sentiment.
Ripple (XRP) is extending its decline, trading at $2.17 at the time of writing on Wednesday. The cross-border remittance token was rejected at $2.30 on Monday, reflecting a sticky bearish sentiment in the broader cryptocurrency market despite steady inflows into Exchange Traded Funds (ETFs).
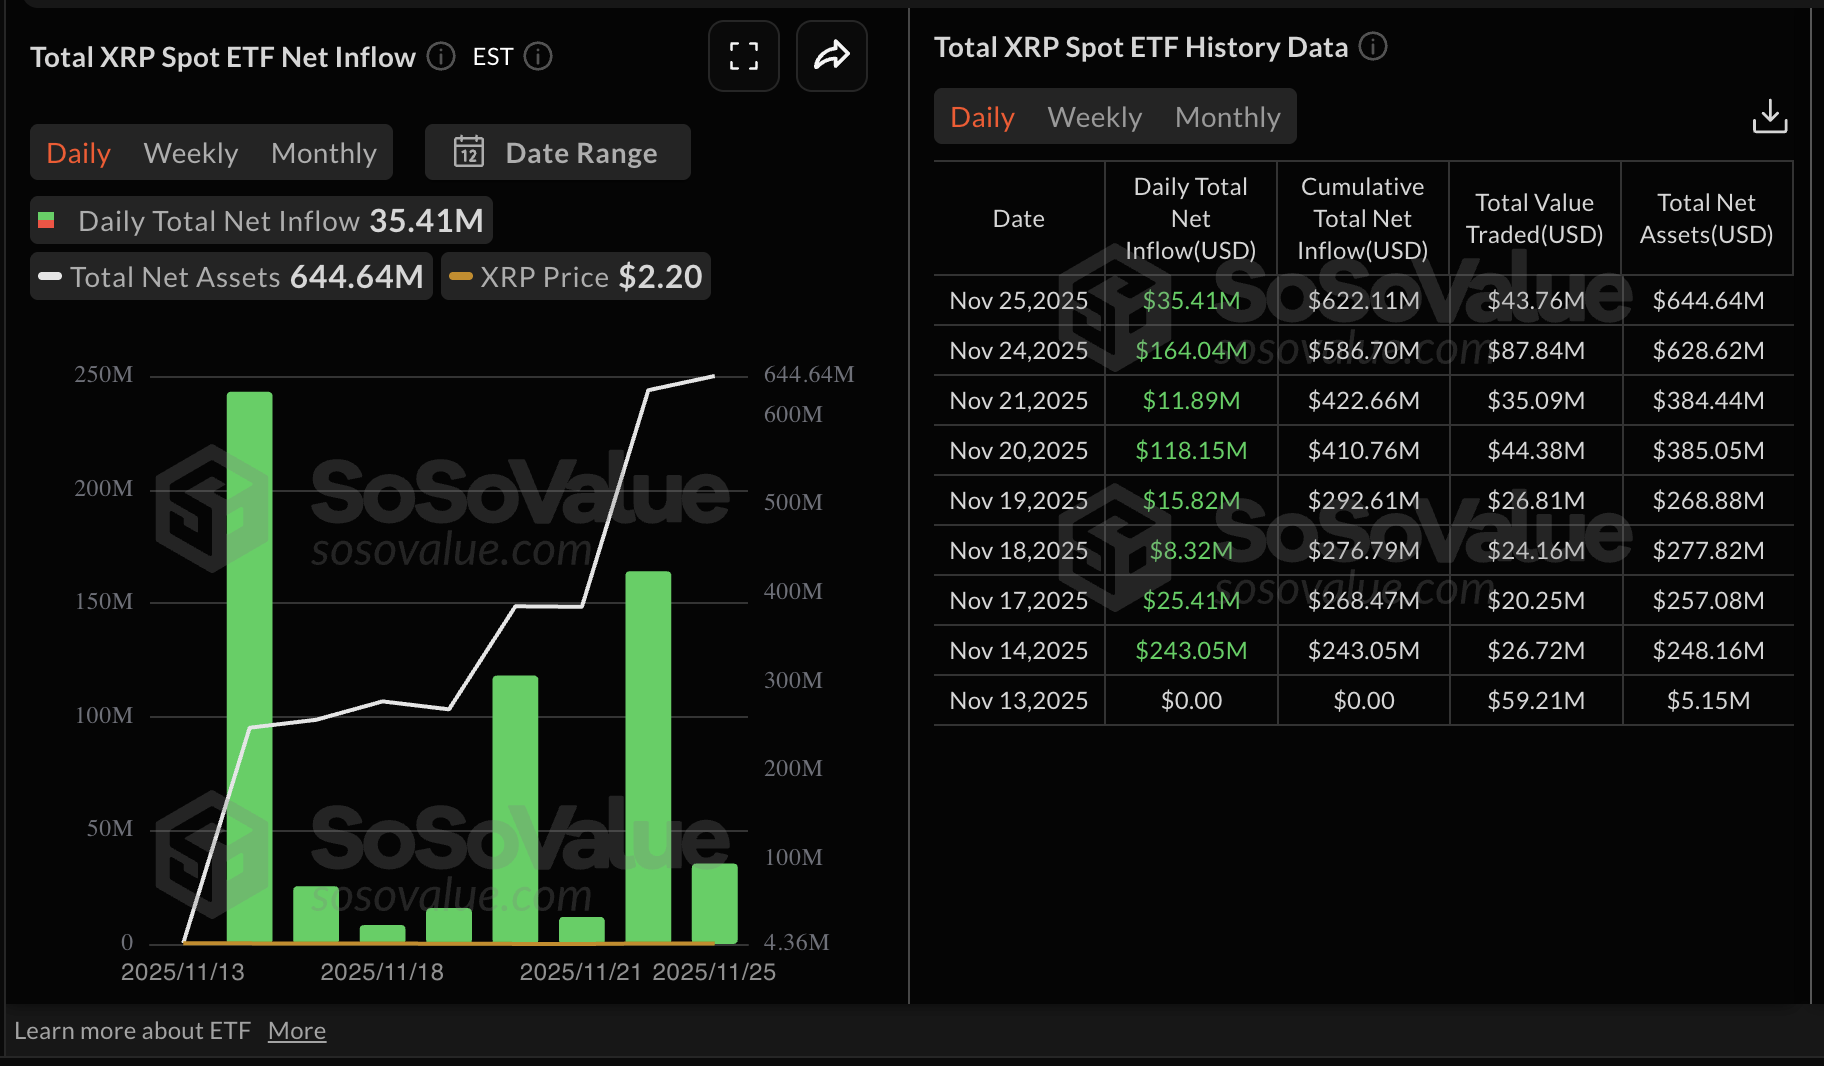
XRP ETF inflows extend as institutional demand steadies
Interest in US-listed XRP ETFs has continued to improve since their initial launch in mid-November. There are currently four XRP ETFs operating in the US, including Canary Capital’s XRPC, Bitwise’s XRP, Grayscale’s GXRP and Franklin Templeton’s XRPZ.
In total, XRP ETFs recorded approximately $35 million in inflows on Tuesday, bringing the cumulative volume to $622 million and net assets to $645 million.
ETF flows help gauge market sentiment, whereby inflows underpin a bullish market, while outflows signal a bearish outlook.
Retail demand, on the other hand, has remained relatively low, with futures Open Interest (OI) unable to steady above $4 billion since November 11. According to CoinGlass data, OI, which tracks the notional value of outstanding futures contracts, averaged $3.96 billion on Wednesday, down from $4 billion the previous day.
XRP futures OI hit a record high of $10.94 billion on July 22, days before the token achieved a record high of $3.66. This highlighted growing risk appetite for XRP derivatives and backed risk-on sentiment.
However, a steady decline in the OI has coincided with the price falling to $1.82 on Friday. If retail demand remains suppressed, it would be difficult to sustain recovery, with XRP likely to trade under pressure.
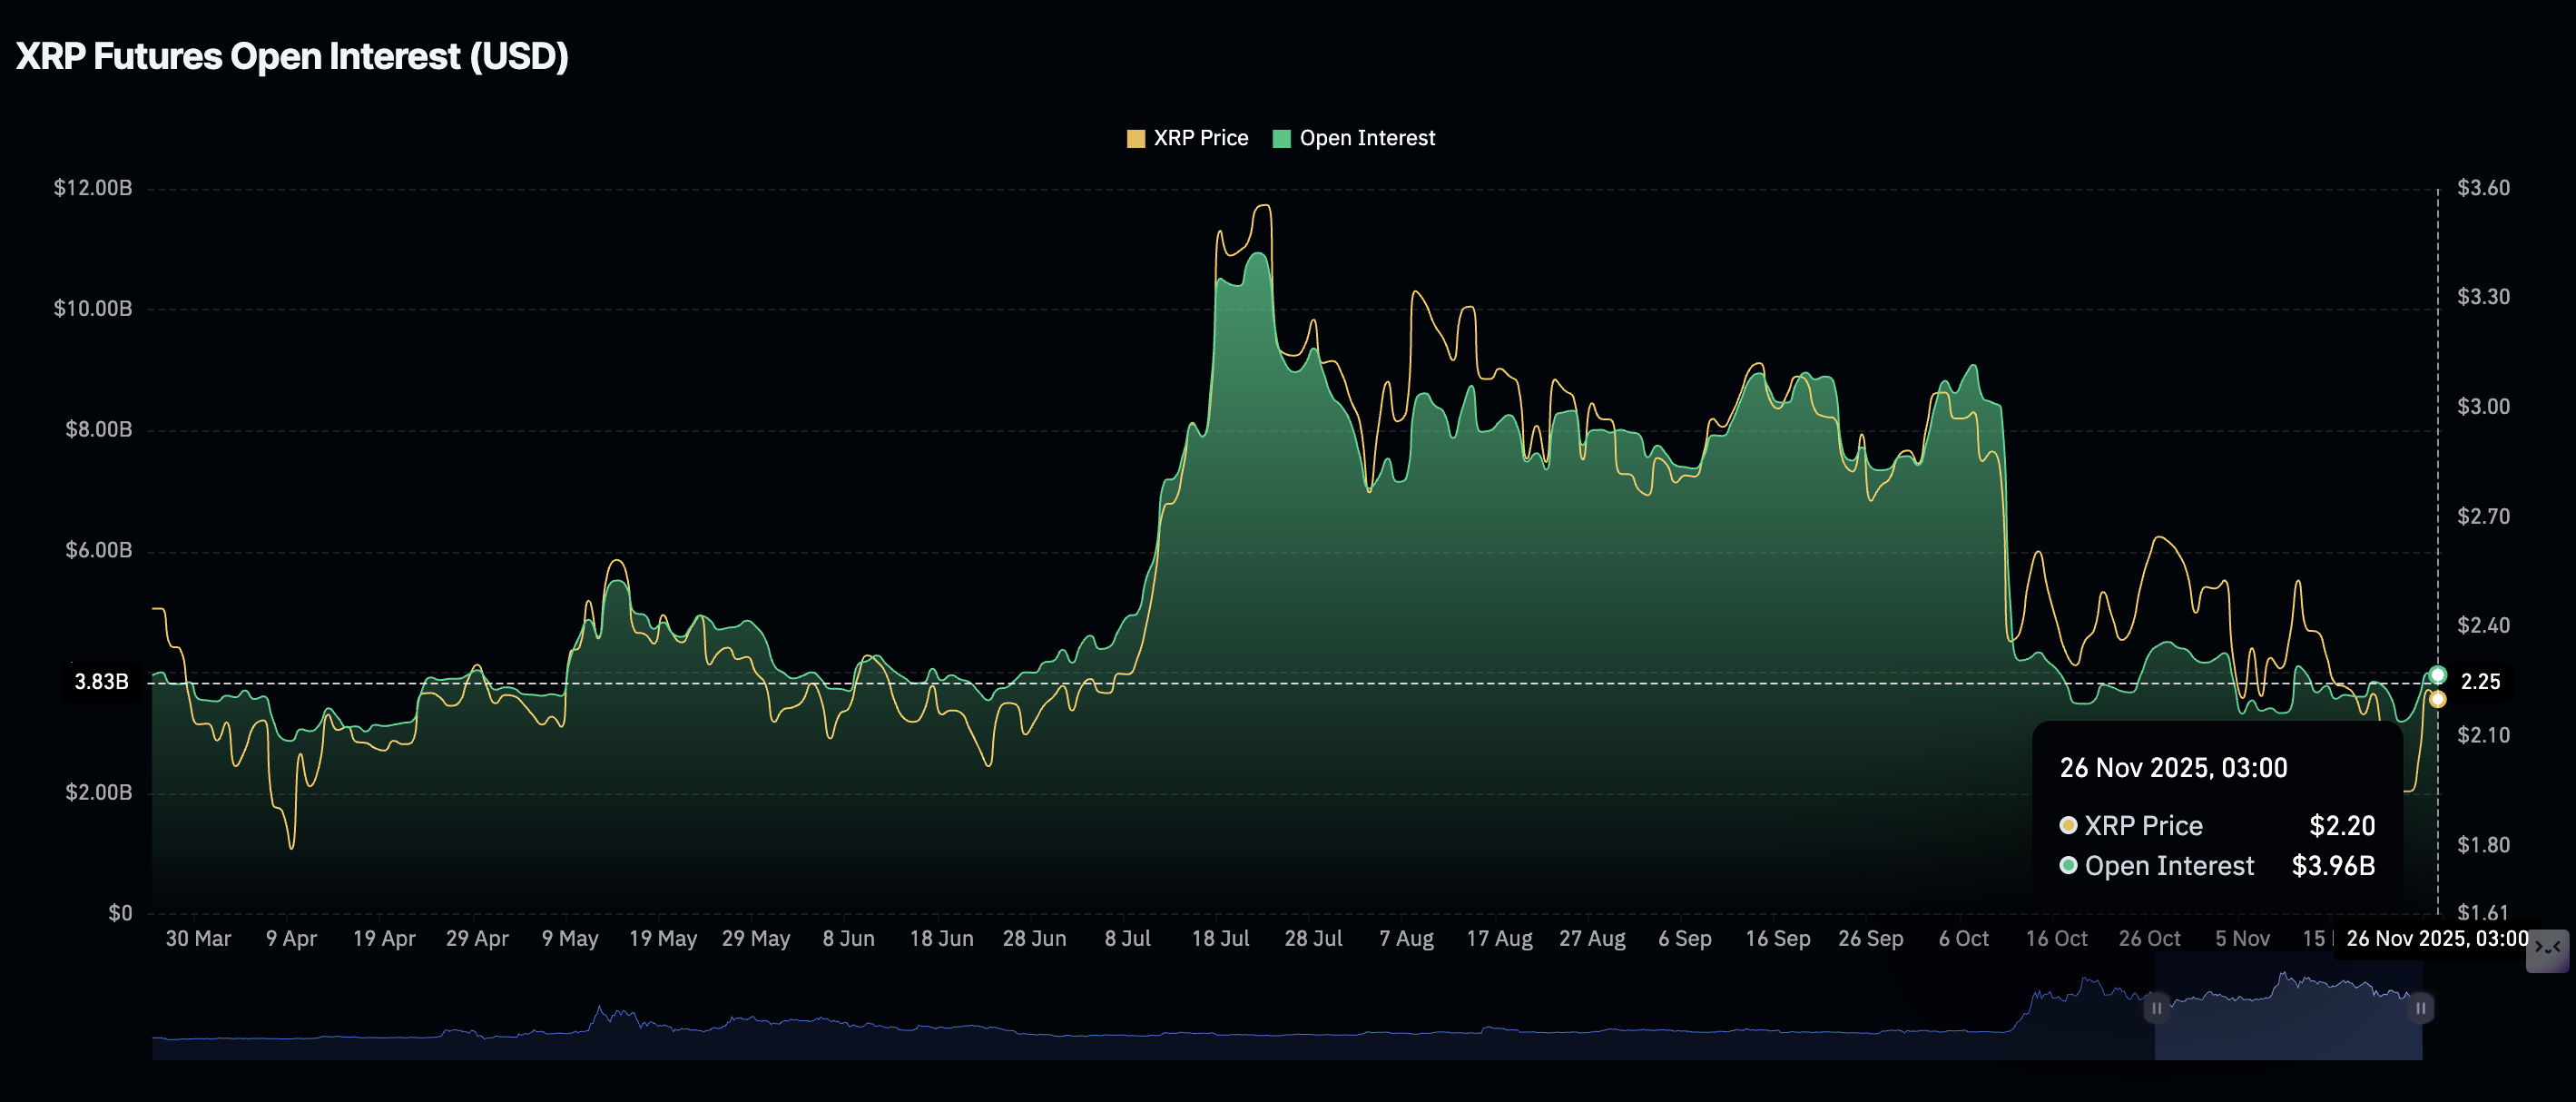
Chart of the day: XRP offers mixed signals
XRP remains capped below the 50-day Exponential Moving Average (EMA) EMA at $2.37, underscoring a continuous downward slope. The descending trend line from the record high of $3.66 limits rebounds on the daily chart, with resistance seen at $2.68.
The Moving Average Convergence Divergence (MACD) histogram has turned positive and is expanding, suggesting the MACD line has crossed above the signal line. This outlook could sustain a bullish tone in the short to medium term.
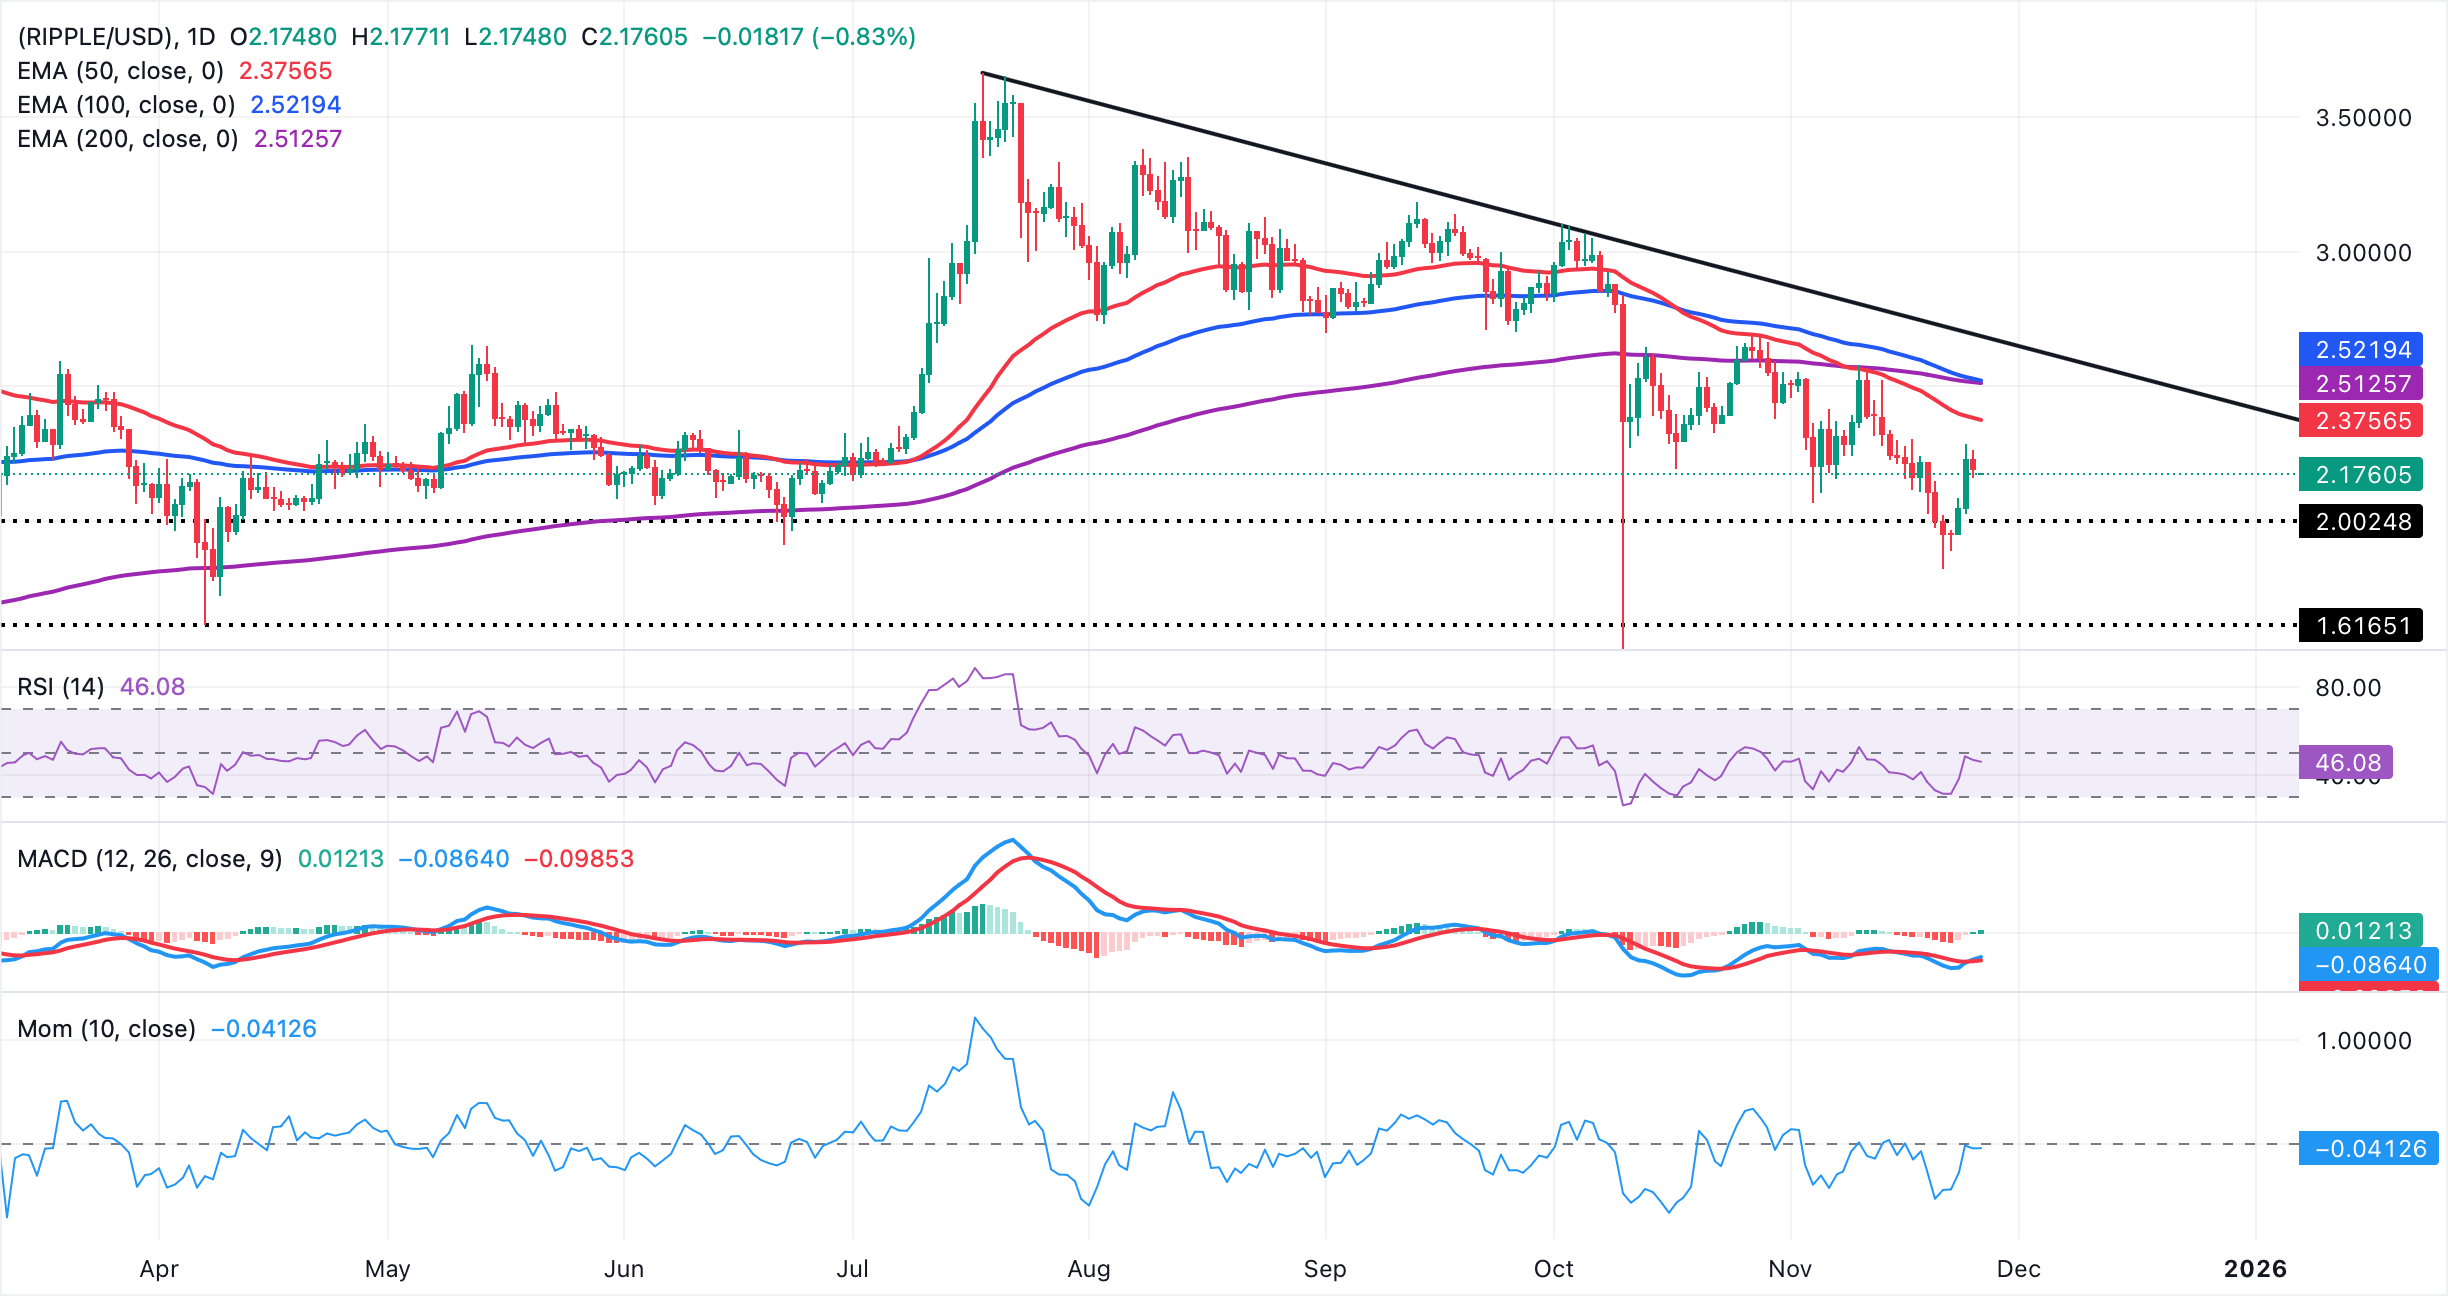
Still, the Relative Strength Index (RSI) at 46 leans neutral-to-soft, keeping upside efforts in check. The broader setup stays heavy while price trades beneath the 200-day EMA at $2.51 and the 100-day EMA at $2.52. Momentum holds below the zero line and flattens, indicating fading bearish pressure rather than a directional turn. A bounce would encounter supply into the 50-day EMA, while a daily close above the same level would open a recovery phase.
Open Interest, funding rate FAQs
Higher Open Interest is associated with higher liquidity and new capital inflow to the market. This is considered the equivalent of increase in efficiency and the ongoing trend continues. When Open Interest decreases, it is considered a sign of liquidation in the market, investors are leaving and the overall demand for an asset is on a decline, fueling a bearish sentiment among investors.
Funding fees bridge the difference between spot prices and prices of futures contracts of an asset by increasing liquidation risks faced by traders. A consistently high and positive funding rate implies there is a bullish sentiment among market participants and there is an expectation of a price hike. A consistently negative funding rate for an asset implies a bearish sentiment, indicating that traders expect the cryptocurrency’s price to fall and a bearish trend reversal is likely to occur.
(The technical analysis of this story was written with the help of an AI tool)
Recommended Articles


