Bitcoin To $40,000? Signal Behind Past 60% Crashes Is Back

Source Newsbtc

A cryptocurrency analyst has pointed out how a technical analysis (TA) signal that led into major price declines in the past has returned for Bitcoin.

Monthly MACD Has Turned Bearish For Bitcoin

In a new post on X, analyst Ali Martinez has talked about a signal that has formed in the Moving Average Convergence/Divergence (MACD) for Bitcoin. MACD is a TA indicator that’s generally used for timing buys and sells in an asset’s price chart.

The indicator consists of two lines: MACD line and signal line. The first of these, the MACD line, is found by subtracting the 26-period exponential moving average (EMA) of the price from its 12-period EMA. The signal line tracks the 9-period EMA of this difference.

Crossovers between the two lines can provide buy or sell signals for the asset. The MACD line breaking above the signal line could be considered a bullish signal, while the reverse type of crossover a bearish one.

Now, here is the chart shared by Martinez that shows how the monthly MACD has changed for Bitcoin over the last several years:

Bitcoin MACD

As displayed in the above graph, the Bitcoin MACD has registered a crossover recently. The MACD line has plunged as the asset has witnessed its bearish momentum and it’s now sitting under the signal line.

As mentioned earlier, such a signal can be a bearish one. In the chart, the analyst has highlighted the past instances of this pattern. It would appear that the last three sell signals from the indicator all led into declines of more than 60% for the cryptocurrency.

“If that repeats, the chart points to $40,000,” noted Martinez. It now remains to be seen whether the MACD will hold for Bitcoin, or if a different trend from the past will follow this time around.

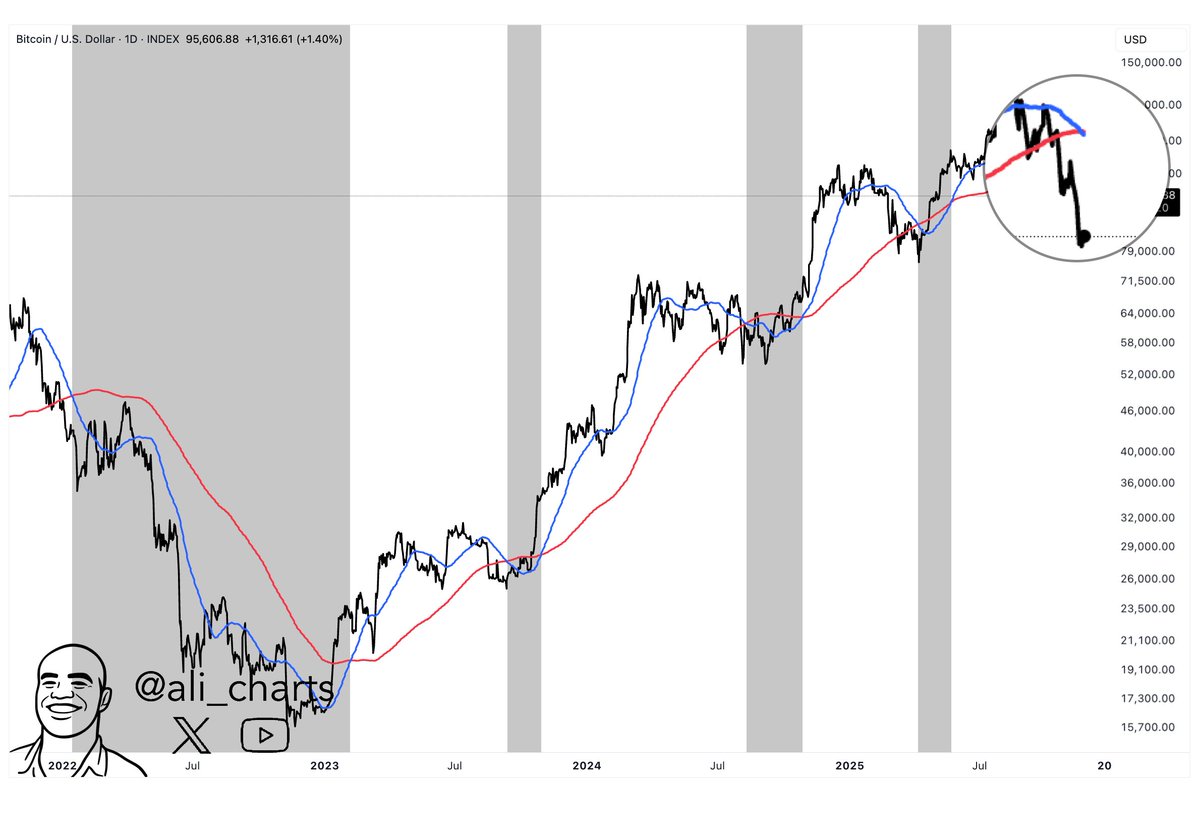
The MACD line falling under its signal line isn’t the only bearish crossover that BTC has faced recently. As the analyst has pointed out in another X post, a classic death cross has also appeared between the asset’s 50-day simple moving average (SMA) and 200-day SMA.
Bitcoin Death Cross

From the chart, it’s apparent that the 50-day SMA has declined below the 200-day SMA alongside the latest Bitcoin market downturn. During the past couple of years, each such signal has marked local bottoms for BTC, but in 2022, this crossover kicked off the bear market.

So far since the death cross has appeared, the asset has continued to decline, a potential sign that this death cross may be different from the recent ones.

BTC Price

At the time of writing, Bitcoin is floating around $88,800, down over 4% in the last seven days.

Bitcoin Price Chart
Disclaimer: For information purposes only. Past performance is not indicative of future results.
placeholder
Bitcoin Breaks Below $92,000 as Traders Debate Whether 4-Year Cycle Pattern Is Driving Sell-OffBitcoin (BTC-USD) extended its losses on Monday, slipping below the $92,000 mark and pushing its decline from October’s all-time high to more than 26%. The ongoing downturn has reignited a key debate among traders: Is this a short-term correction, or the start of a prolonged bear market driven by Bitcoin’s historical four-year cycle?
Author  Mitrade
Nov 18, Tue
Bitcoin (BTC-USD) extended its losses on Monday, slipping below the $92,000 mark and pushing its decline from October’s all-time high to more than 26%. The ongoing downturn has reignited a key debate among traders: Is this a short-term correction, or the start of a prolonged bear market driven by Bitcoin’s historical four-year cycle?
placeholder
U.S. Job Growth Surprises, Sparking Cautious Market Optimism on Rate CutsThe September nonfarm payrolls report revealed strong job growth but rising unemployment, leaving investors uncertain about December rate cuts. Bank of America forecasts limited scope for further Fed easing amidst labor market shifts.
Author  Mitrade
Yesterday 01: 59
The September nonfarm payrolls report revealed strong job growth but rising unemployment, leaving investors uncertain about December rate cuts. Bank of America forecasts limited scope for further Fed easing amidst labor market shifts.
placeholder
Bitcoin Posts Longest Weekly Losing Run Since 2024, Rebounds Cautiously as Fed Outlook ShiftsBitcoin has recorded its fourth straight week of declines, marking the longest sustained downturn since June 2024, though prices have begun to stabilize in recent sessions.
Author  Mitrade
Yesterday 06: 03
Bitcoin has recorded its fourth straight week of declines, marking the longest sustained downturn since June 2024, though prices have begun to stabilize in recent sessions.
placeholder
US Dollar's Decline Predicted in 2026: Morgan Stanley's Outlook on Currency VolatilityMorgan Stanley forecasts a 5% drop in the dollar by mid-2026, attributed to continued Fed rate cuts. A recovery may follow as growth improves and funding currency dynamics shift favorably toward the euro and Swiss franc.
Author  Mitrade
12 hours ago
Morgan Stanley forecasts a 5% drop in the dollar by mid-2026, attributed to continued Fed rate cuts. A recovery may follow as growth improves and funding currency dynamics shift favorably toward the euro and Swiss franc.
placeholder
Nvidia Shares Slip as Google's AI Chips Gain Ground with Meta Deal TalksNvidia shares declined Tuesday following a report that Meta Platforms is in advanced talks to spend billions on Google's tensor processing units (TPUs), signaling the search giant's growing momentum in the competitive AI accelerator market.
Author  Mitrade
8 hours ago
Nvidia shares declined Tuesday following a report that Meta Platforms is in advanced talks to spend billions on Google's tensor processing units (TPUs), signaling the search giant's growing momentum in the competitive AI accelerator market.
goTop
quote