Stellar Price Forecast: XLM eyes breakout as TVL hits record $169 million

Source Fxstreet
  • Stellar price nears its key resistance at $0.256 on Tuesday after gaining over 10% in the last two days.
  • On-chain data paints a bullish picture, with XLM’s TVL reaching a record $169.3 million, reflecting growing ecosystem activity.
  • The technical outlooks suggest upside if XLM closes above the $0.256 resistance zone.

Stellar (XLM) price is approaching its key resistance level around $0.256 at the time of writing on Tuesday, after gaining over 10% in the previous two days. Meanwhile, the network’s Total Value Locked (TVL) has climbed to a record high, highlighting growing ecosystem activity and bolstering bullish sentiment. On the technical side, if XLM closes above $0.256 resistance zone, it could trigger a further upside rally.

Stellar’s TVL hits a new record high 

Data from crypto intelligence tracker DefiLlama shows that XLM’s TVL has reached a new all-time high (ATH) of $169.30 million on Tuesday. This increase in TVL indicates growing activity and interest in Stellar’s ecosystem, suggesting that more users are depositing or using assets on XLM-based protocols, which aligns with XLM's price performance.
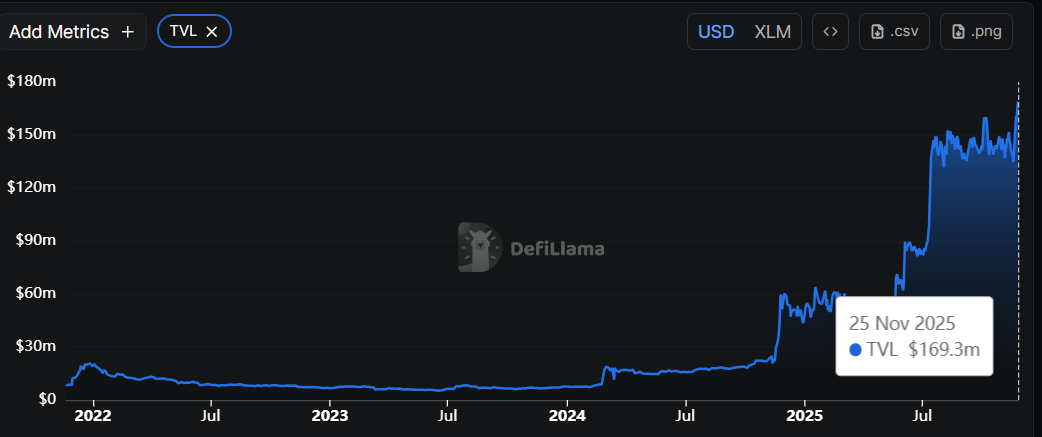
XLM TVL chart. Source: DefiLlama

Additionally, CryptoQuant’s summary data also supports the positive outlook, as XLM’s spot and futures markets show large whale orders and buy dominance, signaling a potential rally ahead.
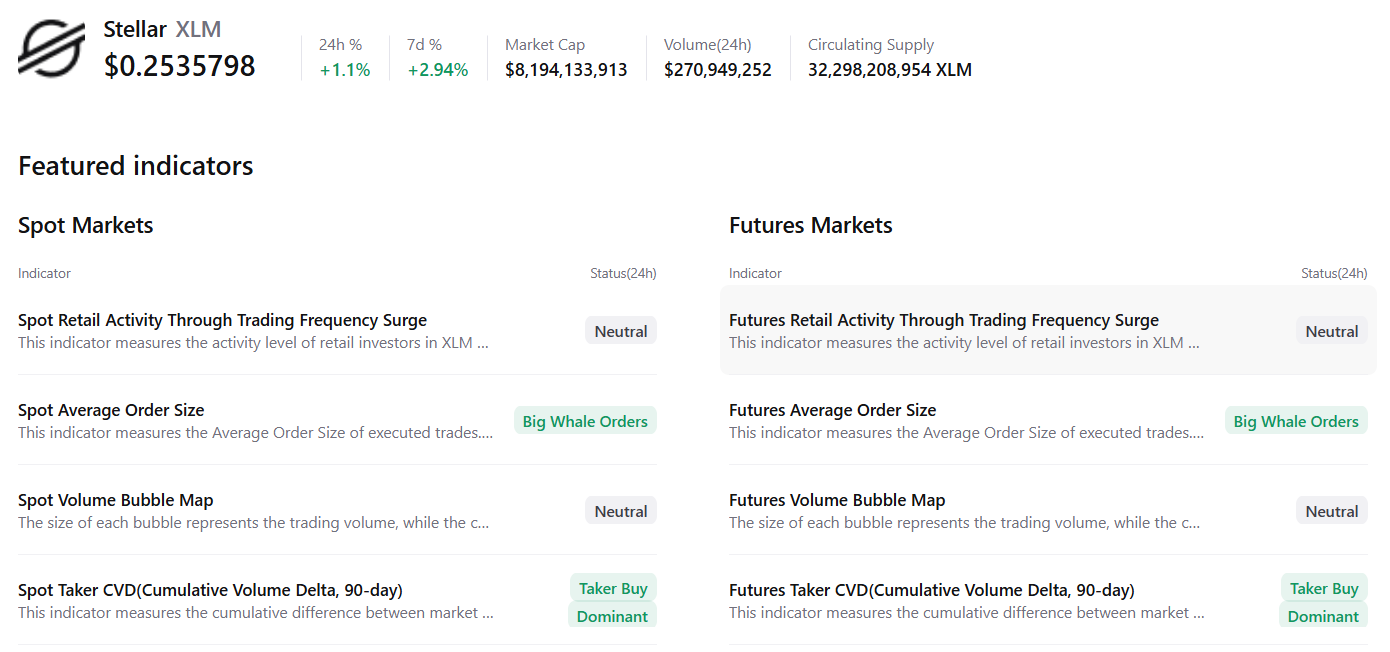
Stellar Price Forecast: XLM bulls aiming for a breakout

Stellar price retested and found support around the weekly support level at $0.221 on Friday, and rose over 10% in the next three days. At the time of writing on Tuesday, XLM is nearing the 38.20% Fibonacci retracement level (drawn from the October 6 high of $0.413 to the October 10 low of $0.160 ) at $0.256, which also coincides with the upper trendline of the falling wedge pattern, making a key resistance zone to watch.

If XLM breaks and closes above the $0.256 resistance level on a daily basis, it could extend the rally toward the 50-day Exponential Moving Average (EMA) at $0.292. 

The Relative Strength Index (RSI) on the daily chart is 42, pointing upward toward the neutral 50 level, indicating fading bearish momentum. For the recovery rally to be sustained, the RSI must move above the neutral level. Additionally, the Moving Average Convergence Divergence (MACD) showed a bullish crossover on Monday, providing a buy signal and further supporting the bullish thesis.
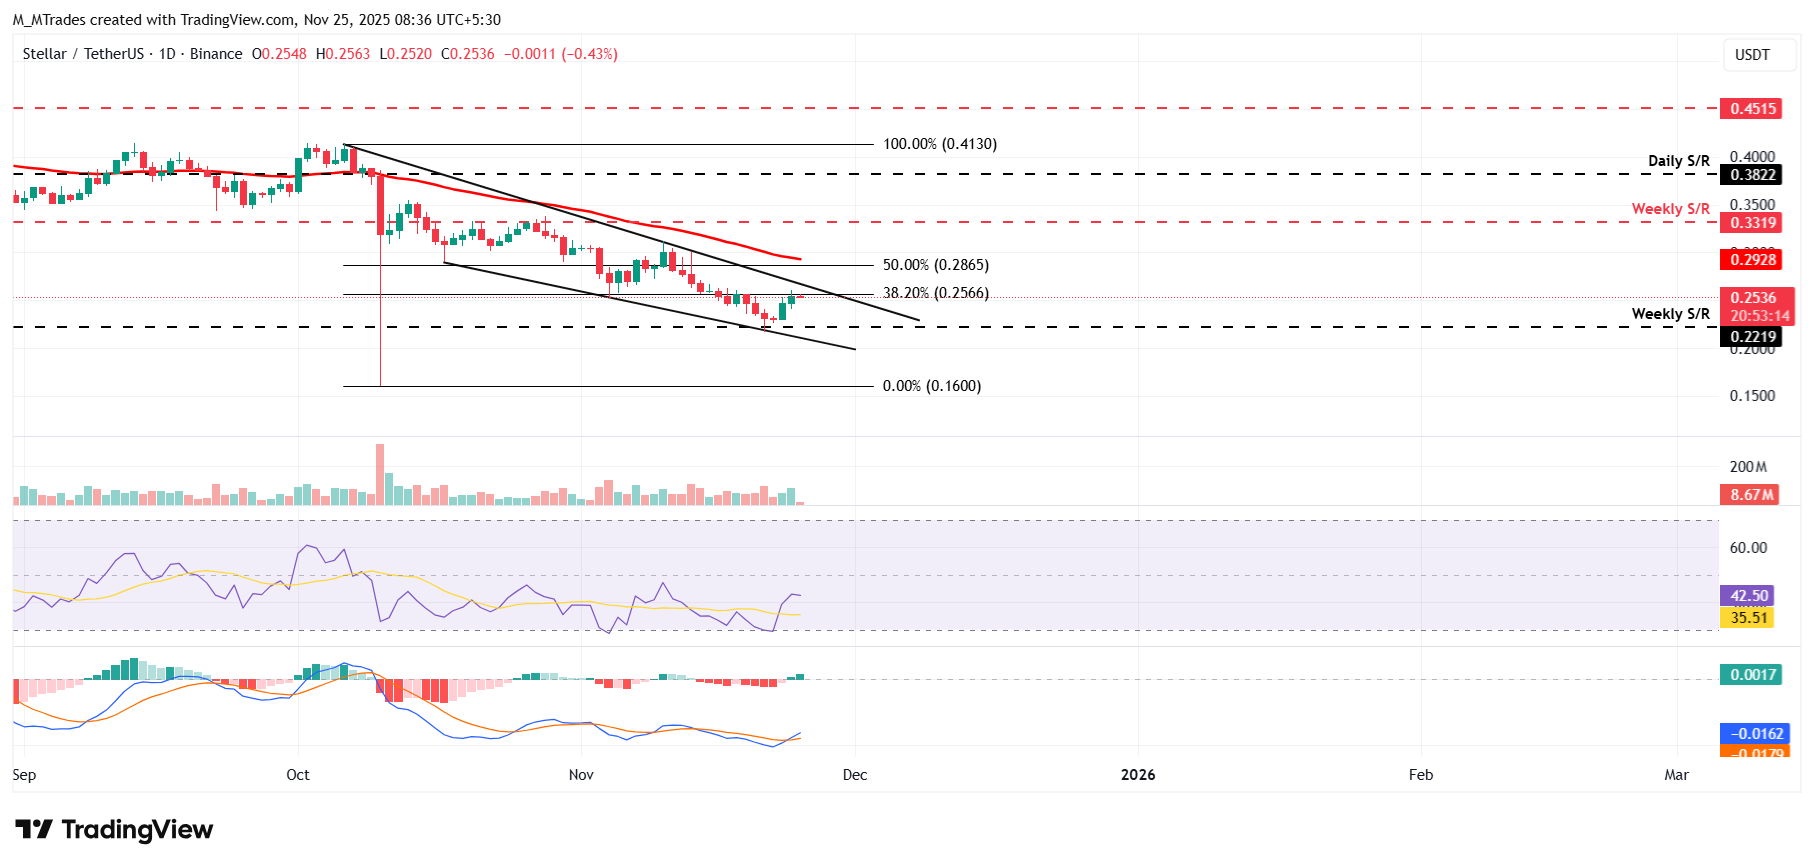
XLM/USDT daily chart

On the other hand, if XLM faces a correction, it could extend the decline toward the weekly support level at $0.221.

Disclaimer: For information purposes only. Past performance is not indicative of future results.
placeholder
Bitcoin Breaks Below $92,000 as Traders Debate Whether 4-Year Cycle Pattern Is Driving Sell-OffBitcoin (BTC-USD) extended its losses on Monday, slipping below the $92,000 mark and pushing its decline from October’s all-time high to more than 26%. The ongoing downturn has reignited a key debate among traders: Is this a short-term correction, or the start of a prolonged bear market driven by Bitcoin’s historical four-year cycle?
Author  Mitrade
Nov 18, Tue
Bitcoin (BTC-USD) extended its losses on Monday, slipping below the $92,000 mark and pushing its decline from October’s all-time high to more than 26%. The ongoing downturn has reignited a key debate among traders: Is this a short-term correction, or the start of a prolonged bear market driven by Bitcoin’s historical four-year cycle?
placeholder
U.S. Job Growth Surprises, Sparking Cautious Market Optimism on Rate CutsThe September nonfarm payrolls report revealed strong job growth but rising unemployment, leaving investors uncertain about December rate cuts. Bank of America forecasts limited scope for further Fed easing amidst labor market shifts.
Author  Mitrade
Yesterday 01: 59
The September nonfarm payrolls report revealed strong job growth but rising unemployment, leaving investors uncertain about December rate cuts. Bank of America forecasts limited scope for further Fed easing amidst labor market shifts.
placeholder
Bitcoin Posts Longest Weekly Losing Run Since 2024, Rebounds Cautiously as Fed Outlook ShiftsBitcoin has recorded its fourth straight week of declines, marking the longest sustained downturn since June 2024, though prices have begun to stabilize in recent sessions.
Author  Mitrade
Yesterday 06: 03
Bitcoin has recorded its fourth straight week of declines, marking the longest sustained downturn since June 2024, though prices have begun to stabilize in recent sessions.
placeholder
US Dollar's Decline Predicted in 2026: Morgan Stanley's Outlook on Currency VolatilityMorgan Stanley forecasts a 5% drop in the dollar by mid-2026, attributed to continued Fed rate cuts. A recovery may follow as growth improves and funding currency dynamics shift favorably toward the euro and Swiss franc.
Author  Mitrade
6 hours ago
Morgan Stanley forecasts a 5% drop in the dollar by mid-2026, attributed to continued Fed rate cuts. A recovery may follow as growth improves and funding currency dynamics shift favorably toward the euro and Swiss franc.
placeholder
Nvidia Shares Slip as Google's AI Chips Gain Ground with Meta Deal TalksNvidia shares declined Tuesday following a report that Meta Platforms is in advanced talks to spend billions on Google's tensor processing units (TPUs), signaling the search giant's growing momentum in the competitive AI accelerator market.
Author  Mitrade
1 hour ago
Nvidia shares declined Tuesday following a report that Meta Platforms is in advanced talks to spend billions on Google's tensor processing units (TPUs), signaling the search giant's growing momentum in the competitive AI accelerator market.
goTop
quote