


HBAR Dips 8% — More Pain Ahead, or Can Bulls Still ‘Squeeze’ Out Gains?
HBAR trades near $0.134, down almost 8% today, underperforming a crypto market that is down about 6%. The broader trend is still weak, with the HBAR price losing nearly 50% over the past three months.
It sits again on the same support we highlighted recently. If this level breaks, the downtrend continues. If it holds, the next move could surprise traders leaning heavily to one side.
Volume Weakness Deepens After a Fresh Breakdown
The first concern comes from spot volume. On Balance Volume (OBV) shows whether coins are being bought or sold based on volume flow. Rising OBV shows demand, falling OBV shows pressure.
HBAR just broke below its descending OBV trend line, the line connecting a series of lower lows in the short-term. Breaking under this confirms fresh weakness. The long-term picture is worse.
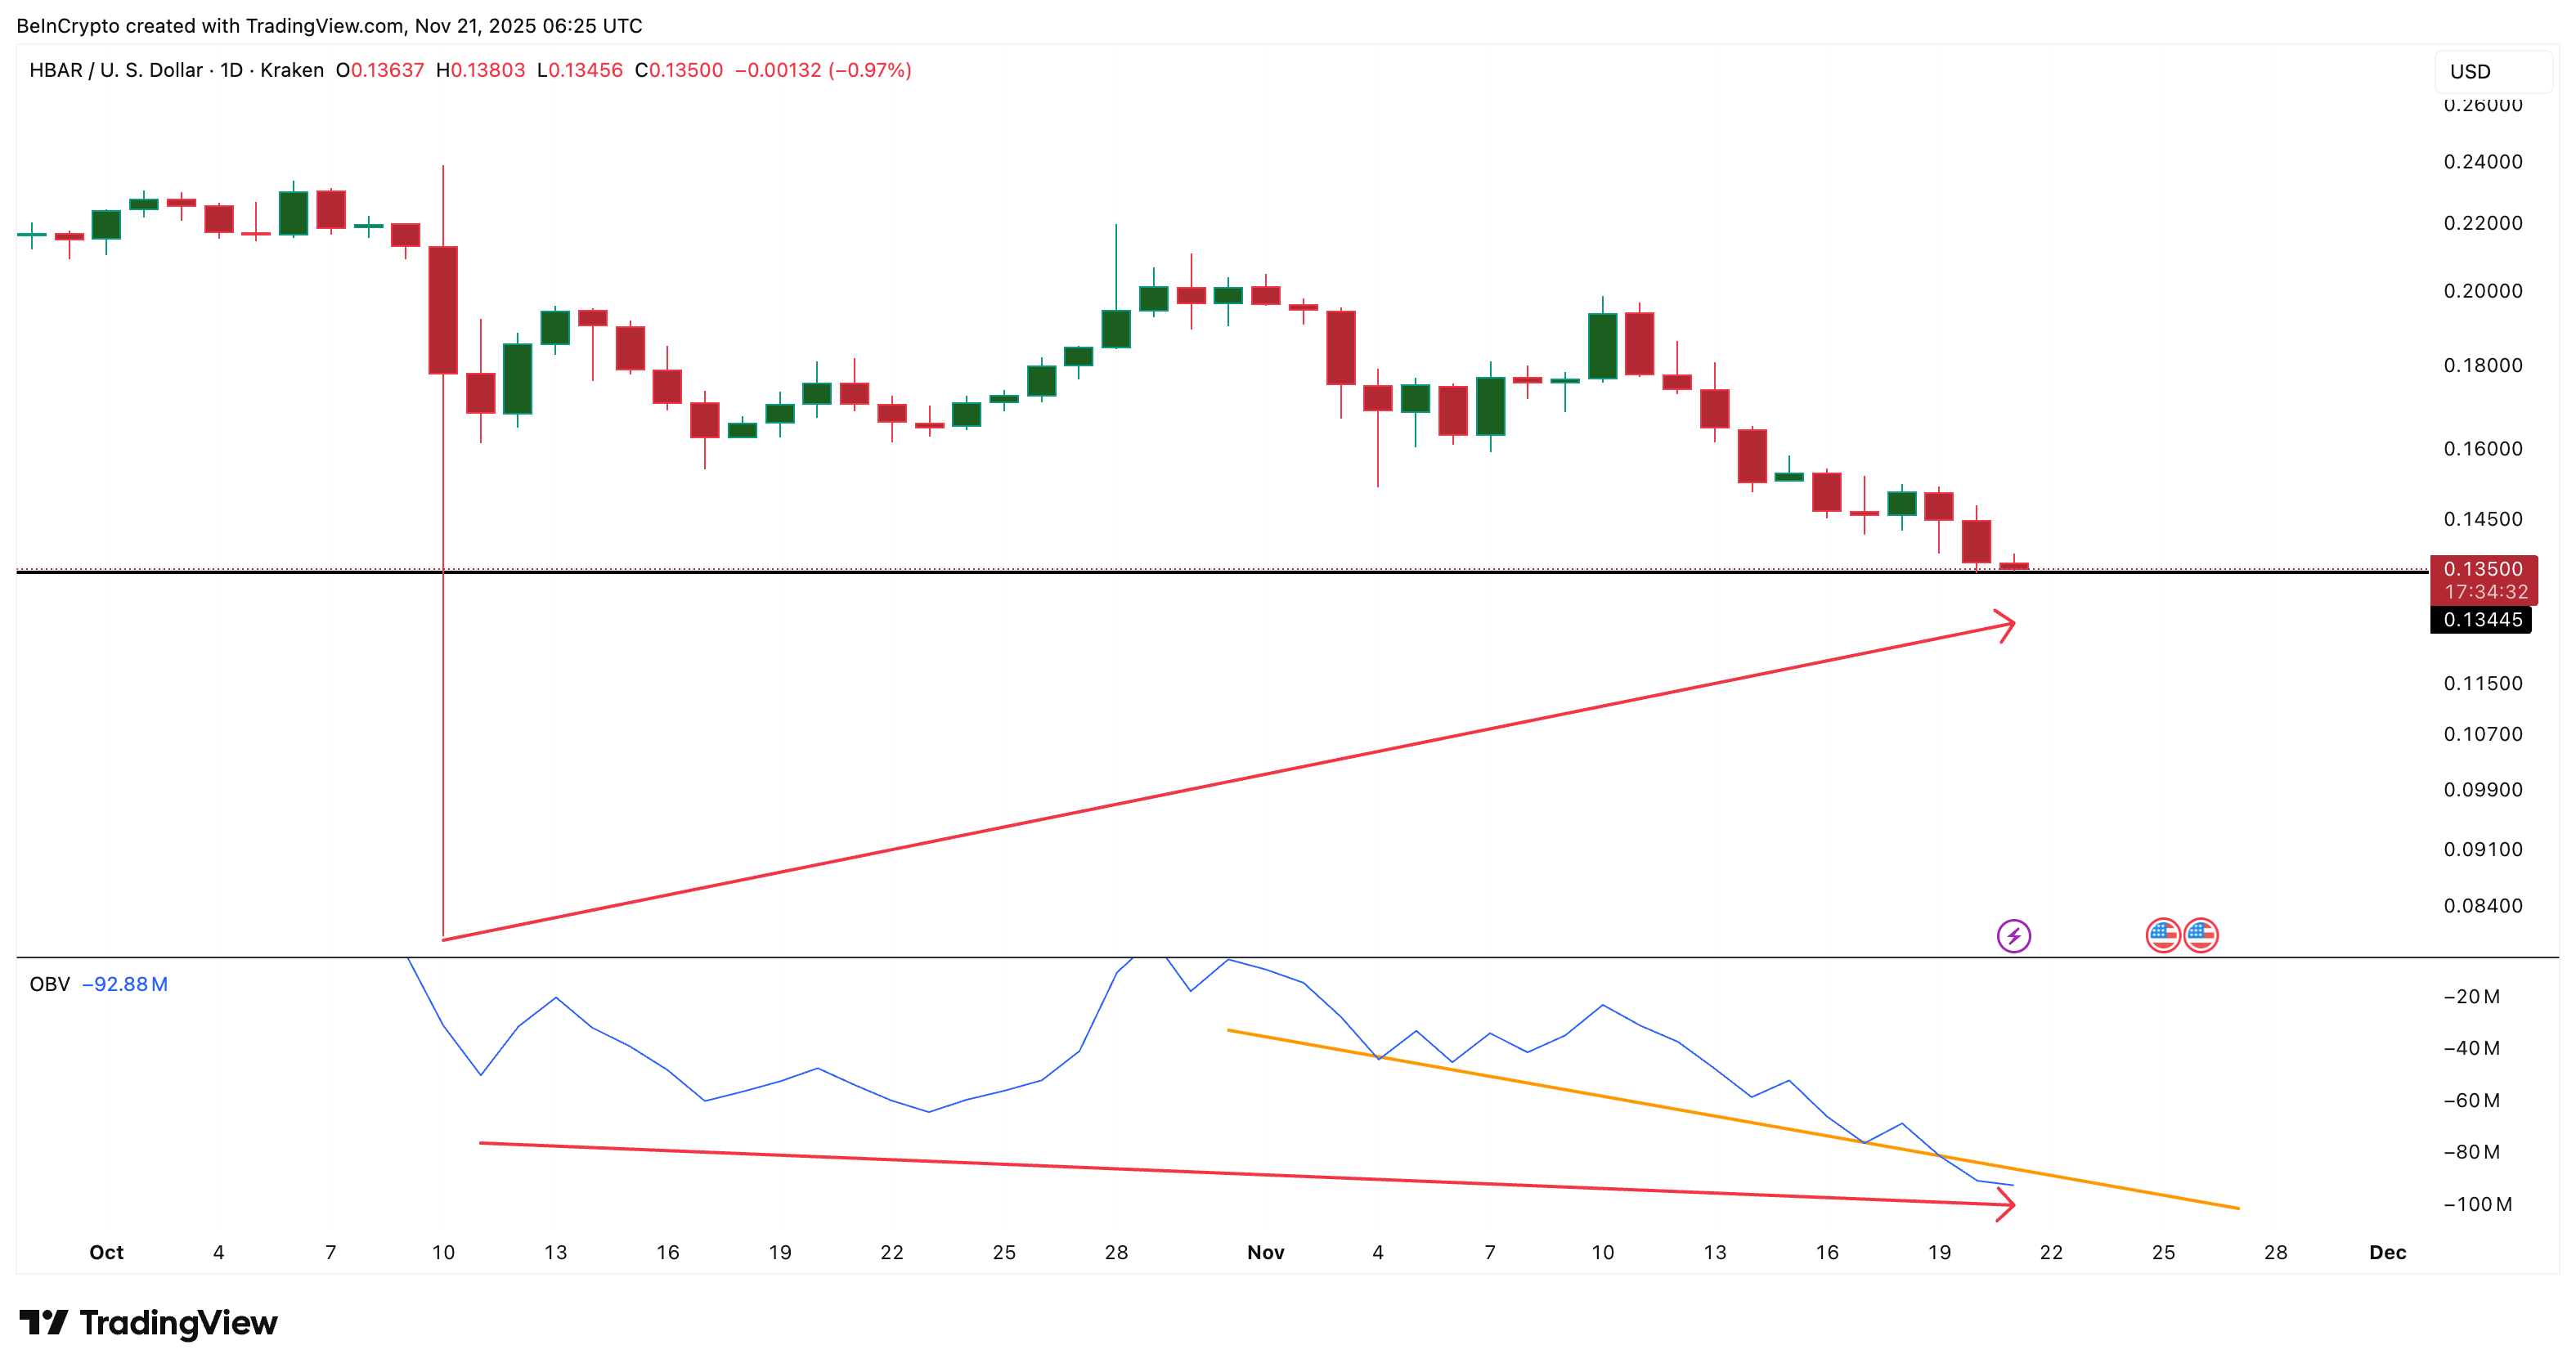 HBAR Price Sees Volume Breakdown: TradingView
Want more token insights like this? Sign up for Editor Harsh Notariya’s Daily Crypto Newsletter here.
Between October 10 and November 21, the price made a higher low, but OBV made a lower low. When price rises while volume falls, it signals fading strength beneath the surface.
Until OBV climbs back above the broken trend line, the market will not have the volume support needed for a clean recovery. As the OBV trendline connects lower lows, breaking above it would still keep the momentum weak. It would only lower the crash risks for now.
Shorts Outweigh Longs by 475% — A Sharp Derivatives Tilt
Derivatives add a second warning. The 30-day liquidation map shows roughly $15.32 million in short positions and only $2.66 million in long positions. This means shorts are about 475% higher than longs, a huge imbalance that reflects one thing: the market does not expect a bounce.
A liquidation map shows where leveraged traders could get forced out of their positions if the HBAR price moves to certain levels.
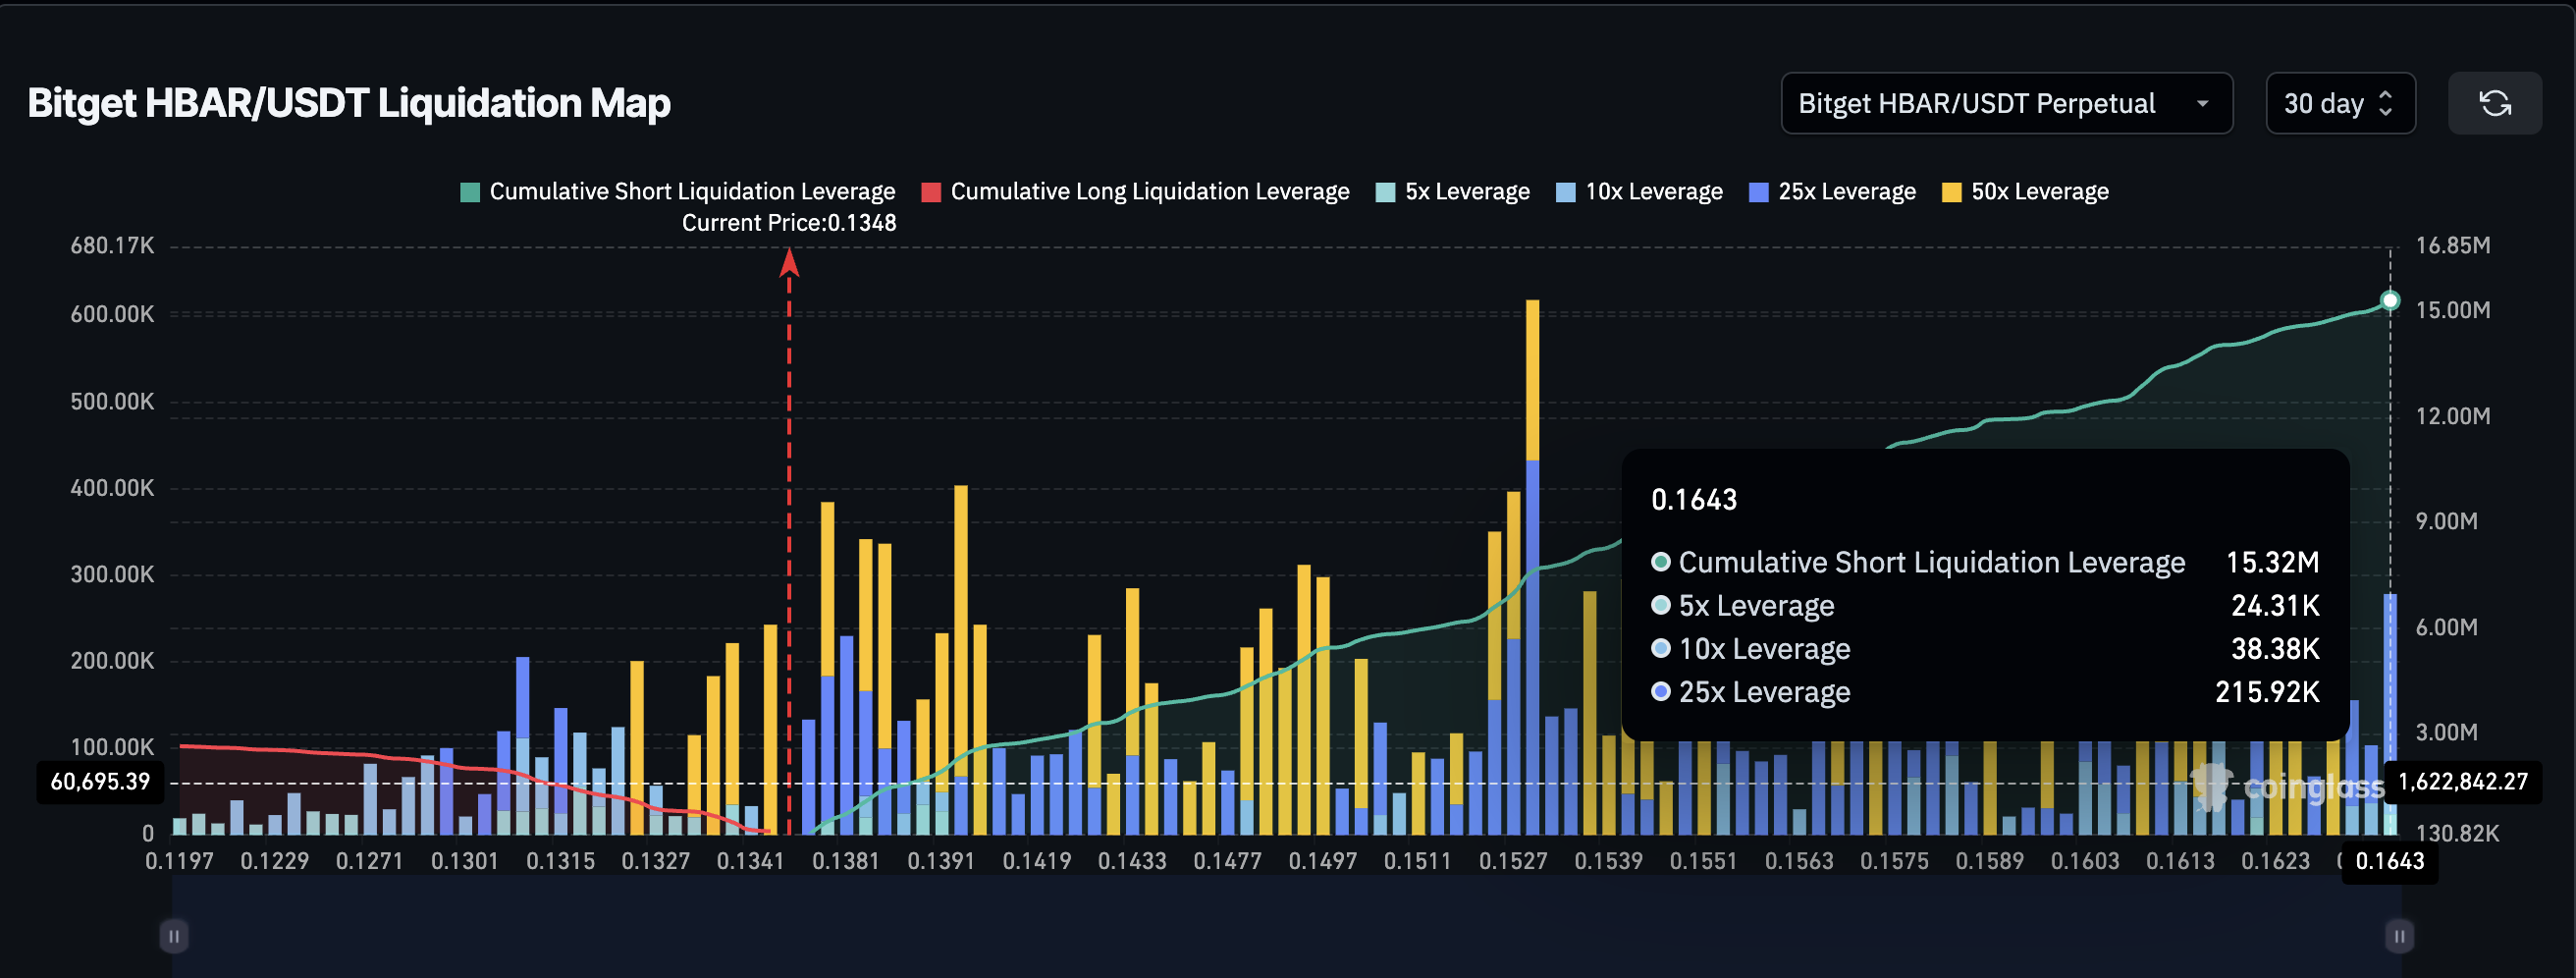 Short Squeeze Risk At Play: Coinglass
This tilt does two things.
It keeps pressure on HBAR if the price breaks below support, because short traders stay in control. And the remaining longs fall in the risk zone.
But if HBAR moves even slightly higher, that same imbalance can act as fuel for a sharp squeeze because there are far more shorts to liquidate than longs. The derivatives lean bearish, but the setup gives HBAR a small window for an explosive upside surprise.
HBAR Price Levels Show One Clear Crossroads
HBAR sits directly on $0.134, the same support level we predicted earlier. If it fails now, the next drop likely tests $0.129. Losing $0.129 opens the path toward $0.087, matching the broader downtrend where sellers remain in control.
On the upside, the first resistance is $0.144. A daily close above it would show buyers absorbing pressure and attempting to flip the trend. That kind of move would weaken the bearish theory.
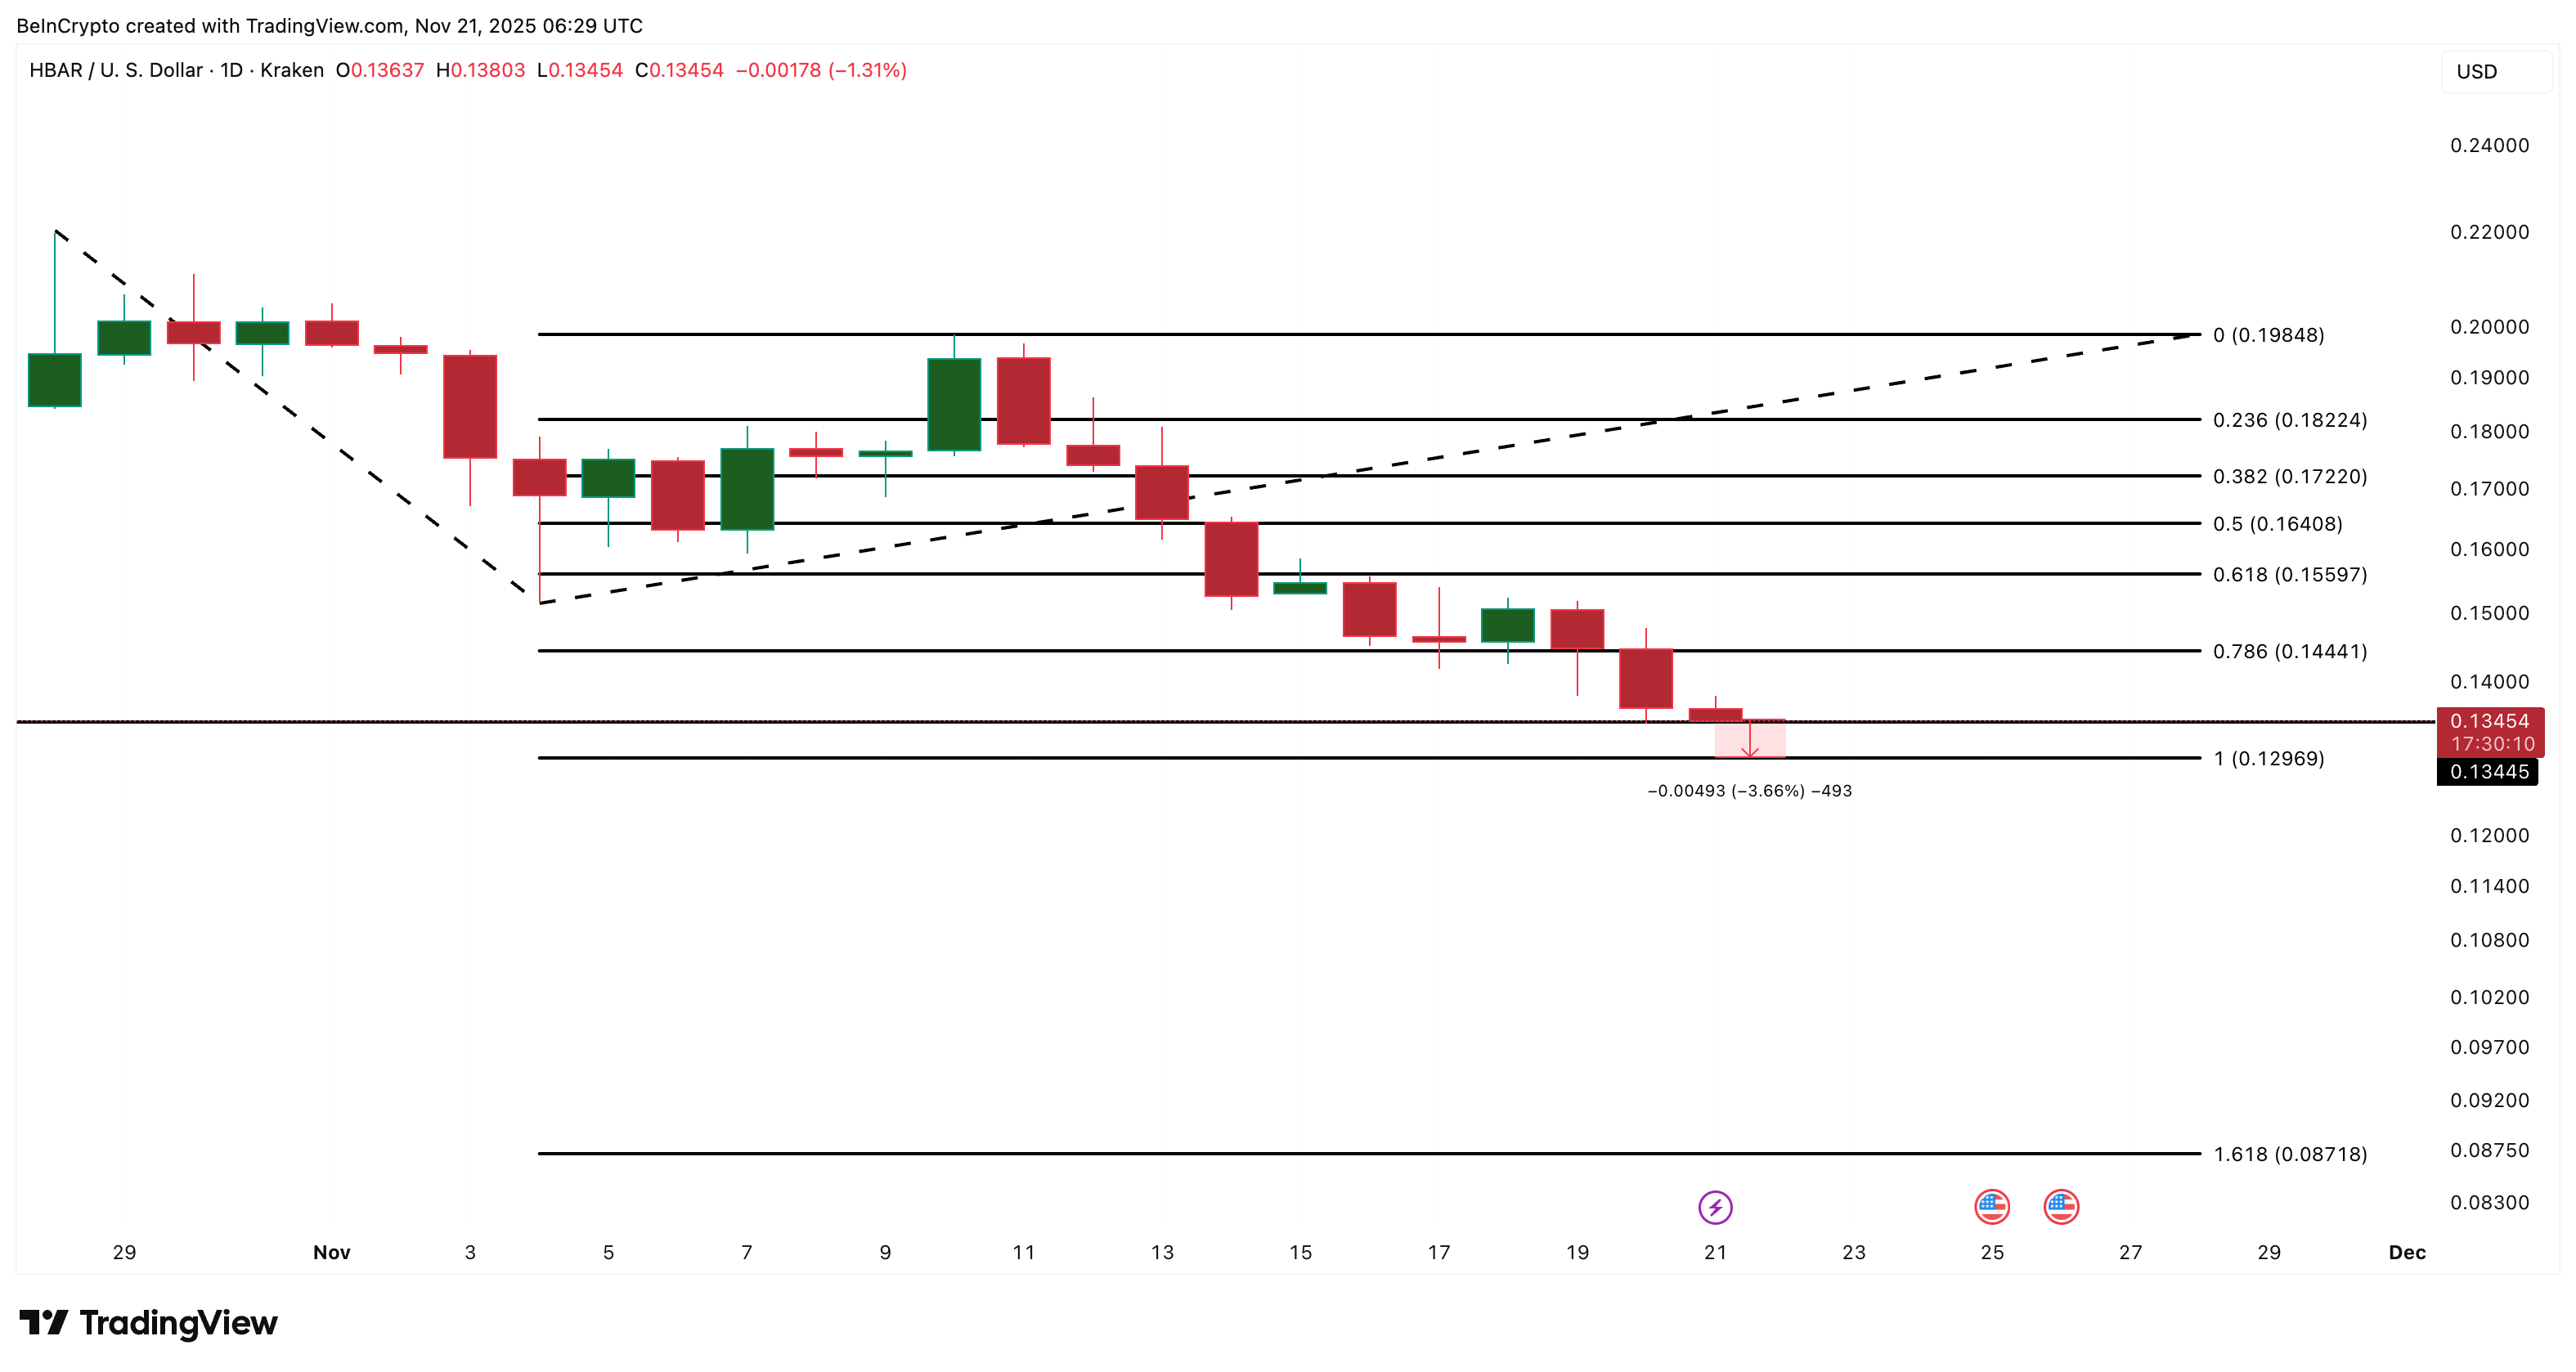 HBAR Price Analysis: TradingView
If that happens, the next barrier sits around $0.164, but reaching that point will require two things: volume improvement on OBV and a drop in the short-heavy derivatives positioning. Without both, breakouts will fail early. Also, moving above $0,164 would liquidate all the shorts, per the liquidation map shared earlier.
Recommended Articles


