


The U.S. Dollar Index Is the Key Driver of Gold Prices: Where Are the Dollar and Gold Headed Next?
1. Introduction
From the start of this year to mid-October, the gold market witnessed a substantial rally, with prices surging from $2,057 per ounce to $4,357 per ounce, representing a remarkable increase of 64% (Figure 1). However, gold prices have undergone a notable correction recently, prompting economists and analysts to conduct in-depth research into the various factors influencing the ups and downs of the current gold market cycle. We argue that while inflation, economic growth rate, debt levels, and Federal Reserve interest rates have exerted some driving force on the recent gold price movements, they are secondary factors. The strength or weakness of the U.S. Dollar Index stands as the core determinant shaping gold's trajectory.
This paper starts with the relevant theories driving gold prices, explores historical phases that contradict these theories, then analyses the recent trend of the U.S. Dollar Index, and ultimately assesses the future performance of the U.S. dollar and gold. The research conclusions indicate that the U.S. Dollar Index is expected to peak and pull back in the coming months, while gold prices will embark on a strengthening trajectory. Based on this, dollar short traders may focus on the U.S. Dollar Index as well as currency pairs such as EUR/USD, GBP/USD, and USD/JPY; gold long investors can pay attention to gold ETFs (e.g., GLD) and individual gold stocks, including Newmont Corporation (NEM) and Barrick Gold Corporation (GOLD).
Figure 1: Gold Prices (US$/oz)
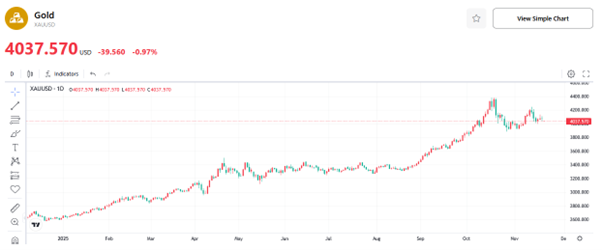
Source: TradingKey
2. Secondary Factors
2.1 Persistently High Inflation
In theory, the core logic behind high inflation driving up gold prices lies in gold’s inflation-hedging property. Inflation essentially denotes a decline in the purchasing power of currency. In contrast, gold has a limited supply and cannot be arbitrarily issued, so its value remains relatively stable, making it a core asset for hedging against currency depreciation. When inflation rises, the real value of paper money shrinks, prompting investors to sell depreciating assets such as cash and bonds and shift to gold for capital preservation. Additionally, if high inflation is caused by central banks’ overly loose monetary policies, the excess liquidity in the market will lead to surplus funds flowing into the gold market, thereby boosting gold prices. However, exceptions occasionally arise in the real world.
For example, the 2022 Russia-Ukraine conflict drove up global energy prices, with U.S. CPI surging above 9% in June that year—a 40-year high. To curb this bout of high inflation, the Federal Reserve launched its most aggressive interest rate hike cycle on record, raising rates by a cumulative 425 basis points within the year. As a non-interest-bearing asset, gold saw a sharp rise in holding costs amid the high-interest-rate environment, leading to a drastic decline in its appeal. Ultimately, the price of gold plummeted from $2,052 to $1,622 per ounce, representing a 21% drop.
2.2 Economic Downturn
In theory, an economic slowdown or crisis drives up the price of gold, with the core logic lying in the prominent safe-haven and value-preserving properties of gold. During an economic downturn, the prices of risky assets such as stocks decline, prompting investors to sell off these assets and shift to gold for capital safety. Meanwhile, amid a crisis, currencies may depreciate and inflationary pressures may rise. As a non-credit asset, gold does not lose value due to policy adjustments or debt issues, thus enabling investors to preserve the value of their wealth. However, again, there are exceptions in the real world—gold prices may fall during economic crises.
For example, the financial crisis triggered by the U.S. subprime mortgage crisis plunged the U.S. economy into a severe recession. In the early stages of the crisis, gold briefly served as a safe-haven asset. However, after the collapse of Lehman Brothers, a full-scale liquidity crisis erupted in the market. To cover losses on other assets and meet margin calls, investors were forced to engage in indiscriminate selling of liquid assets, including gold, and the logic of "cash is king" dominated the market. Against this backdrop of economic recession, gold prices fell from $971 per ounce in July 2008 to $705 per ounce in November of the same year, representing a sharp decline of 27.4%.
2.3 Soaring Debt
In theory, soaring debt tends to drive up the price of gold, for the following reasons: Firstly, high debt levels can trigger market concerns about economic recession and debt defaults, prompting investors to sell risky assets and shift to gold, which boasts prominent safe-haven properties. Secondly, large-scale borrowing is often accompanied by accommodative monetary policies. Central bank money printing fuels inflation expectations, and as an inflation-resistant asset, gold sees increased demand. Finally, debt issues may erode the creditworthiness of sovereign currencies. In contrast, gold’s non-credit nature positions it as a value anchor, attracting capital inflows that underpin its price. These three factors collectively act to push gold prices higher.
However, there is an exception to this pattern: affected by the 2008 global financial crisis and the 2012 European debt crisis, multiple rounds of economic stimulus policies launched by the United States led to the continuous accumulation of fiscal deficits. This resulted in the sustained and rapid expansion of U.S. debt between 2011 and 2015. Yet, the gold market entered a prolonged bear market during the same period. After peaking at a high of $1,877 per ounce in September 2011, gold prices began a steady decline, falling to $1,050 per ounce by the end of 2015—a cumulative drop of 44.1% over four years. This can be attributed to the enhanced expectations of spending cuts following the passage of the Budget Control Act of 2011, coupled with the strengthening anticipation of a tighter monetary policy by the Federal Reserve. These factors increased the opportunity cost of holding gold, thereby exerting persistent downward pressure on its price.
2.4 Central Bank Interest Rate Cuts
In theory, the core logic behind Fed rate cuts driving up gold prices is clear. First, interest rate cuts lower the yield on dollar-denominated assets, reducing the opportunity cost of holding gold. This prompts capital to shift from dollar assets to gold, enhancing its appeal as an allocation option. Second, rate cuts typically weaken the U.S. dollar; since gold is priced in dollars, non-dollar currency holders face lower purchasing costs, which stimulates global demand for the metal. Finally, rate cuts signal monetary easing, which tends to stoke inflation expectations. Coupled with the economic uncertainty that often accompanies such policy shifts, gold’s inflation-hedging and safe-haven properties become more prominent, spurring investors to increase their holdings and ultimately pushing up prices.
However, an exception occurred in 2020. Amid the impact of the pandemic, the Federal Reserve urgently launched an interest rate cut cycle, slashing interest rates to near zero within two months and rolling out unlimited quantitative easing (QE). Notably, gold prices declined during this rate-cutting phase, dropping from $2,055 an ounce in August 2020 to $1,778 by the end of November, representing a decrease of approximately 13.5%. The core reason was that the pandemic triggered a global liquidity crunch, forcing investors to sell gold holdings for cash to address funding pressures.
3. Key Factor: The Inverse Relationship Between the U.S. Dollar and Gold Prices
We believe that high inflation, economic downturn, surging debt, and central bank interest rate cuts are secondary factors influencing the current gold price trend. Instead, the core driver behind gold market fluctuations is the U.S. Dollar Index. Since the start of this year, amid the ongoing escalation of de-dollarization, the dollar has been on a steady decline in the first three quarters, which in turn fuelled a continuous rally in gold prices to successive all-time highs. However, a reversal has occurred since the fourth quarter: the U.S. dollar has strengthened, and gold prices have fallen in tandem (Figure 3).
The US Dollar Index and gold prices exhibit a significant inverse correlation, with the core logic centred on three key pillars: gold’s US dollar-denominated nature, the substitution effect of global safe-haven capital, and the interest rate differential-driven asset allocation logic. Fundamentally, gold is primarily priced in US dollars, meaning the dollar’s strength directly impacts gold’s relative value—when the US Dollar Index strengthens, investors holding non-dollar currencies face higher costs to purchase gold, which suppresses global demand and weighs on gold prices, while a weaker dollar lowers the "price barrier" for gold, unlocking pent-up demand and driving price rallies.
From the perspective of safe-haven attributes, both serve as key safe-haven options for global capital but exhibit a substitution relationship. During economic turmoil or geopolitical conflicts, if the market deems the US dollar a more stable "safe haven" — such as when US dollar liquidity tightens amid a Federal Reserve rate-hiking cycle — capital will flow into US dollar-denominated assets, diverting demand for gold. Conversely, when the US dollar's credit is impaired (e.g., due to quantitative easing or debt risks), gold, as a physical asset free of credit risk, becomes the preferred choice for safe-haven capital, driving its price to fluctuate inversely with the US Dollar Index.
In addition, interest rate differentials have further strengthened this inverse relationship. The U.S. Dollar Index is highly correlated with Federal Reserve policy: during rate-hiking cycles, the U.S. dollar appreciates due to its interest rate advantage, while gold—lacking interest-bearing returns—sees diminished appeal. Conversely, in rate-cutting cycles, the U.S. dollar weakens, reducing the opportunity cost of holding gold. Simultaneously, rising inflation expectations underscore gold’s value-preserving properties, further driving the inverse movement between gold prices and the U.S. Dollar Index. While positive correlations between the U.S. dollar and gold have occurred historically, we anticipate that the strong inverse relationship observed recently will persist in the coming months. Therefore, analysing the trend of the U.S. Dollar Index is the most critical factor in predicting gold price movements.
Figure 3: The USD and Gold Trends
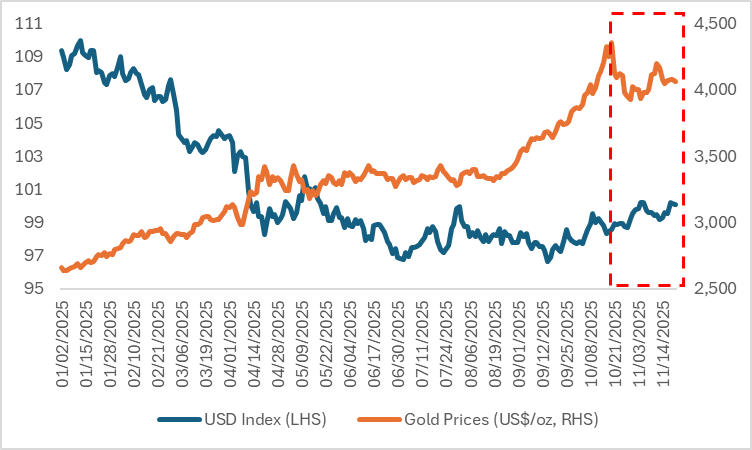
Source: Refinitiv, TradingKey
4. Movement of the US Dollar Index
Since mid-September this year, the US Dollar Index has embarked on an upward trajectory and recently breached the key psychological level of 100 (Figure 4); while the US dollar’s previous rally occurred in July and shared the same directional trend, the driving forces behind the two rounds of gains differ significantly. In July, US economic indicators—particularly consumer data that exceeded expectations—performed robustly, reflecting a phased rebound of the US economy following tariff impacts and prompting a corresponding strengthening of market expectations for a "soft landing." By contrast, the core drivers of the current dollar rally lie in the hawkish remarks from Federal Reserve officials and a sharp decline in the probability of a rate cut in December, with differences also evident in the external environment: in July, the British pound plummeted sharply amid sustained weakness in the UK economy and poor fiscal conditions, indirectly lifting the US Dollar Index, while this time, Japan's new Prime Minister Sanae Takaichi is expected to maintain the accommodative policies of Abenomics, leading to a depreciation of the yen and thereby providing upward support for the US Dollar Index.
In addition, the quantitative tightening (QT) implemented over the recent period, combined with multiple factors such as U.S. Treasury financing, U.S. government shutdown risks, and the fulfilment of month-end regulatory requirements, has led to a tightening of market liquidity recently. Amid liquidity strains, the supply of U.S. dollars in interbank and offshore funding markets has contracted sharply, driving a surge in offshore U.S. dollar interest rates (e.g., SOFR). Global institutions have thus been forced to repurchase U.S. dollars at elevated costs to service debts or cover liquidity shortfalls. This squeeze-driven demand for U.S. dollars constitutes another key factor underpinning the strength of the U.S. dollar exchange rate.
Looking ahead, we judge that the current rise in the US Dollar Index is a corrective rebound rather than a trend reversal, and the US dollar is likely to weaken again over the coming months driven by two core factors: first, the Federal Reserve is set to end its quantitative tightening (QT) program on 1 December, which is expected to ease market liquidity conditions and exert downward pressure on the dollar; second, while the nonfarm payrolls data released on 20 December exceeded expectations and recent hawkish remarks from Fed officials have sharply reduced the probability of a rate cut in December, the Fed is still projected to continue its rate-cutting cycle in the first half of next year—with potential cuts larger than those by the European Central Bank (ECB)—against the backdrop of a softening economy and contained inflation, which implies a narrowing of the US-EU interest rate differential that will in turn boost the euro against the US dollar. These two factors will collectively weigh on the US Dollar Index, and as noted earlier, the core driver behind the current rally in gold prices is the global de-dollarization trend, with a weaker US dollar further fuelling the upside momentum of gold.
Figure 4: USD Index
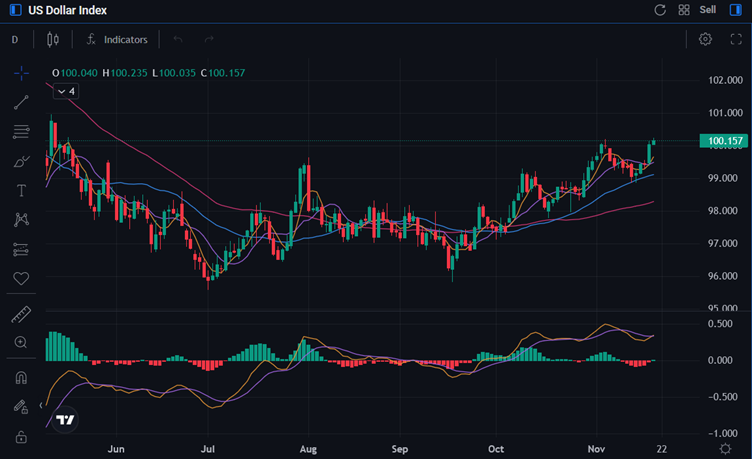
Source: Mitrade
5. Conclusion
In summary, while inflation, economic growth rate, debt levels, and Federal Reserve interest rates have exerted some driving influence on the gold price trend in this cycle, they are secondary factors. The strength or weakness of the U.S. Dollar Index stands as the core determinant of gold's movement. Our research conclusions indicate that the U.S. Dollar Index is expected to peak and pull back in the coming months, with gold prices set to embark on a strengthening trajectory.
Based on this outlook, USD short traders may focus on the U.S. Dollar Index (DXY) as well as currency pairs such as EUR/USD, GBP/USD, and USD/JPY. For gold long investors, key opportunities lie in gold ETFs (e.g., GLD) and individual gold stocks including Newmont Corporation (NEM) and Barrick Gold Corporation (GOLD).
Recommended Articles


