


Crypto Today: Bitcoin, Ethereum, XRP downside risks escalate as traders reduce exposure
- Bitcoin faces increasing pressure, falling toward a key support range between $108,000 and $110,000.
- Ethereum remains above the 100-day EMA, but weak technical structure hints at downtrend continuation.
- XRP bearish pressure mounts, targeting the next key support level at $2.20.
Bitcoin (BTC) is declining for the third consecutive day, trading around $110,500 at the time of writing on Thursday. The drawdown follows the largest deleveraging event in the history of the cryptocurrency industry on Friday, which continues to drag sentiment in the broader crypto ecosystem down.
Altcoins, including Ethereum (ETH) and Ripple (XRP), remain suppressed as traders stay on the sidelines, seemingly unconvinced that the correction is over. Despite the negative sentiment, ETH holds above the $4,000 level as XRP bulls struggle to defend a key support at around $2.40.
Data spotlight: Bitcoin, Ethereum see-saw as risk appetite dips
Institutional interest, which has consistently shaped Bitcoin and Ethereum’s sentiment this year, has been on the back foot this week, as evidenced by extended outflows from United States (US)-based Exchange Traded Funds (ETFs).
SoSoValue data shows that Bitcoin ETFs experienced outflows of $104 million on Wednesday, bringing the cumulative total net inflow to $62.44 billion and the net assets to $151.32 billion. On Tuesday, BTC ETFs recorded a net inflow of $103 million, underscoring mixed signals in the institutional arena.
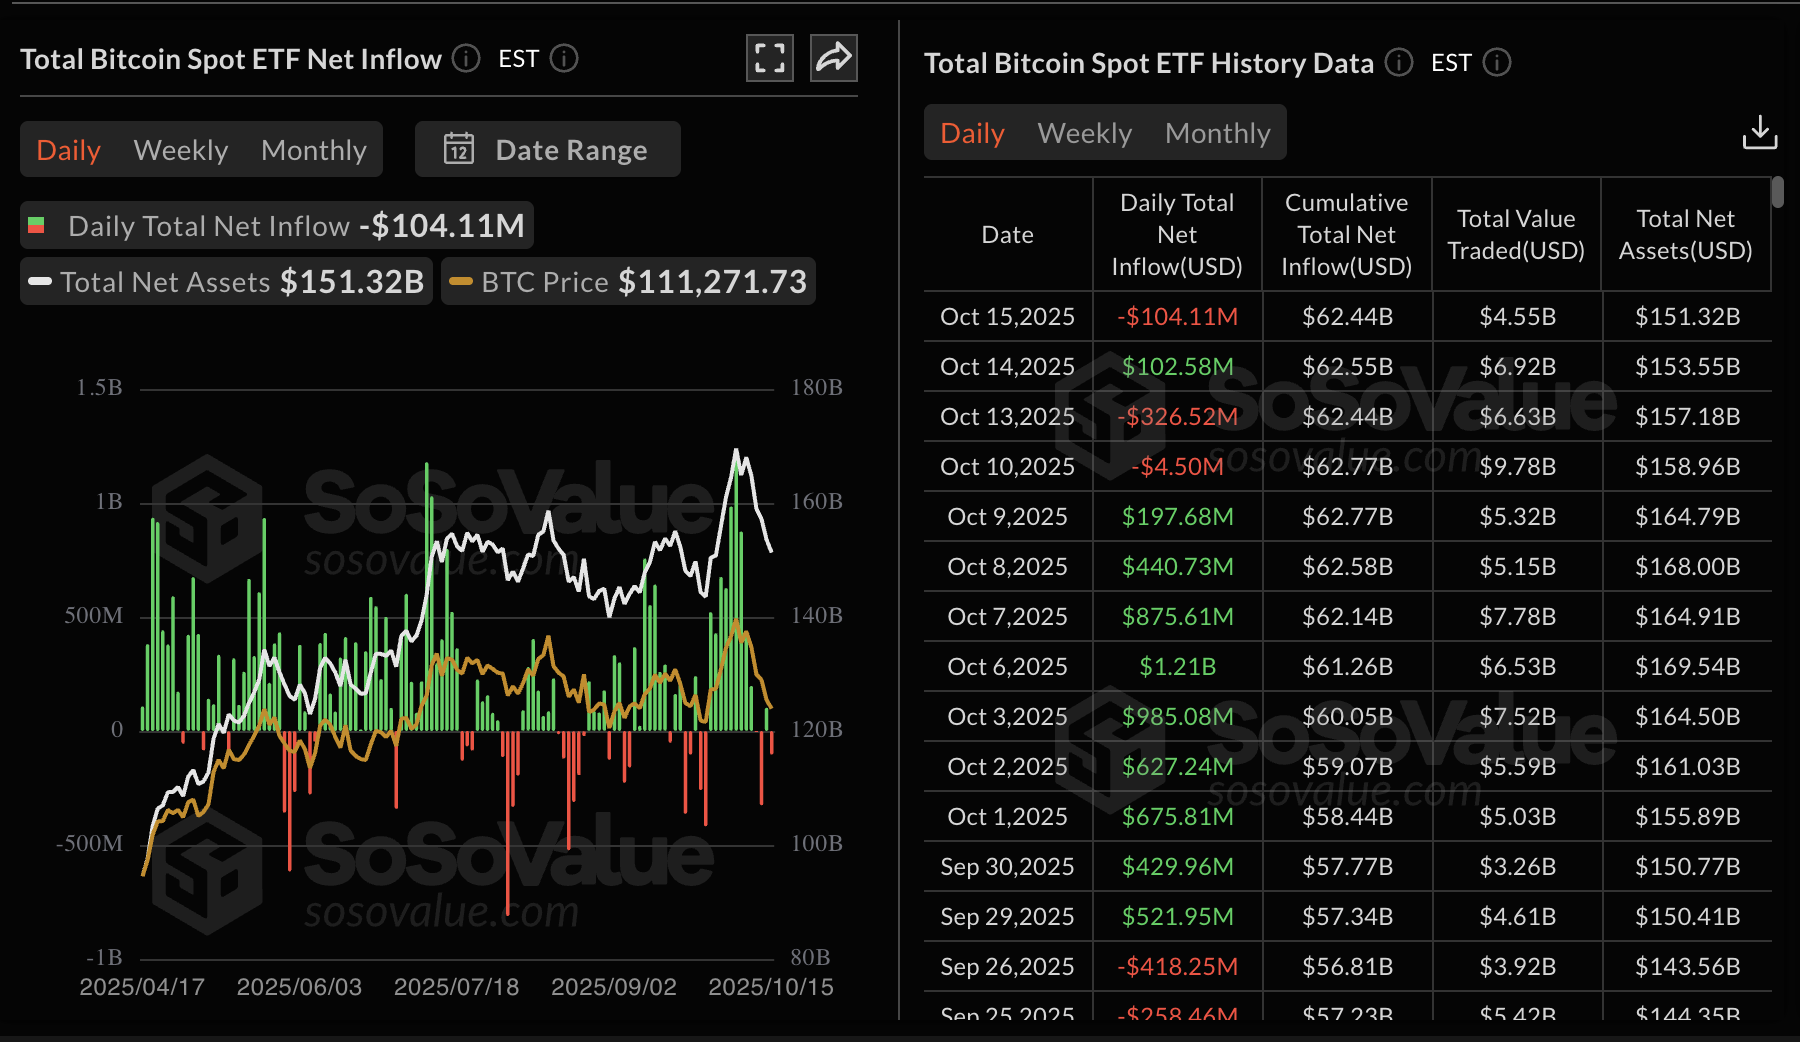
Bitcoin ETF stats | Source: SoSoValue
Steady inflows are required to support the short-term bullish trend, encouraging retail investors to have confidence in Bitcoin’s ability to recover toward its record high of $126,199.
The demand for Ethereum US-based ETFs has also reduced significantly in the last few weeks, compared to volumes observed earlier this month, as reflected by the $169 million in net inflow volume on Wednesday. On Tuesday, Ethereum experienced a higher net inflow of approximately $236 million, following three consecutive days of outflows.
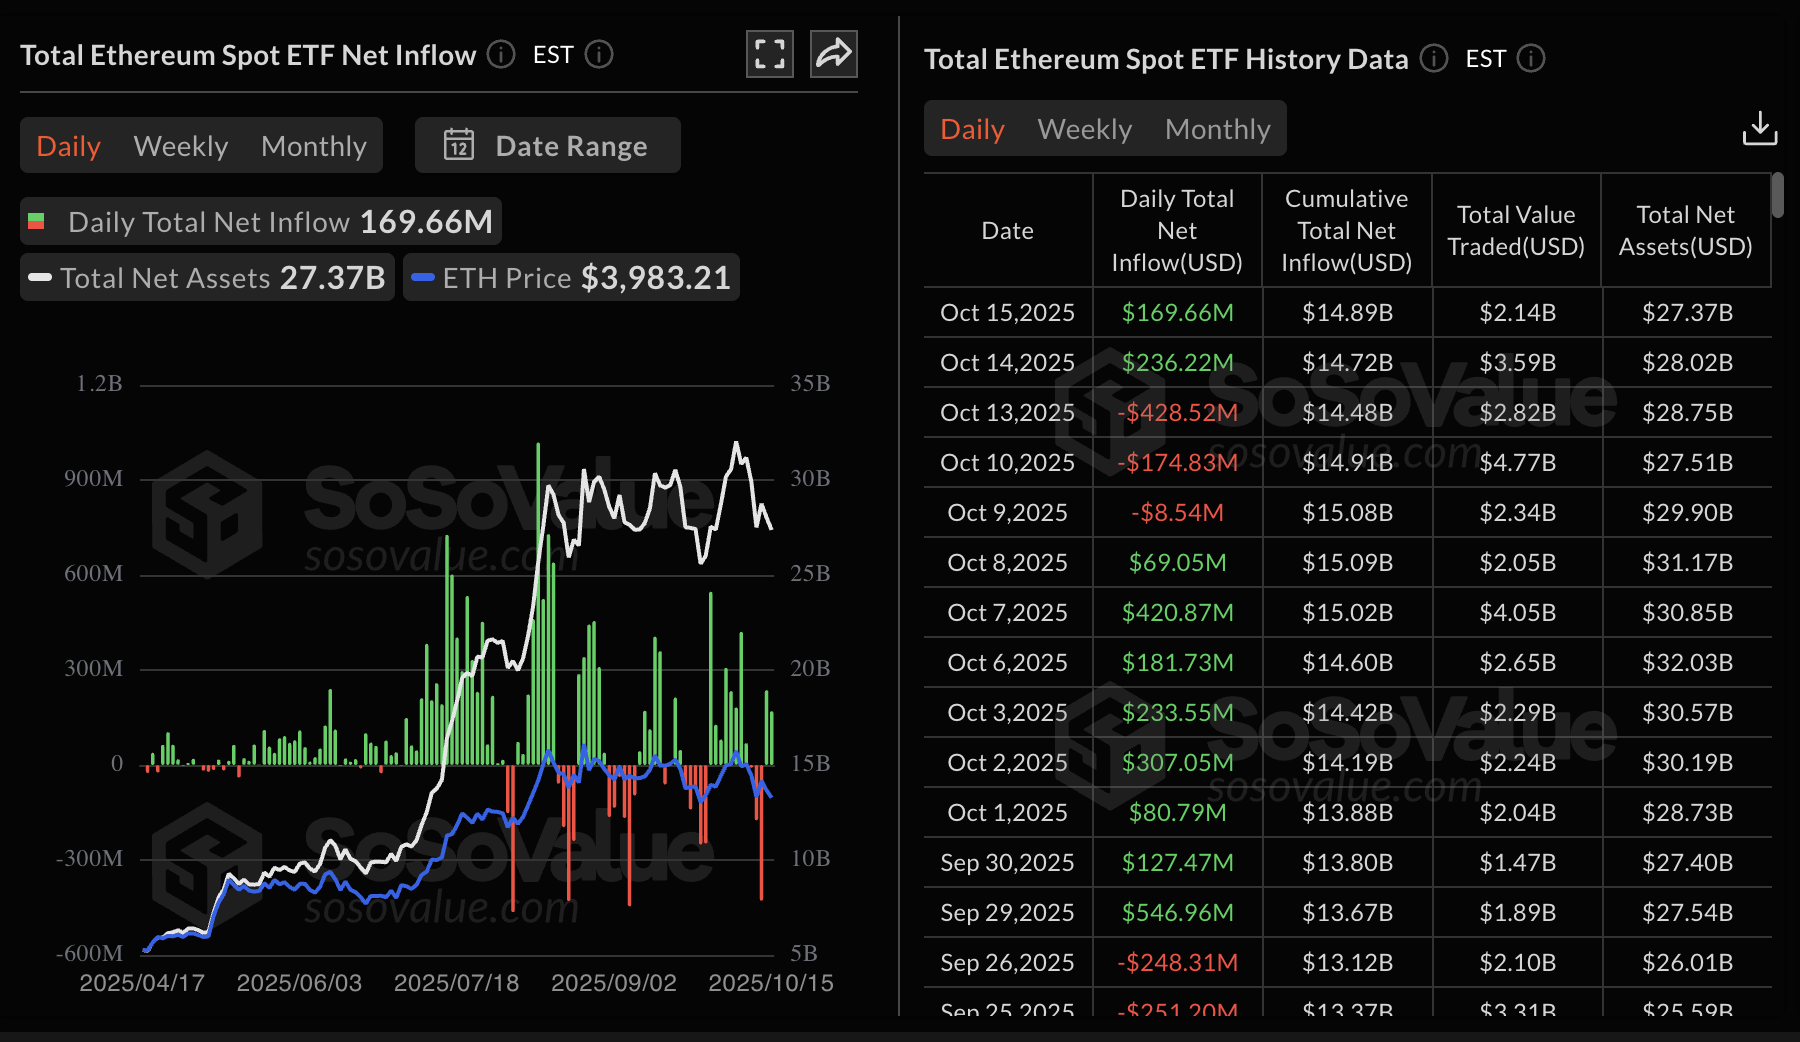
Ethereum ETF stats | Source: SoSoValue
Meanwhile, retail interest in XRP resumes its downtrend on Thursday, following short-lived stability on Wednesday. The futures Open Interest (OI) averages $4.05 billion at the time of writing. With the OI significantly below $9.09 billion – the level seen just before Friday’s deleveraging event, which triggered massive liquidations – the odds of a significant decline in the XRP price are high.
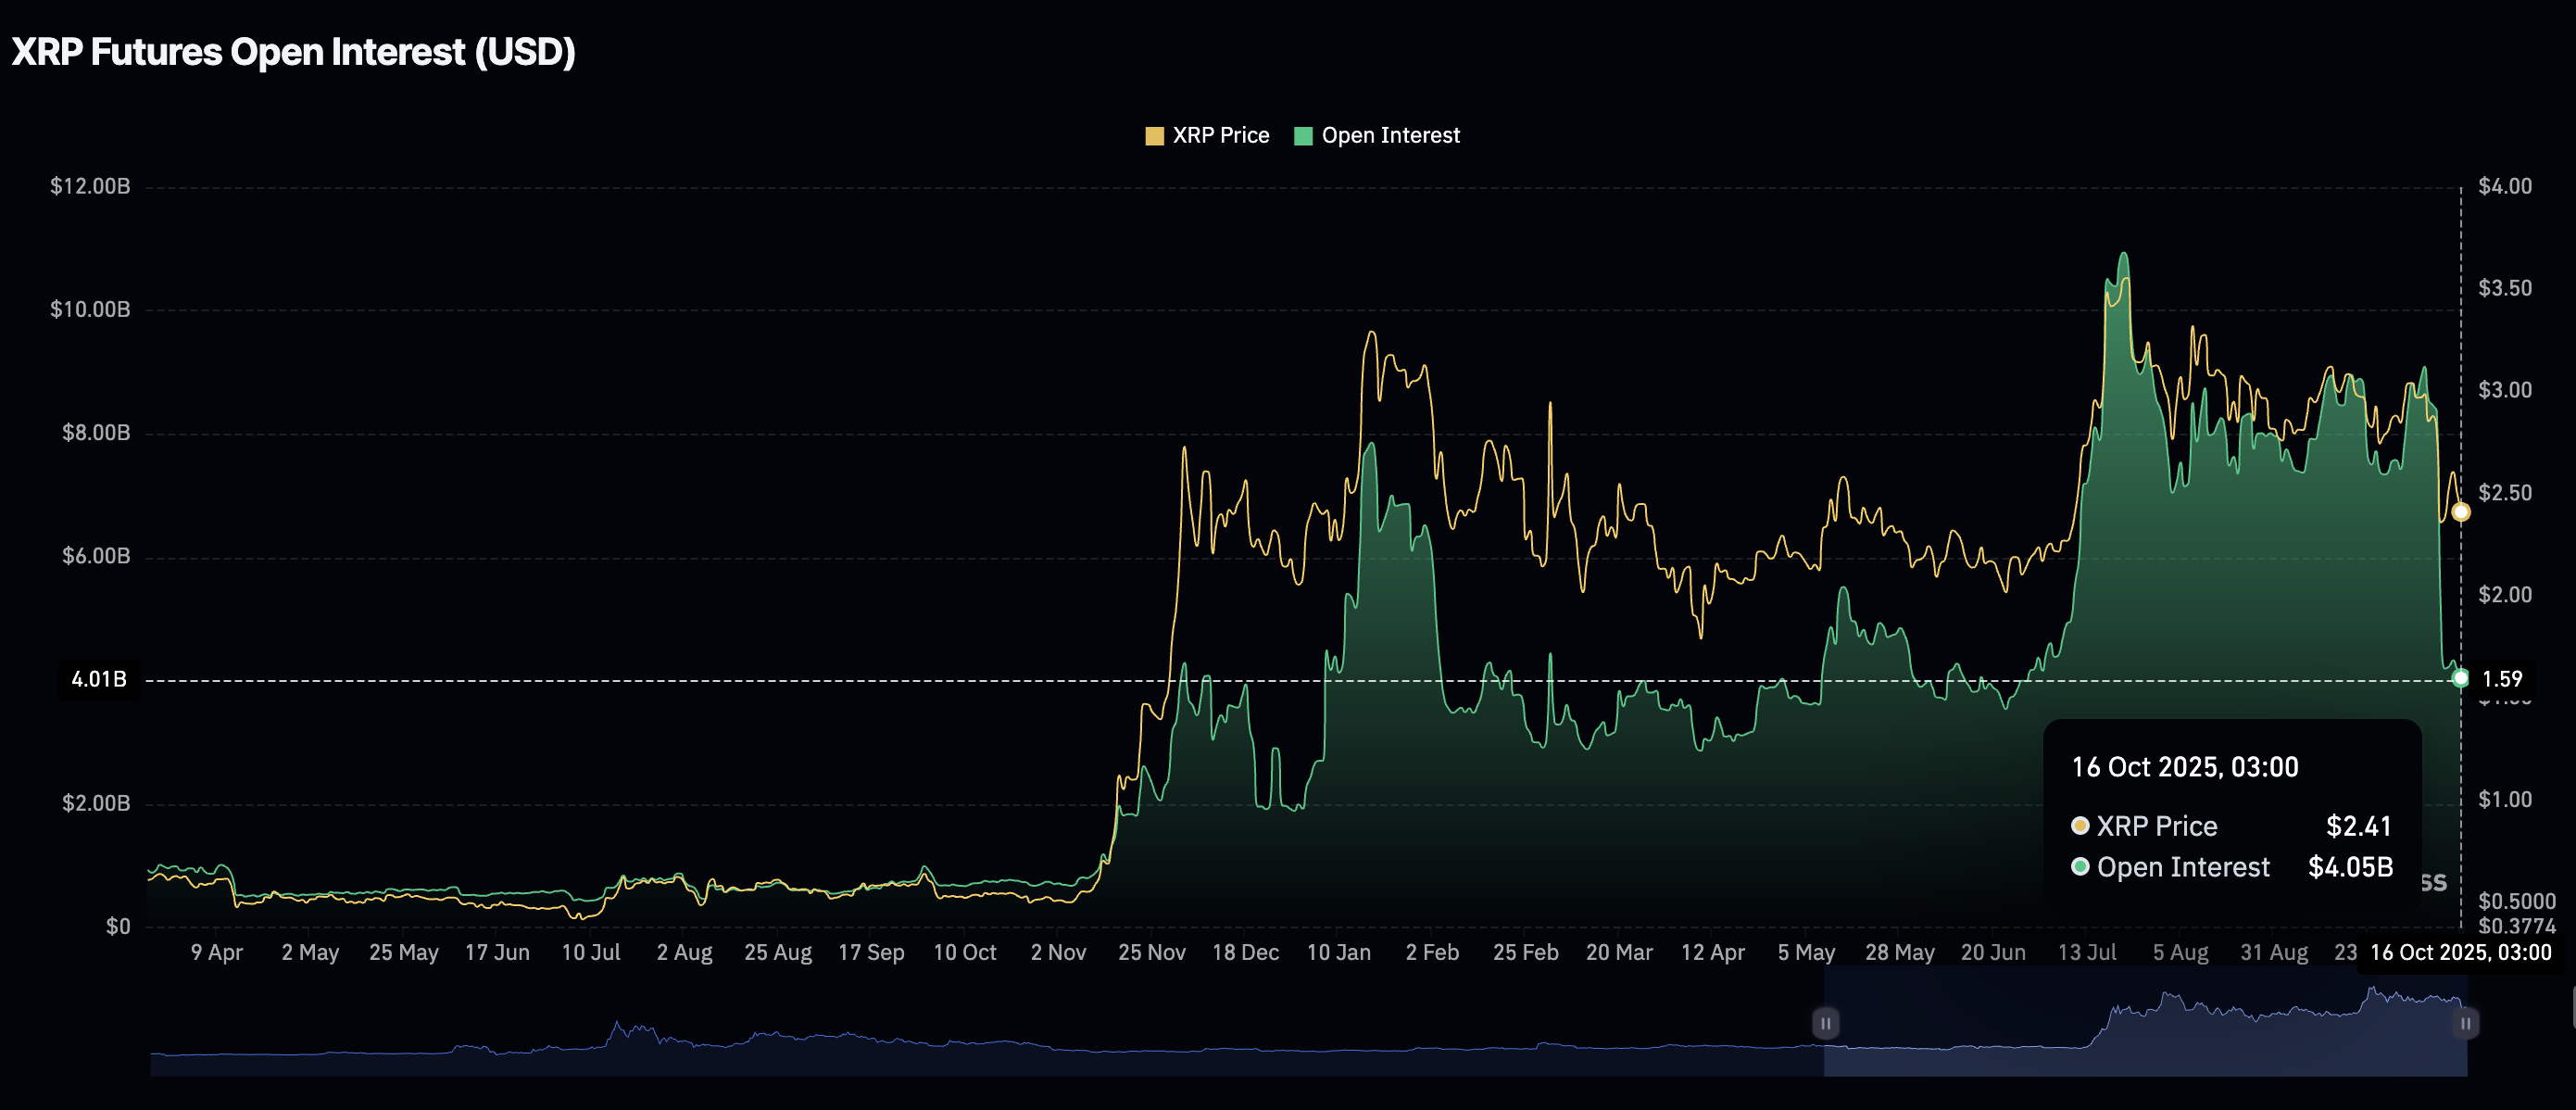
XRP Open Interest | Source: CoinGlass
Chart of the day: Bitcoin tests key support range
Bitcoin is trading above a key support range between the 200-day Exponential Moving Average (EMA) at $108,086 and the $110,000 level on the daily chart. Short-term downside risks are apparent, as the Relative Strength Index (RSI) extends its decline to 40.
The Moving Average Convergence Divergence (MACD) indicator on the same daily chart has maintained a sell signal since Friday, prompting traders to reduce exposure and contributing to selling pressure.
Traders can also look out for a reversal above the support range if investors buy the dip. Still, risk sentiment may prevail until the Bitcoin price reclaims the 100-day EMA at $113,402 and the 50-day EMA at $115,161, which serve as key resistance levels.
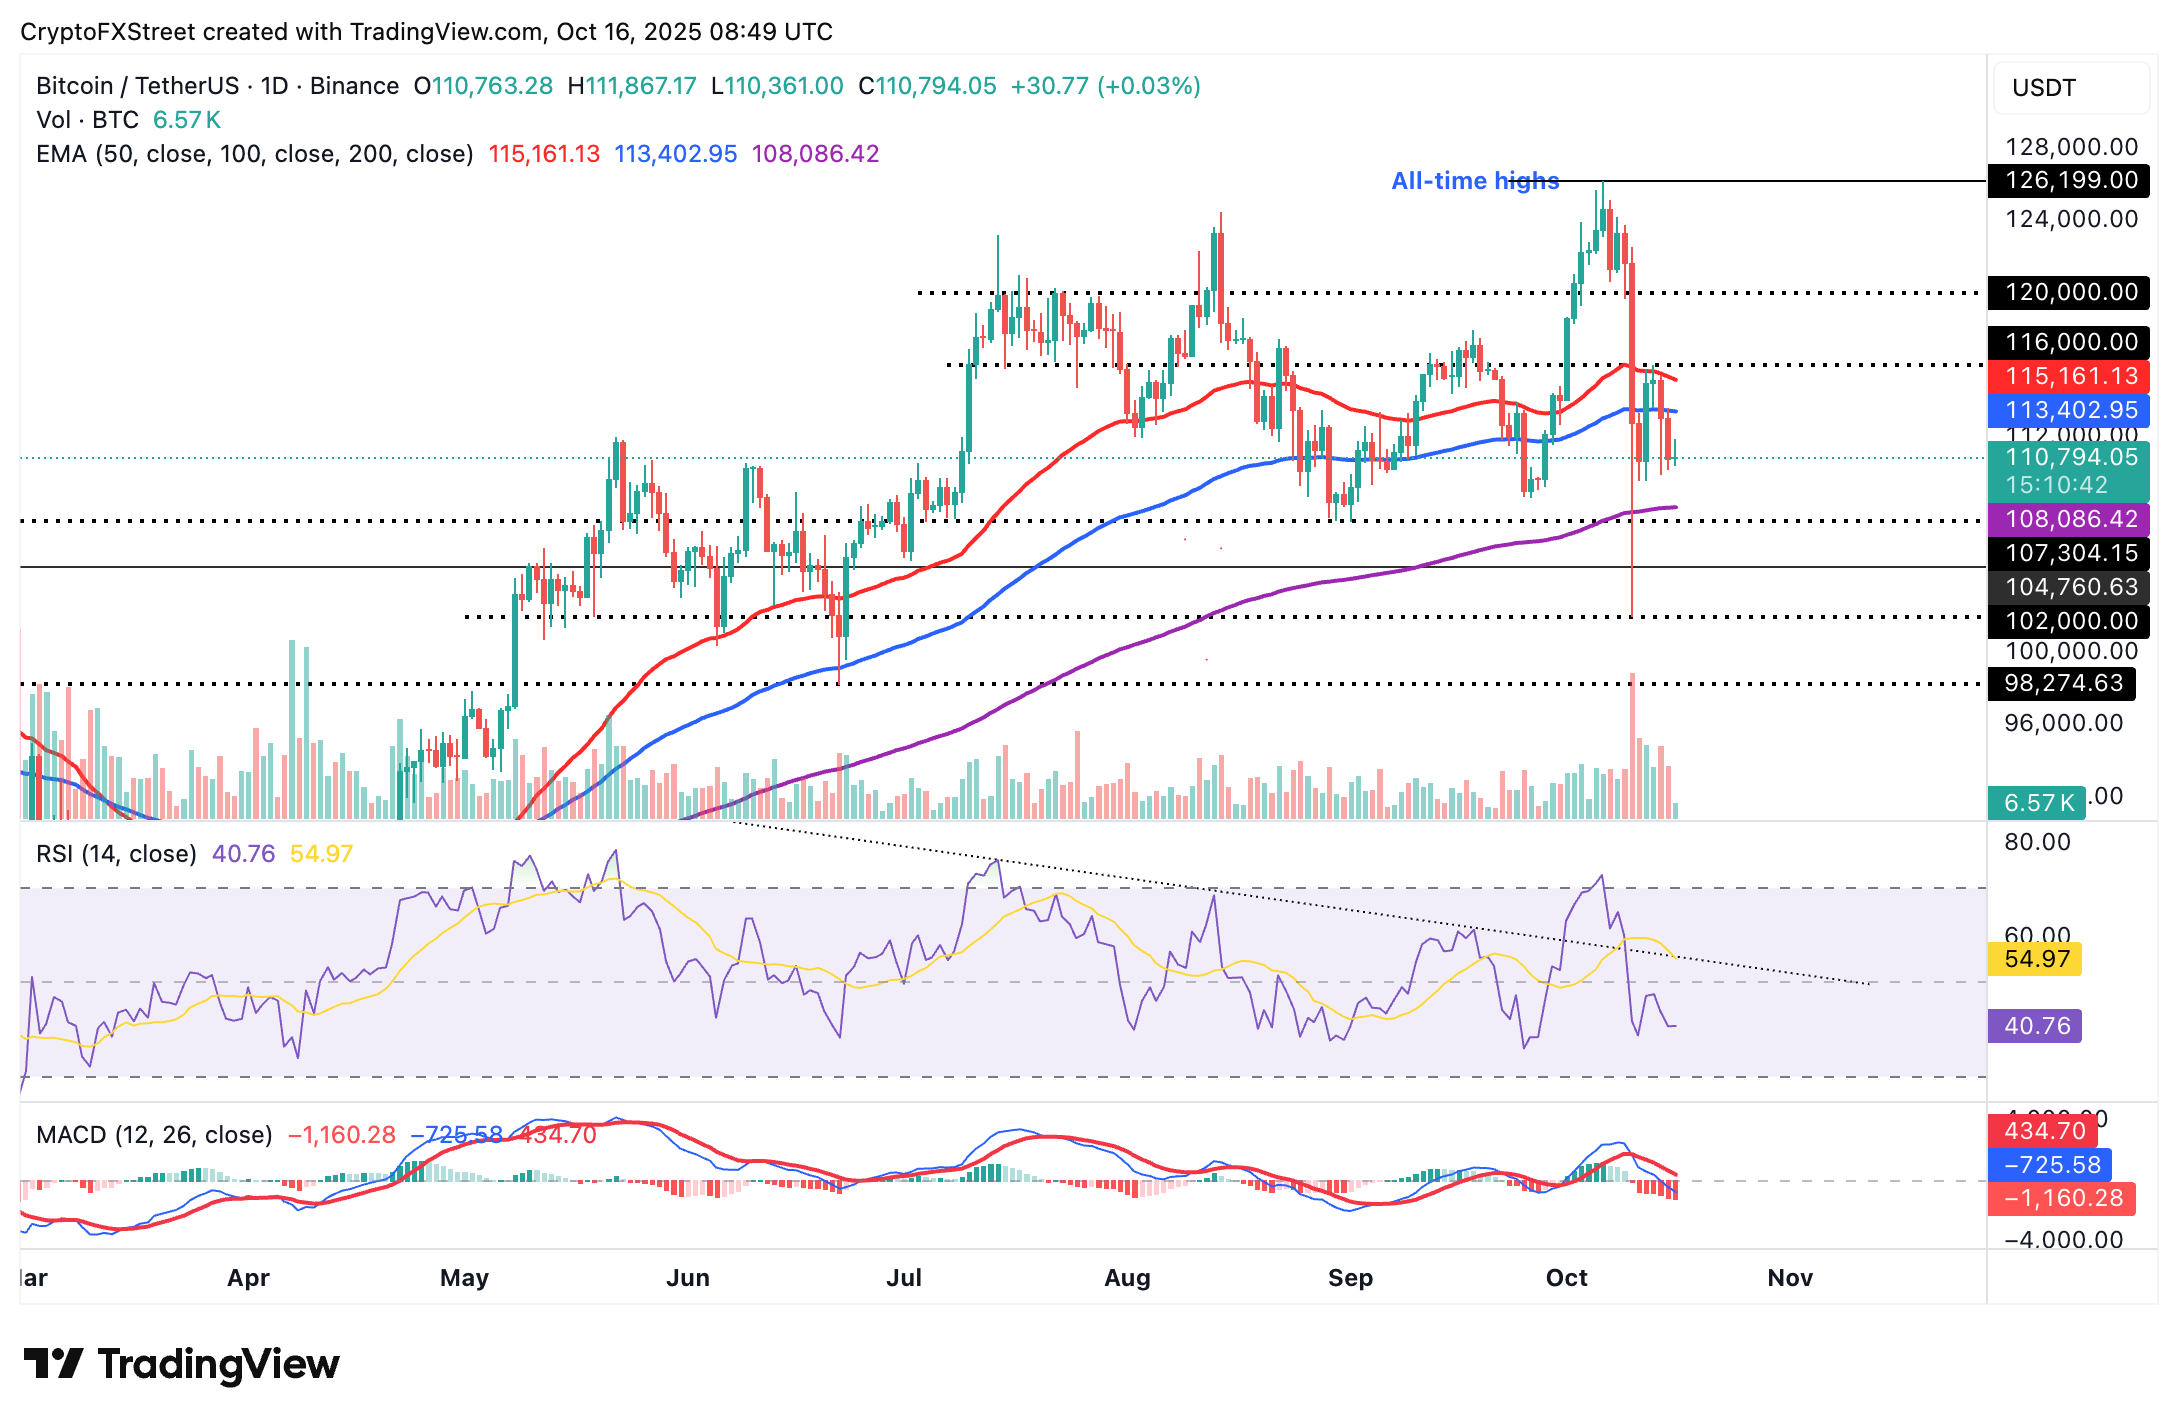
BTC/USDT daily chart
Altcoins update: Ethereum, XRP struggle to hold above support
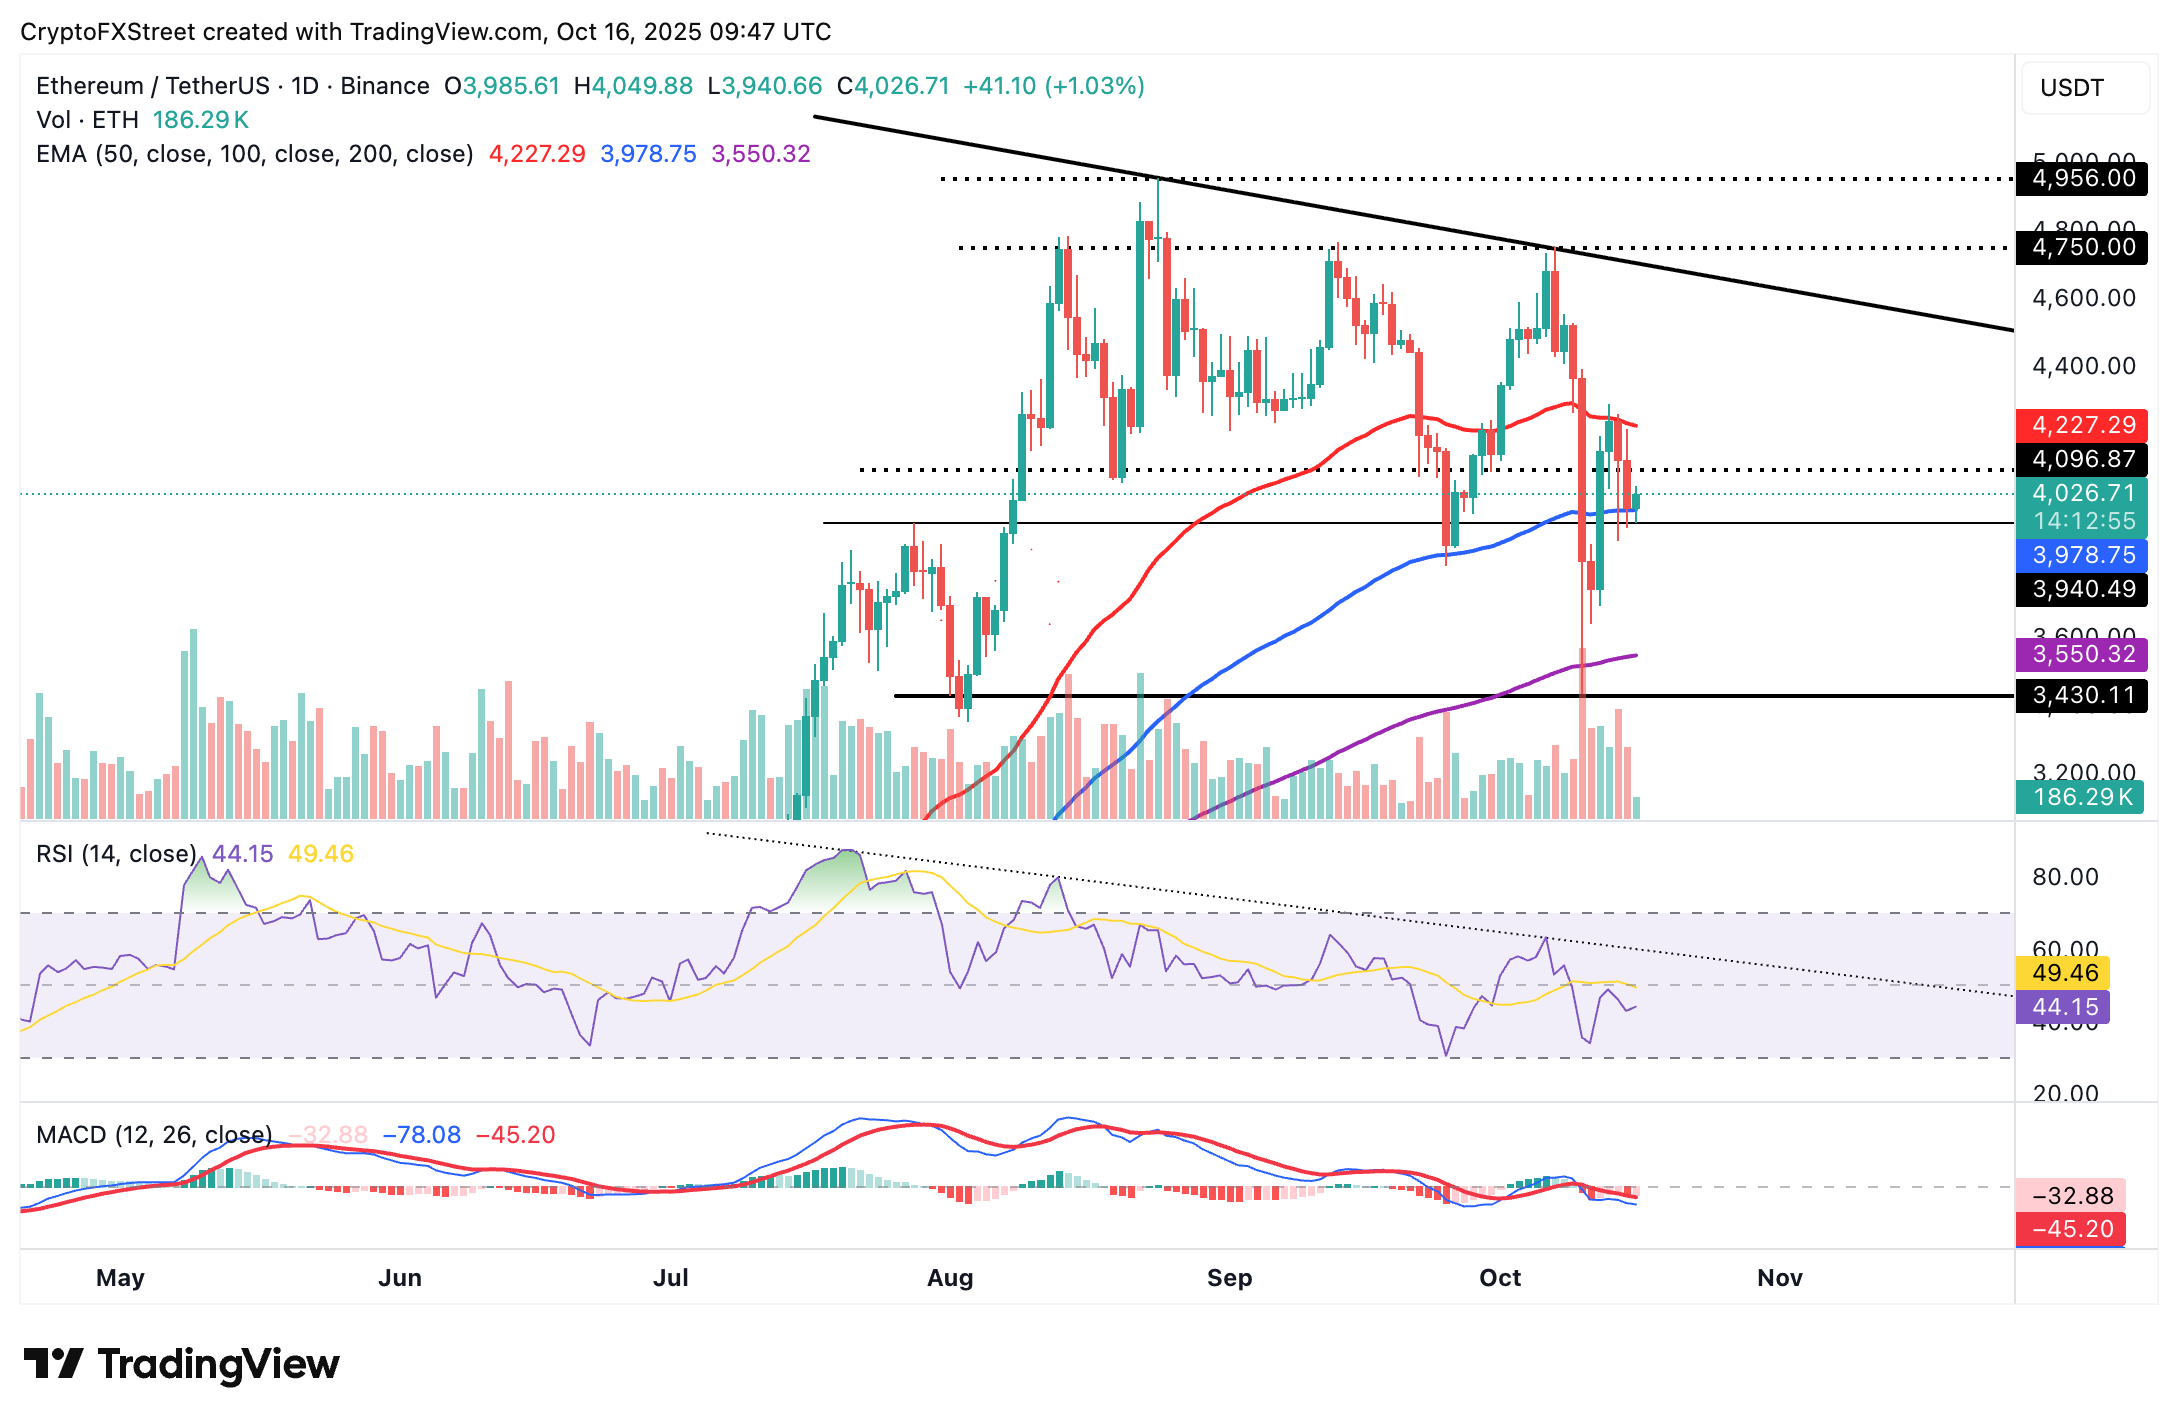
Ethereum is trading around the 100-day EMA currently at $3,978 amid an overall downtrend, reflecting a sticky bearish sentiment in the broader crypto market.
Key indicators lean bearishly on the daily chart, encouraging investors to reduce risk exposure in the short term. The MACD indicator has sustained a sell signal since Friday, with the blue line below the red signal line.
The RSI in the bearish region indicates that selling pressure is increasing. If the decline continues toward the oversold region, the ETH price could extend the decline to test $3,700 support before regaining bullish momentum.
ETH/USDT daily chart
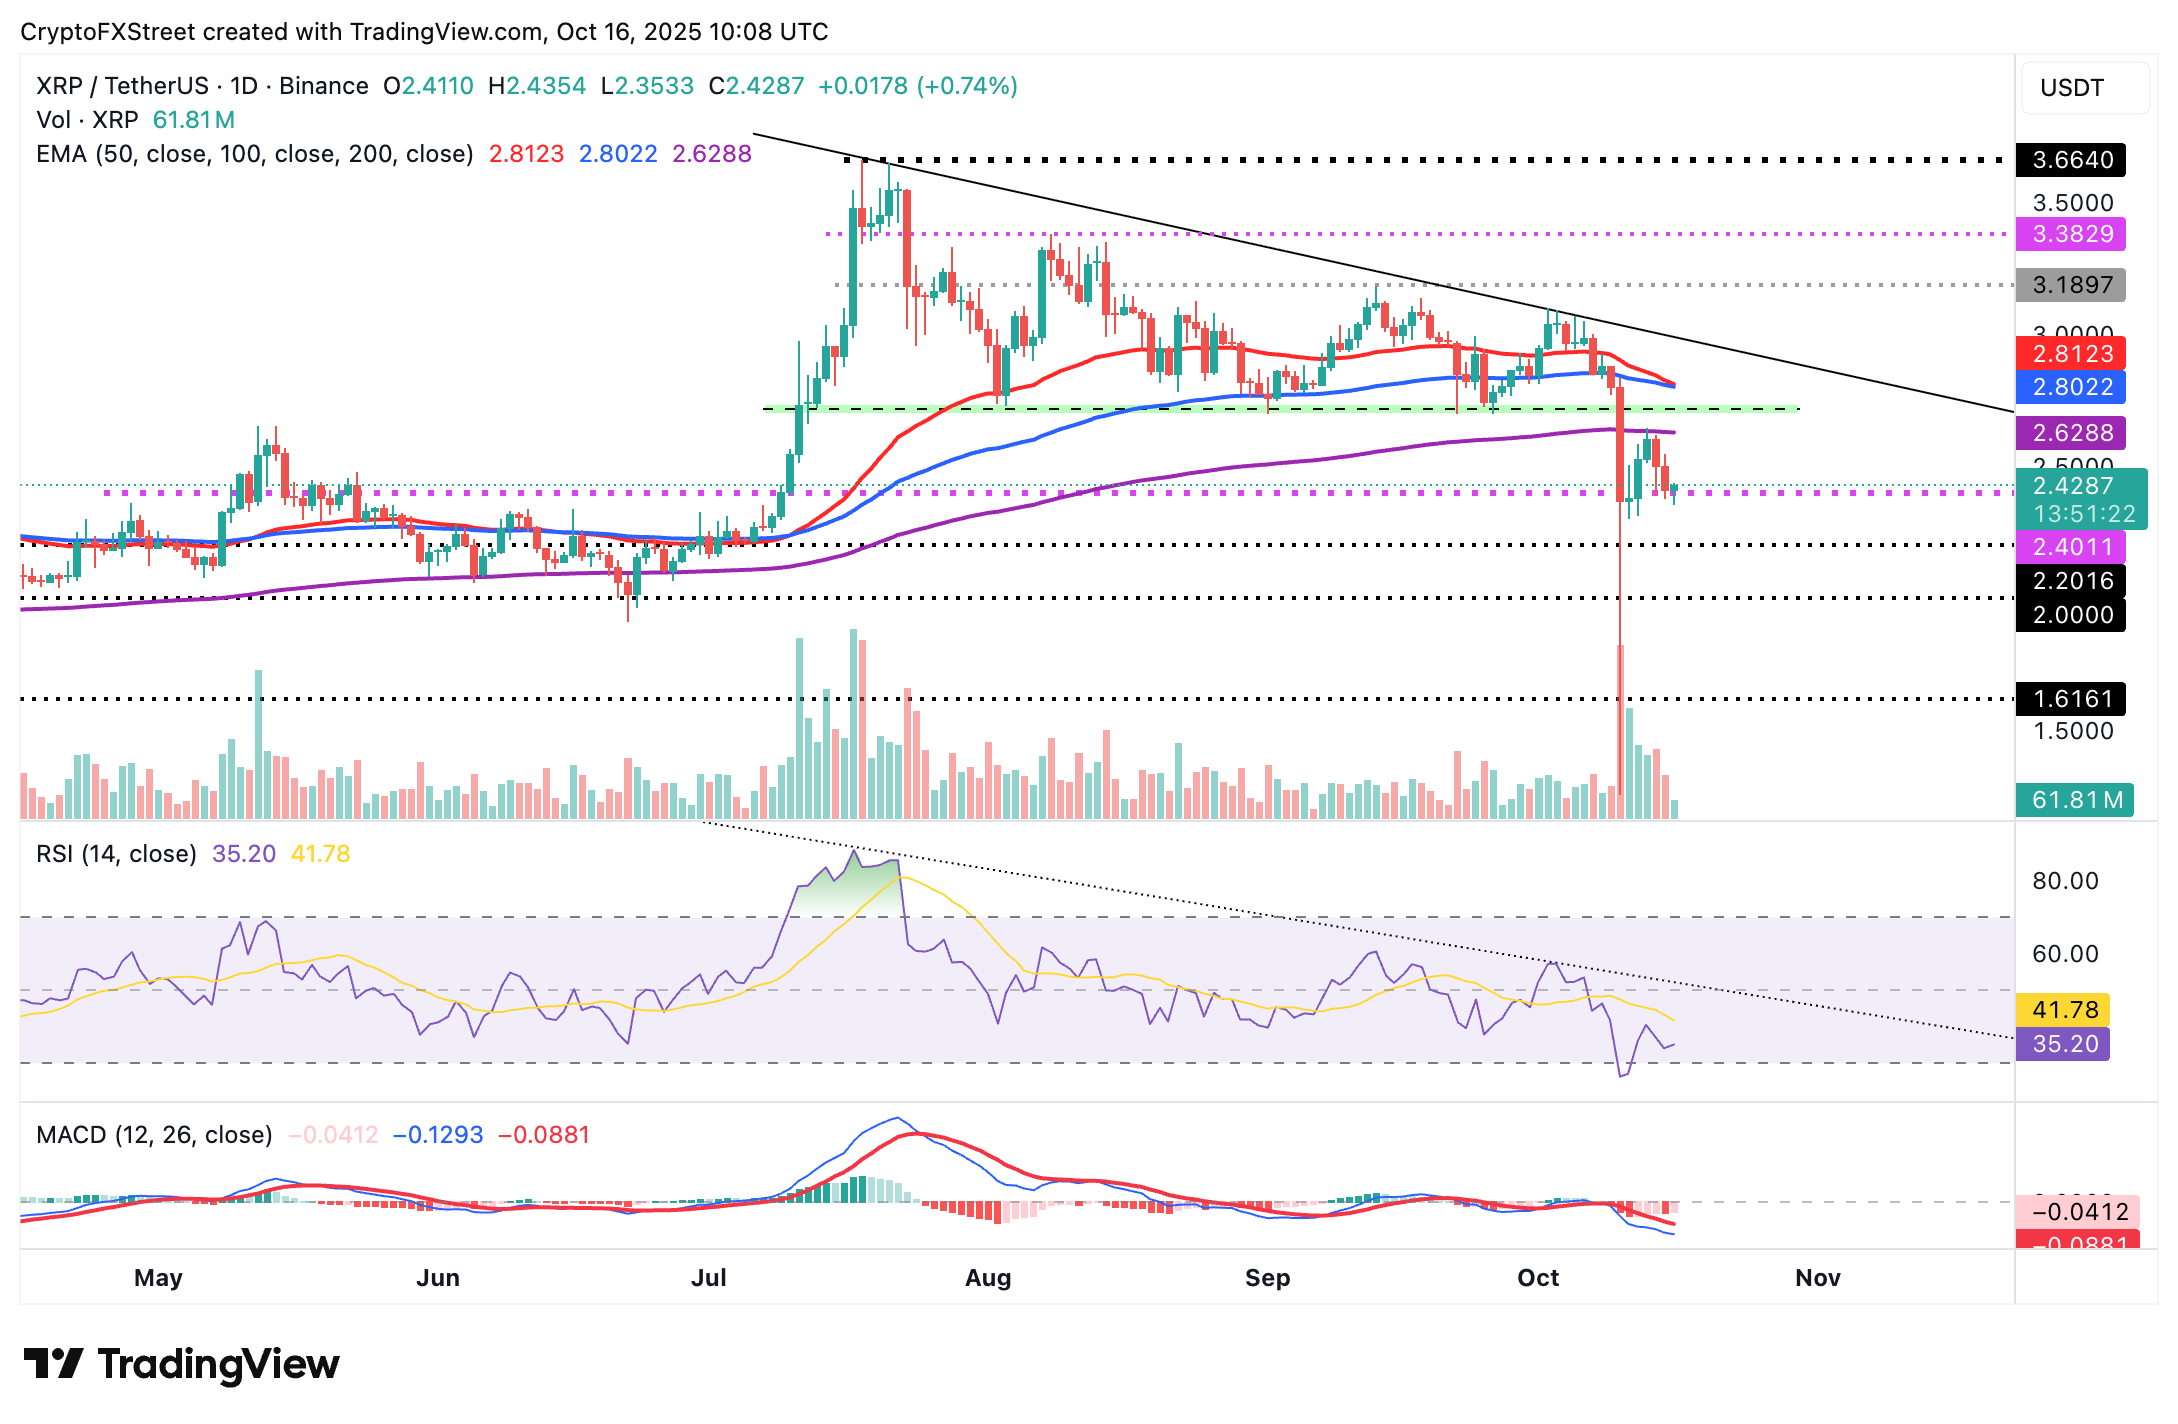
As for XRP, bulls are struggling to uphold support above $2.40 as downside risks persist. Investors are inclined to reduce their exposure to risk as the MACD indicator retains a sell signal triggered on October 9.
The RSI remains in the bearish region, suggesting that sellers have the upper hand. If the RSI extends the downtrend toward the oversold region, bearish momentum will increase. However, a sustained movement above the midline and approaching overbought territory would affirm the bullish grip.
XRP/USDT daily chart
XRP is at a crossroads, whereby breaking its short-term support at $2.40 could accelerate the decline to the next demand zone at $2.22, which was tested in early June. On the other hand, recovery above the 200-day EMA at $2.62 may reinforce the bullish grip as the odds of breaking above the $3.00 resistance increase significantly.
Bitcoin, altcoins, stablecoins FAQs
Bitcoin is the largest cryptocurrency by market capitalization, a virtual currency designed to serve as money. This form of payment cannot be controlled by any one person, group, or entity, which eliminates the need for third-party participation during financial transactions.
Altcoins are any cryptocurrency apart from Bitcoin, but some also regard Ethereum as a non-altcoin because it is from these two cryptocurrencies that forking happens. If this is true, then Litecoin is the first altcoin, forked from the Bitcoin protocol and, therefore, an “improved” version of it.
Stablecoins are cryptocurrencies designed to have a stable price, with their value backed by a reserve of the asset it represents. To achieve this, the value of any one stablecoin is pegged to a commodity or financial instrument, such as the US Dollar (USD), with its supply regulated by an algorithm or demand. The main goal of stablecoins is to provide an on/off-ramp for investors willing to trade and invest in cryptocurrencies. Stablecoins also allow investors to store value since cryptocurrencies, in general, are subject to volatility.
Bitcoin dominance is the ratio of Bitcoin's market capitalization to the total market capitalization of all cryptocurrencies combined. It provides a clear picture of Bitcoin’s interest among investors. A high BTC dominance typically happens before and during a bull run, in which investors resort to investing in relatively stable and high market capitalization cryptocurrency like Bitcoin. A drop in BTC dominance usually means that investors are moving their capital and/or profits to altcoins in a quest for higher returns, which usually triggers an explosion of altcoin rallies.
Recommended Articles


