
Crypto Today: Bitcoin, Ethereum, XRP hold key support, but downside risks linger
- Bitcoin bulls defend key support range between $120,000 and $121,000 as ETF inflows absorb selling pressure.
- Ethereum tests the 50-day EMA support as ETF inflows diminish, suggesting growing risk-off sentiment.
- XRP pares intraday losses but remains below a key descending trendline.
Bitcoin (BTC) trades above a short-term support range between $120,000 and $121,000 at the time of writing on Friday. Its technical outlook leans bearishly after correction from the record high of $126,199, reached on Monday. Key drivers of the pullback can be attributed to profit-taking and a sticky risk-off sentiment in the broader cryptomarket.
Altcoins, including Ethereum (ETH) and Ripple (XRP), are on the edge of critical support levels. Ethereum is facing diminishing demand for Exchange Traded Funds (ETFs) while XRP wobbles below the $3.00 level amid declining retail demand.
Data spotlight: Bitcoin ETFs attract steady inflows while Ethereum faces outflows
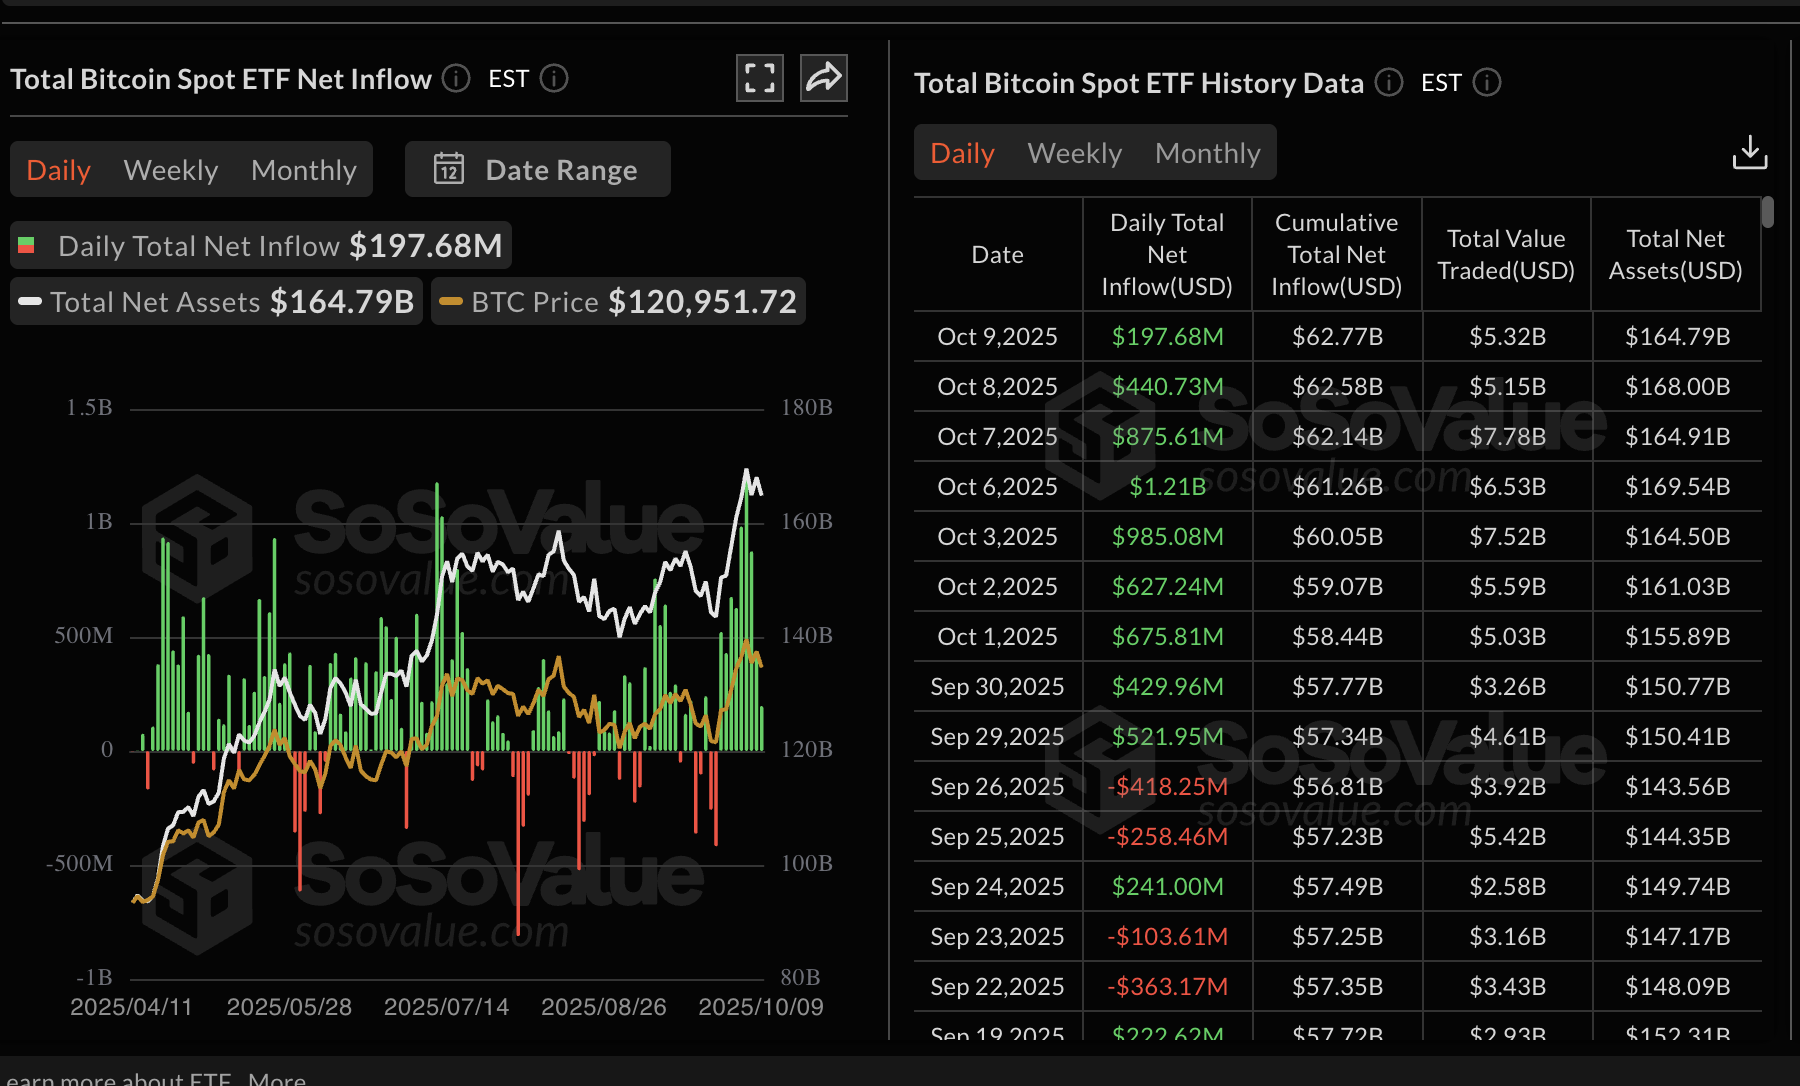
Bitcoin spot ETFs listed in the United States (US) marked nine consecutive days of inflows on Thursday, with $198 million, reflecting steady demand from institutional investors.
The cumulative total net inflow is near $63 billion, with net assets totaling $165 billion. ETFs have been a significant driver of Bitcoin’s rally, often signaling growing investor interest. If inflows continue trickling in, the odds of a rebound toward the all-time high will significantly increase as selling pressure is absorbed.
Bitcoin ETF stats | source: CoinGlass
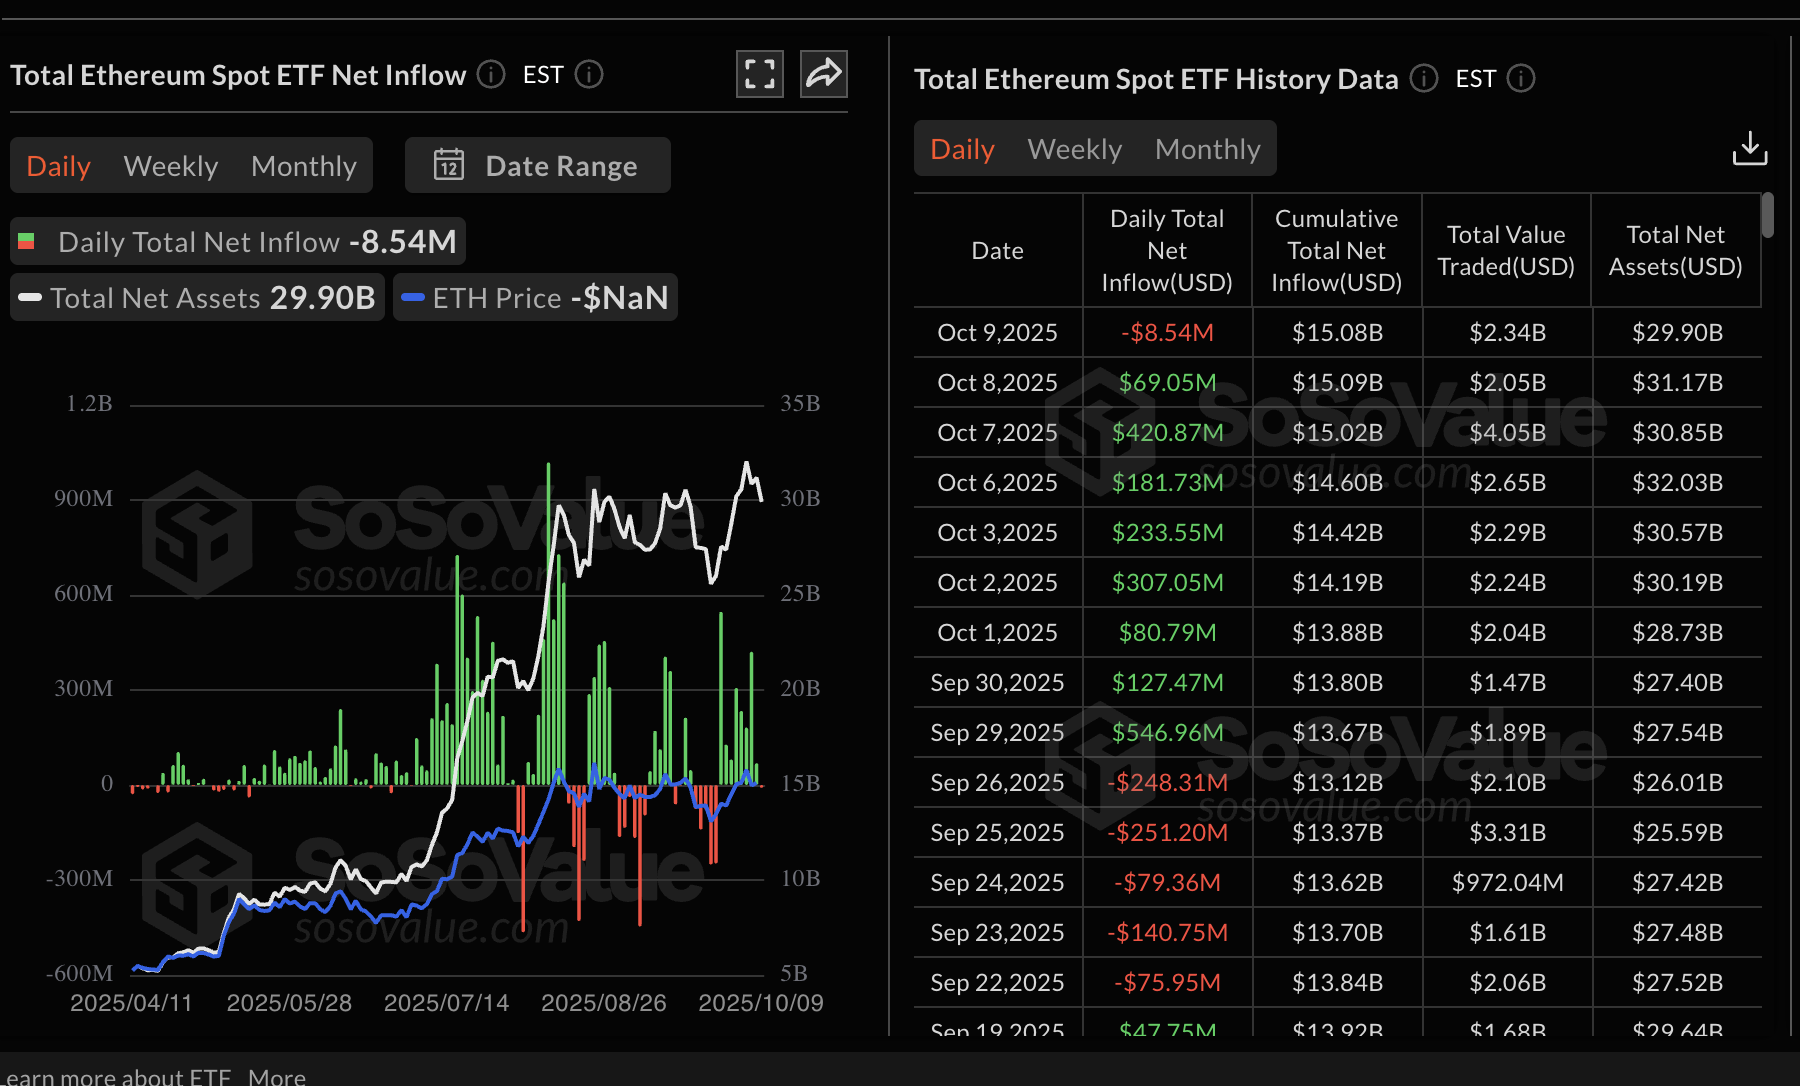
On the other hand, Ethereum spot ETFs experienced outflows totaling $8.54 million on Thursday, indicating the risk-off sentiment surrounding the largest smart contracts token. BlackRock’s ETHA was the only ETF out of the nine licensed in the US with a net inflow of approximately $39 million.
Cumulatively, Ethereum ETFs have a total net inflow of $15 billion with net assets nearing the $30 billion mark.
Ethereum ETF stats | source: CoinGlass
Chart of the day: Can Bitcoin resume its uptrend?
Bitcoin has sustained a general downtrend since reaching its all-time high of $126,199 on Monday. Despite increasing selling pressure due to profit-taking and a lack of conviction in the uptrend, the short-term support range between $120,000 and $121,000 is keeping BTC’s downside protected.
The Relative Strength Index (RSI), currently facing downward at 60 on the daily chart, indicates that bullish momentum is fadding, which could pave the way for losses below the support range.
Traders will look out for a potential sell signal from the Moving Average Convergence Divergence (MACD) indicator to gauge risk sentiment before leaning fully bearish. Such a signal manifests when the blue MACD line crosses and holds below the red signal line, encouraging investors to reduce risk exposure.
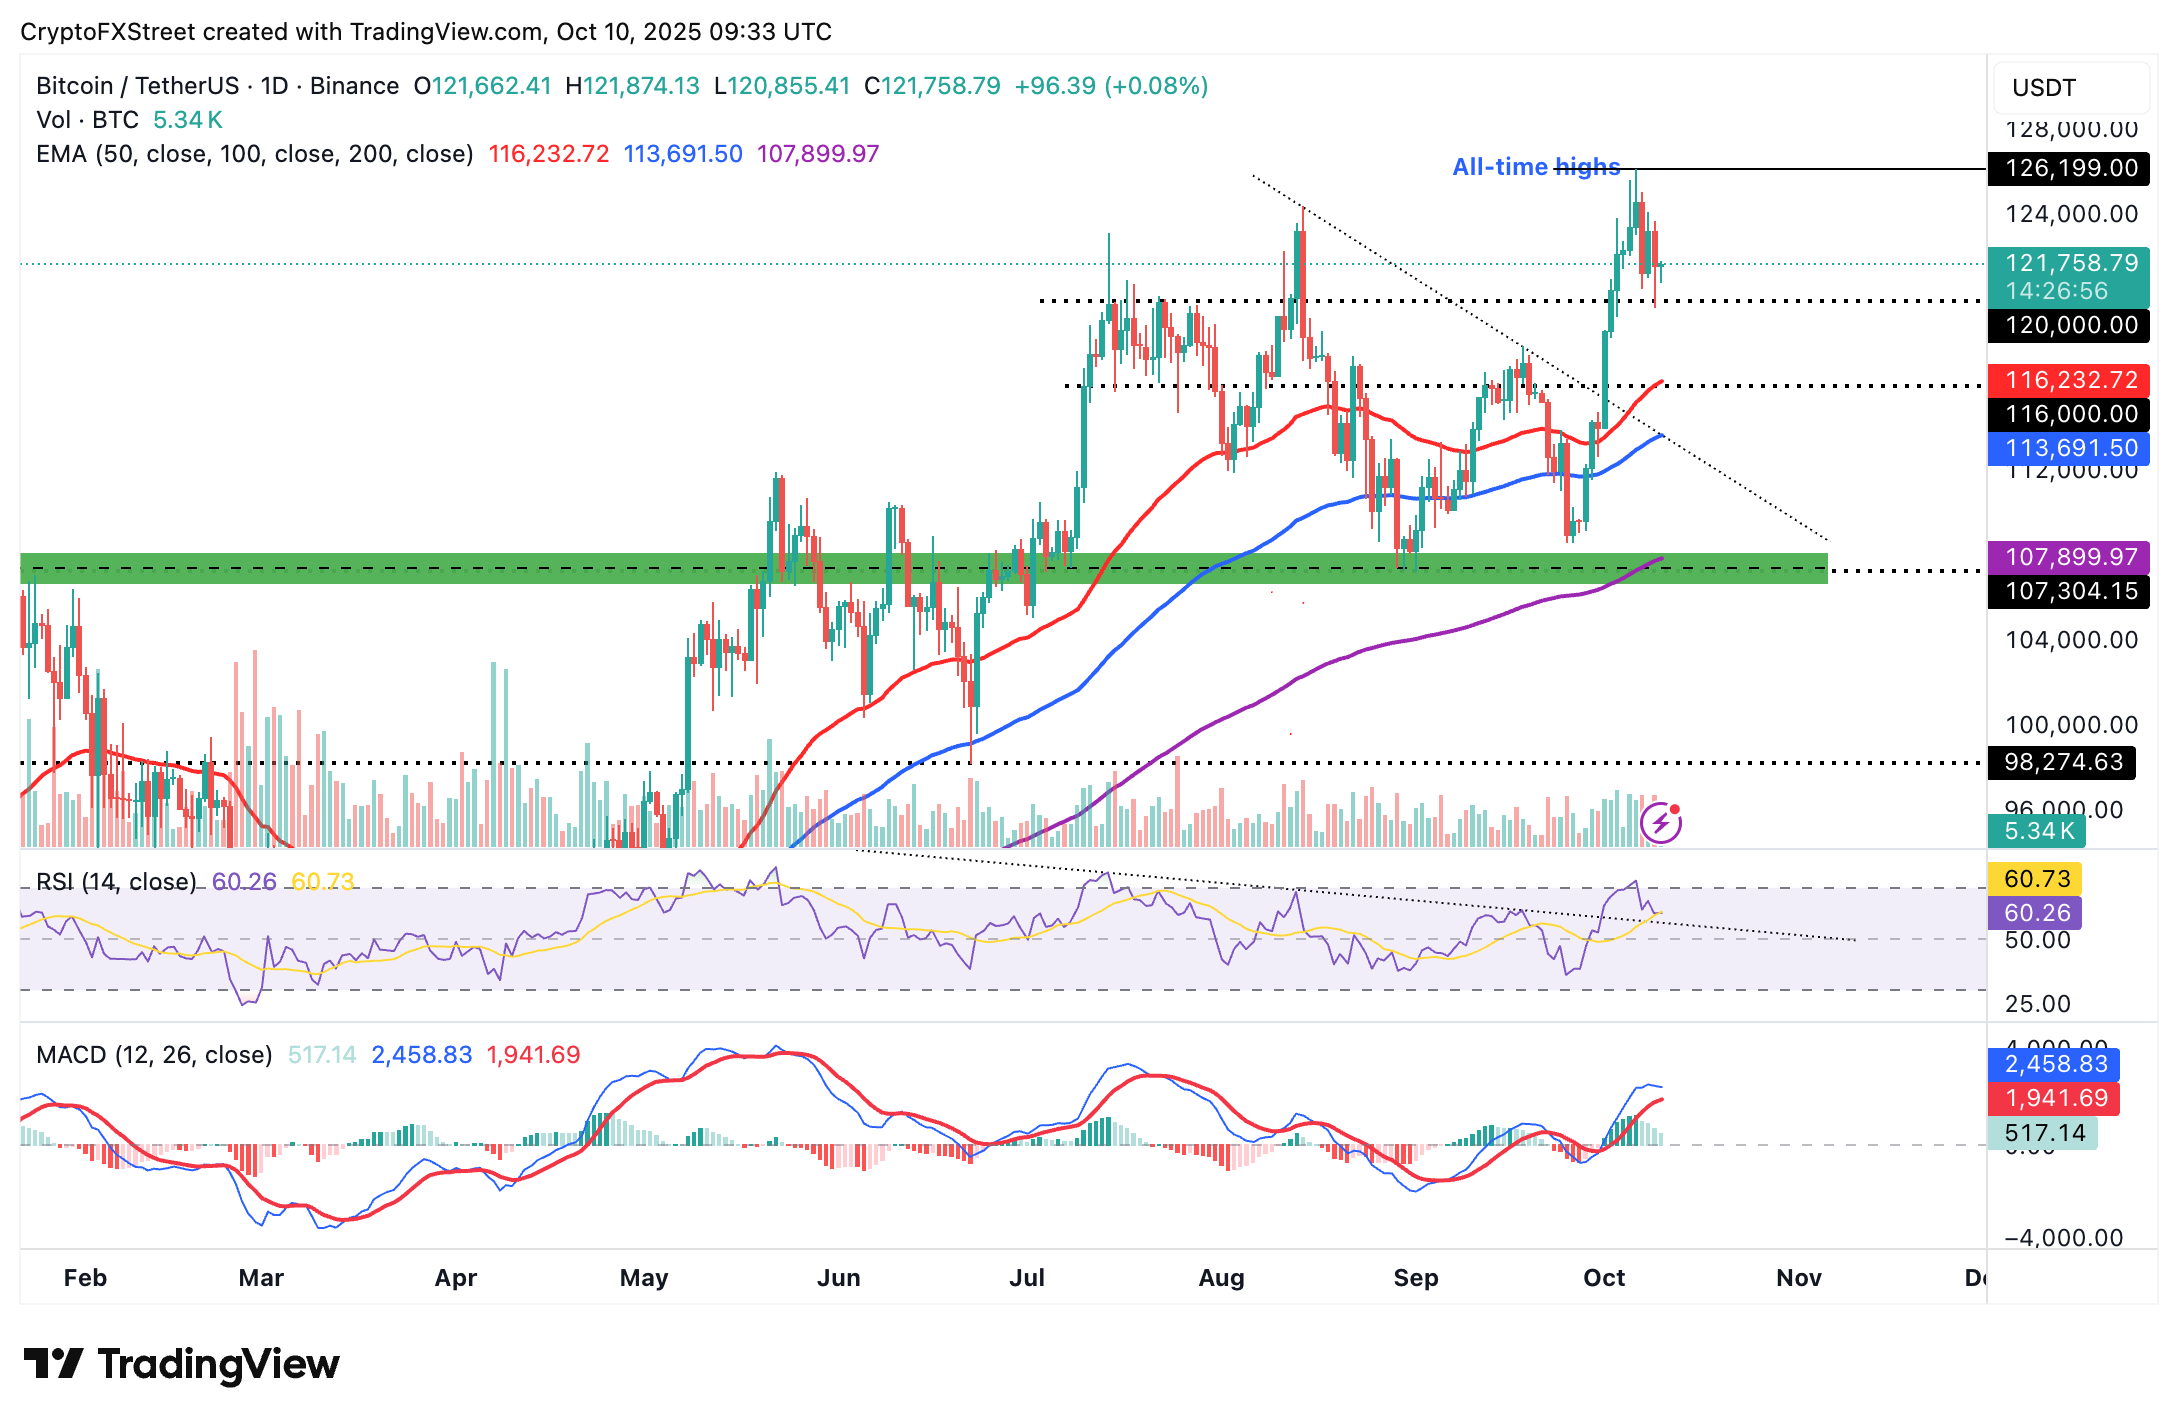
BTC/USDT daily chart
Key levels of interest for traders are the 50-day Exponential Moving Average (EMA) at $116,232, the 100-day EMA at $113,691, and the record high of $126,199 if investors buy the current dip, pushing the BTC price higher.
Altcoins update: Ethereum, XRP testing key support
Ethereum declines to test the 50-day EMA at $4,295 amid persistent risk-off sentiment, which follows the rejection from $4,750 on Tuesday. The path of least resistance is downward, as indicated by the downtrending RSI positioned below the midline on the daily chart.
If the RSI drops further toward the oversold region, bears will increase their grip, driving the price of ETH toward the next key support at the 100-day EMA, currently at $3,979. The MACD indicator is on the verge of validating a sell signal if the blue line crosses and settles below the red line.
Still, traders may anticipate an immediate rebound from the 50-day EMA at $4,295 if investors buy the dip, which could contribute to the tailwind on the Bitcoin price. Key milestones to look out for include breaking the hurdle at $4,750 and reaching the record high of $4,956, which was set in late August.
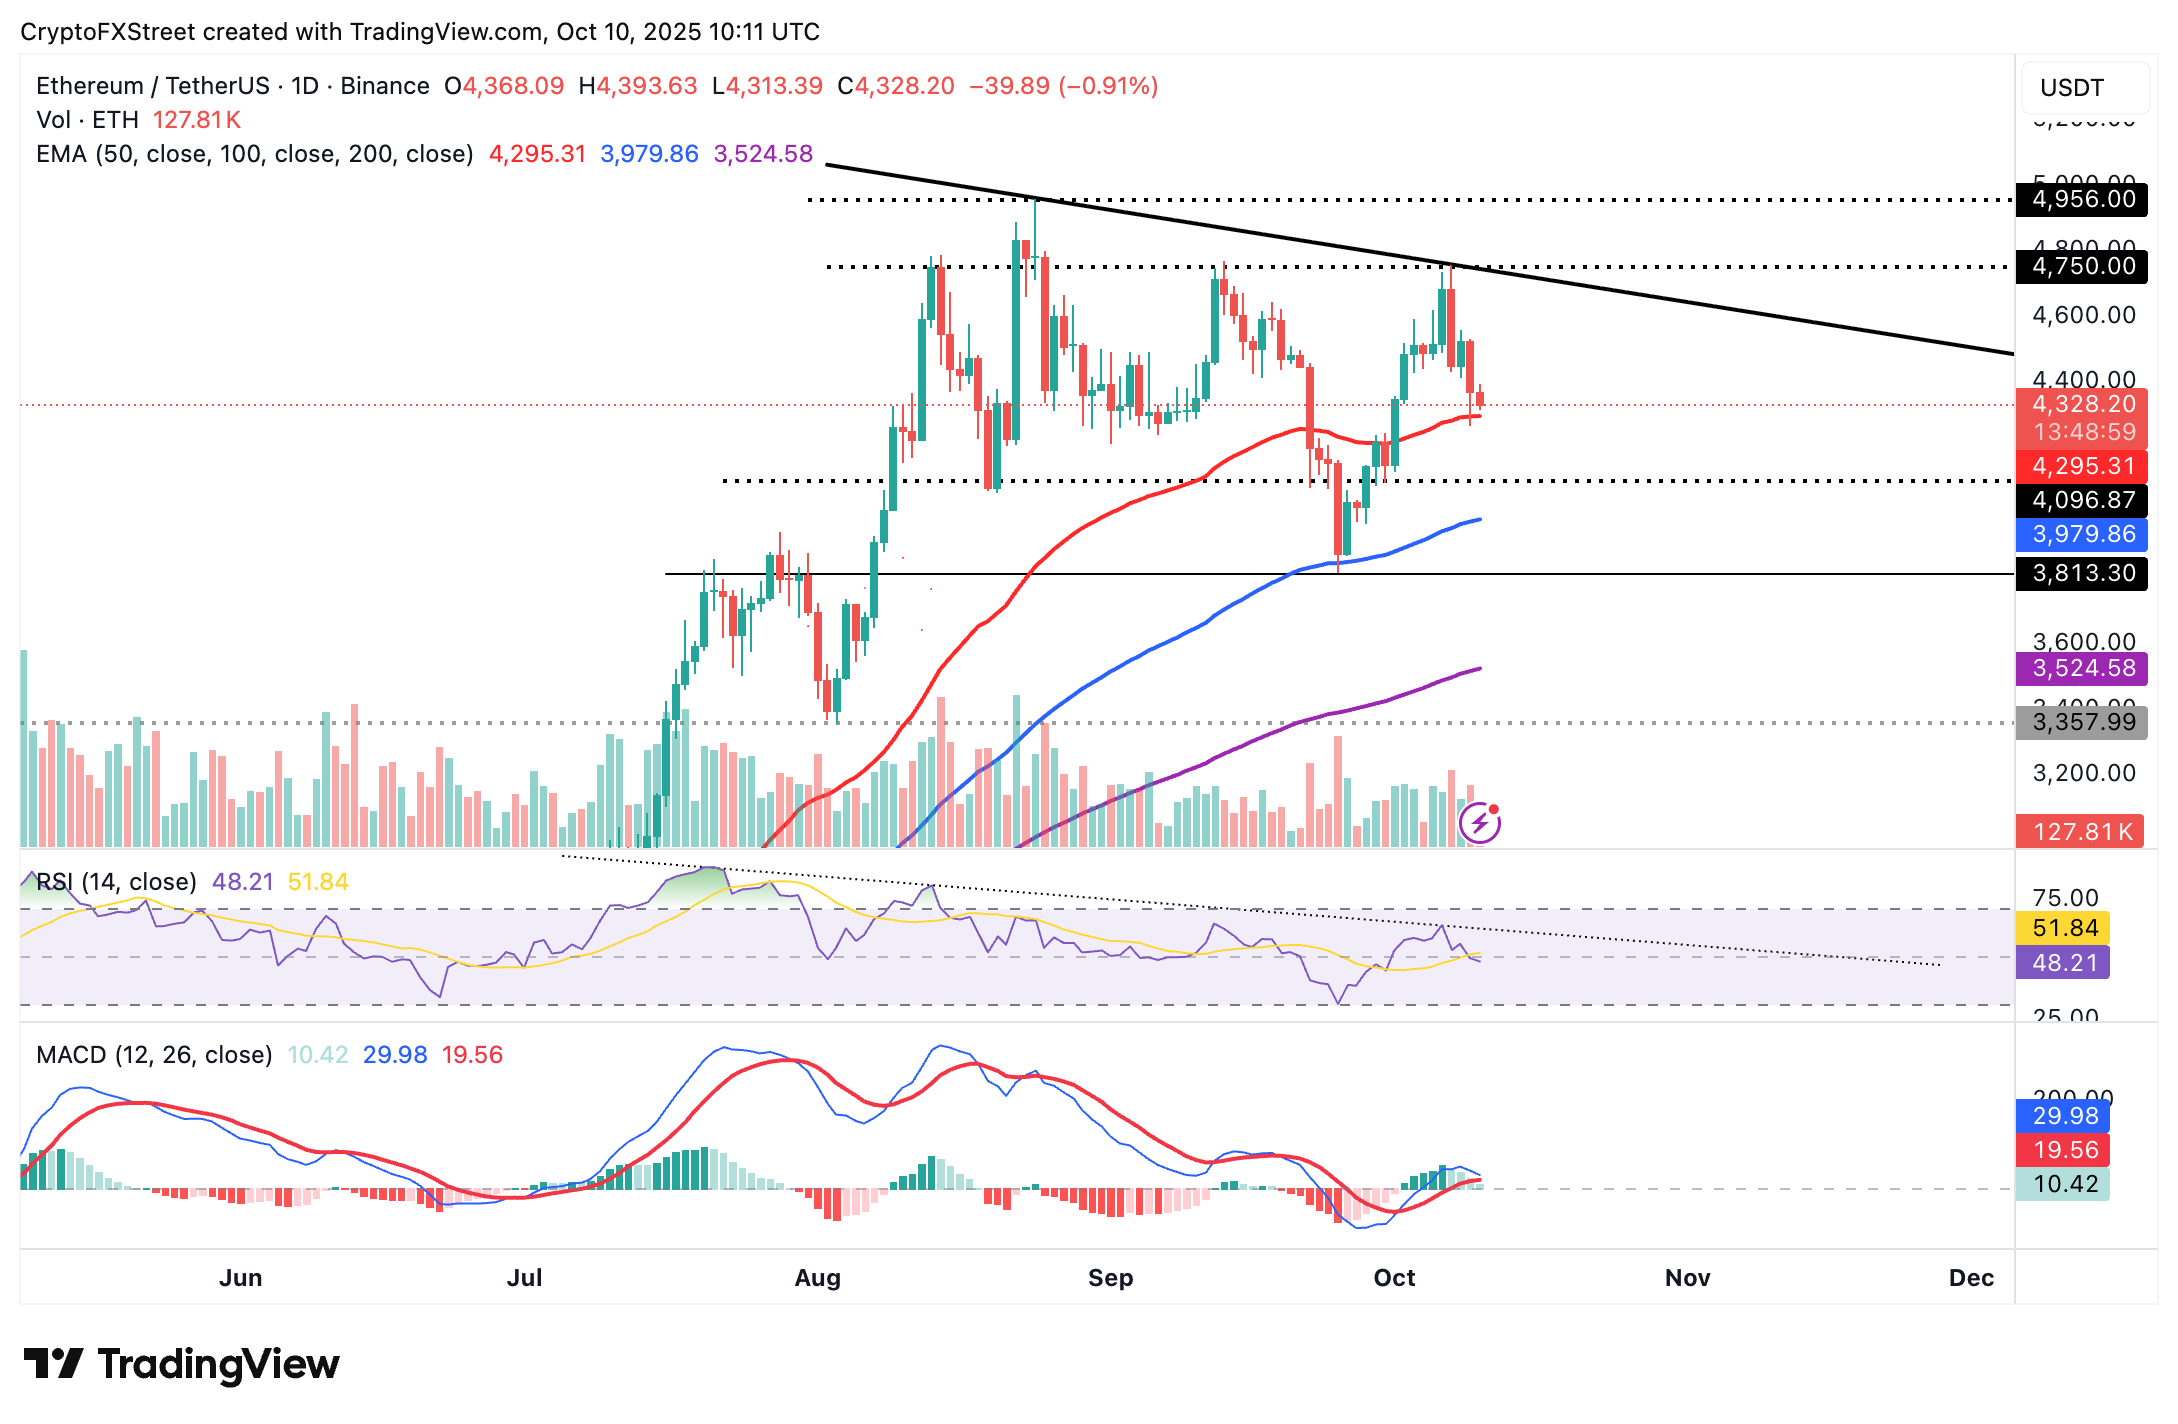
ETH/USDT daily chart
As for XRP, bulls are paring intraday losses following the correction on Thursday to $2.76. The cross-border money remittance token is trading at $2.81 at the time of writing on Friday, as buyers attempt to recoup losses.
A sell signal from the MACD indicator has been sustained since Thursday, suggesting that bears still have the upper hand. If investors heed the sell signal and reduce risk exposure, XRP could resume the downtrend toward the short-term support at $2.70, tested in late September, and the 200-day EMA at $2.64.
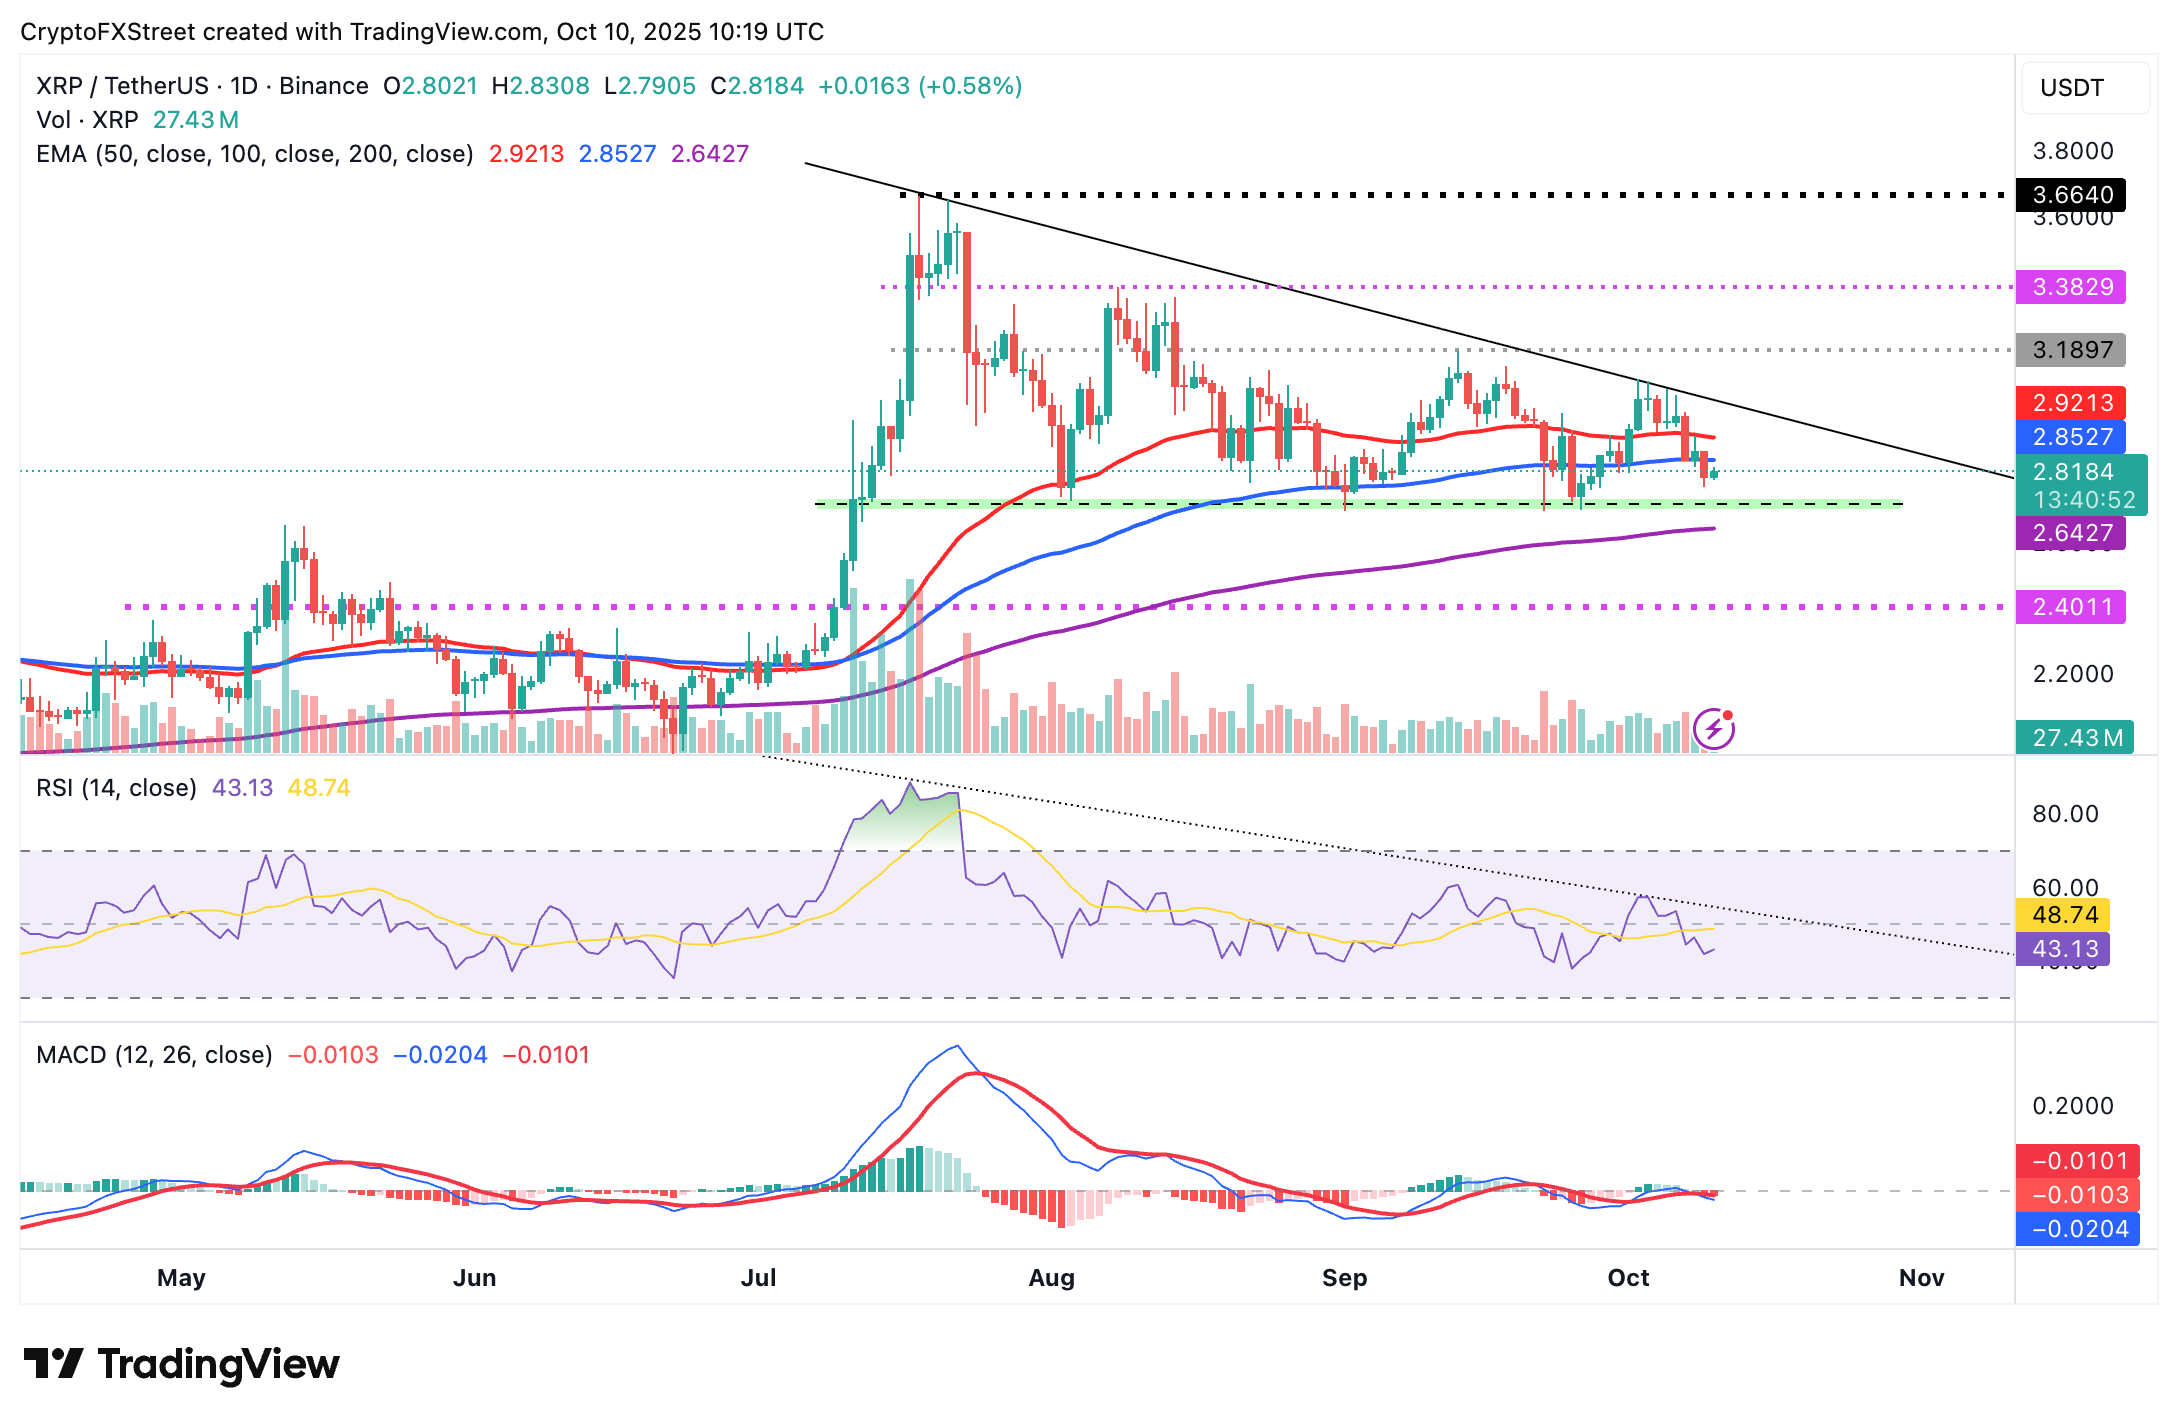
XRP/USDT daily chart
On the contrary, a sustained move above the 100-day EMA resistance at $2.85 and the 50-day EMA at $2.92 may increase the probability of the XRP price breaking the downtrend and pushing for gains above $3.00.
Bitcoin, altcoins, stablecoins FAQs
Bitcoin is the largest cryptocurrency by market capitalization, a virtual currency designed to serve as money. This form of payment cannot be controlled by any one person, group, or entity, which eliminates the need for third-party participation during financial transactions.
Altcoins are any cryptocurrency apart from Bitcoin, but some also regard Ethereum as a non-altcoin because it is from these two cryptocurrencies that forking happens. If this is true, then Litecoin is the first altcoin, forked from the Bitcoin protocol and, therefore, an “improved” version of it.
Stablecoins are cryptocurrencies designed to have a stable price, with their value backed by a reserve of the asset it represents. To achieve this, the value of any one stablecoin is pegged to a commodity or financial instrument, such as the US Dollar (USD), with its supply regulated by an algorithm or demand. The main goal of stablecoins is to provide an on/off-ramp for investors willing to trade and invest in cryptocurrencies. Stablecoins also allow investors to store value since cryptocurrencies, in general, are subject to volatility.
Bitcoin dominance is the ratio of Bitcoin's market capitalization to the total market capitalization of all cryptocurrencies combined. It provides a clear picture of Bitcoin’s interest among investors. A high BTC dominance typically happens before and during a bull run, in which investors resort to investing in relatively stable and high market capitalization cryptocurrency like Bitcoin. A drop in BTC dominance usually means that investors are moving their capital and/or profits to altcoins in a quest for higher returns, which usually triggers an explosion of altcoin rallies.
Recommended Articles


