


Cardano Price Forecast: Steady rise backs triangle upward breakout as bullish bets surge
- Cardano holds a steady rise within a triangle pattern, with bulls targeting a potential breakout.
- Charles Hoskinson backs Ergo amid recent HTX delisting, proposing a partner chain development.
- Cardano Open Interest surge indicates increased demand as long positions build up.
Cardano (ADA) price trades above $0.90 at press time on Friday, close to a symmetrical triangle pattern’s resistance trendline on the daily chart. While derivative data suggests that bulls are anticipating a potential breakout run, Charles Hoskinson, Cardano’s founder, extends support to Ergo, a Proof-of-Work blockchain, through a partner chain proposal.
Charles Hoskinson proposes an Ergo partner chain
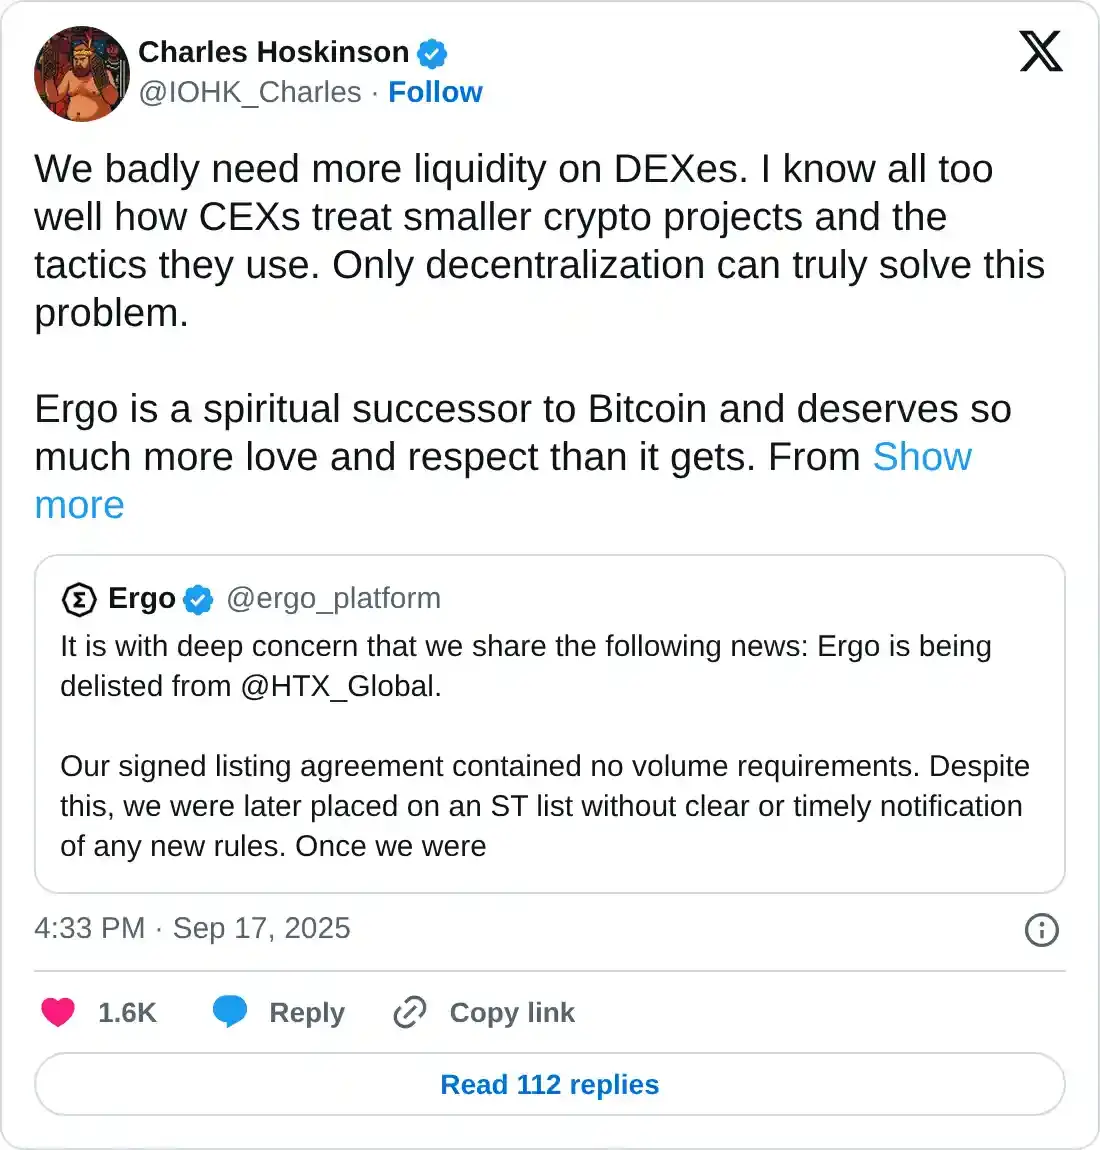
Charles Hoskinson shed light on the liquidity required on Decentralized Exchanges (DEXs) and the financial pressure imposed on small crypto projects by Centralized Exchanges (CEXs) by reposting an X post by Ergo on Wednesday. In this post, Ergo has made claims that HTX demanded $100,000 in marketing fees, and the refusal to pay the fees led to delisting.
Hoskinson offered Ergo a partner chain development in a show of support against the delisting, which aligned with ADA rising 3.81% on Wednesday. A partner chain will help Ergo leverage Cardano’s infrastructure for a merged mining process, which could increase demand for both projects, faster transactions, and dual rewards for the miners.
Bullish ADA bets on the rise
A surge in Open Interest (OI) and long positions often signals increased confidence among traders. CoinGlass data shows that the ADA OI has risen to $1.87 billion, from $1.78 billion on Thursday. This indicates a boost in capital inflows in the ADA derivatives, which often signals a risk-on sentiment among traders.
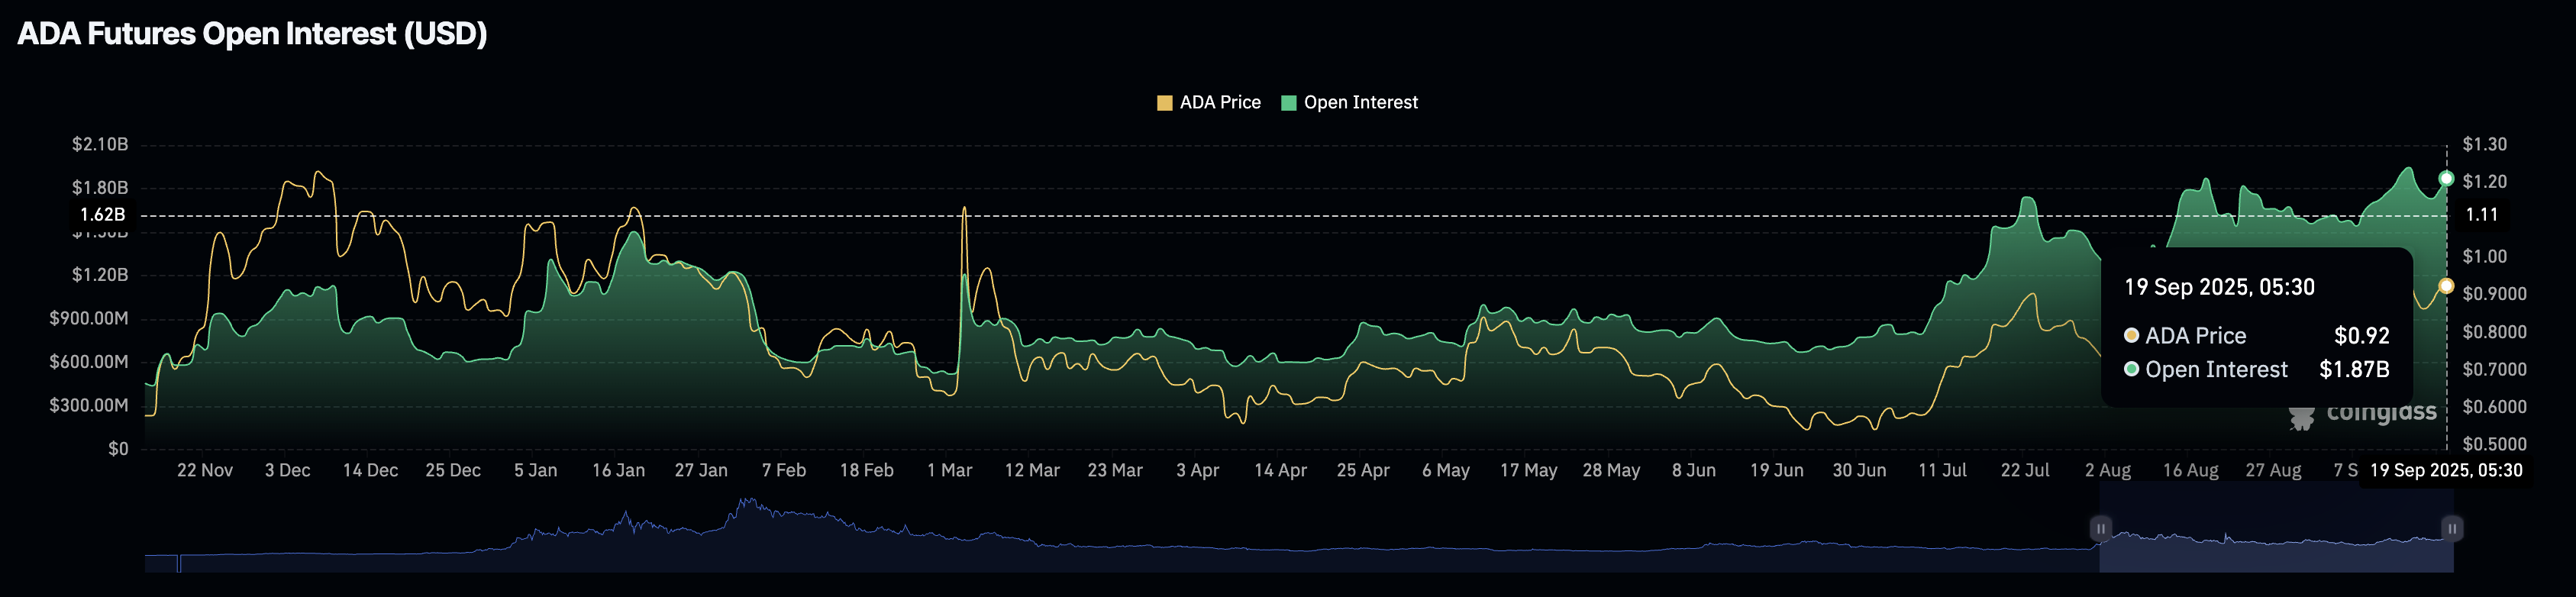
ADA Open Interest. Source: CoinGlass
Validating the sentiment, the Taker buy/sell volume displays a significant rise in long positions to 51.31%, from 47.06% on Monday.
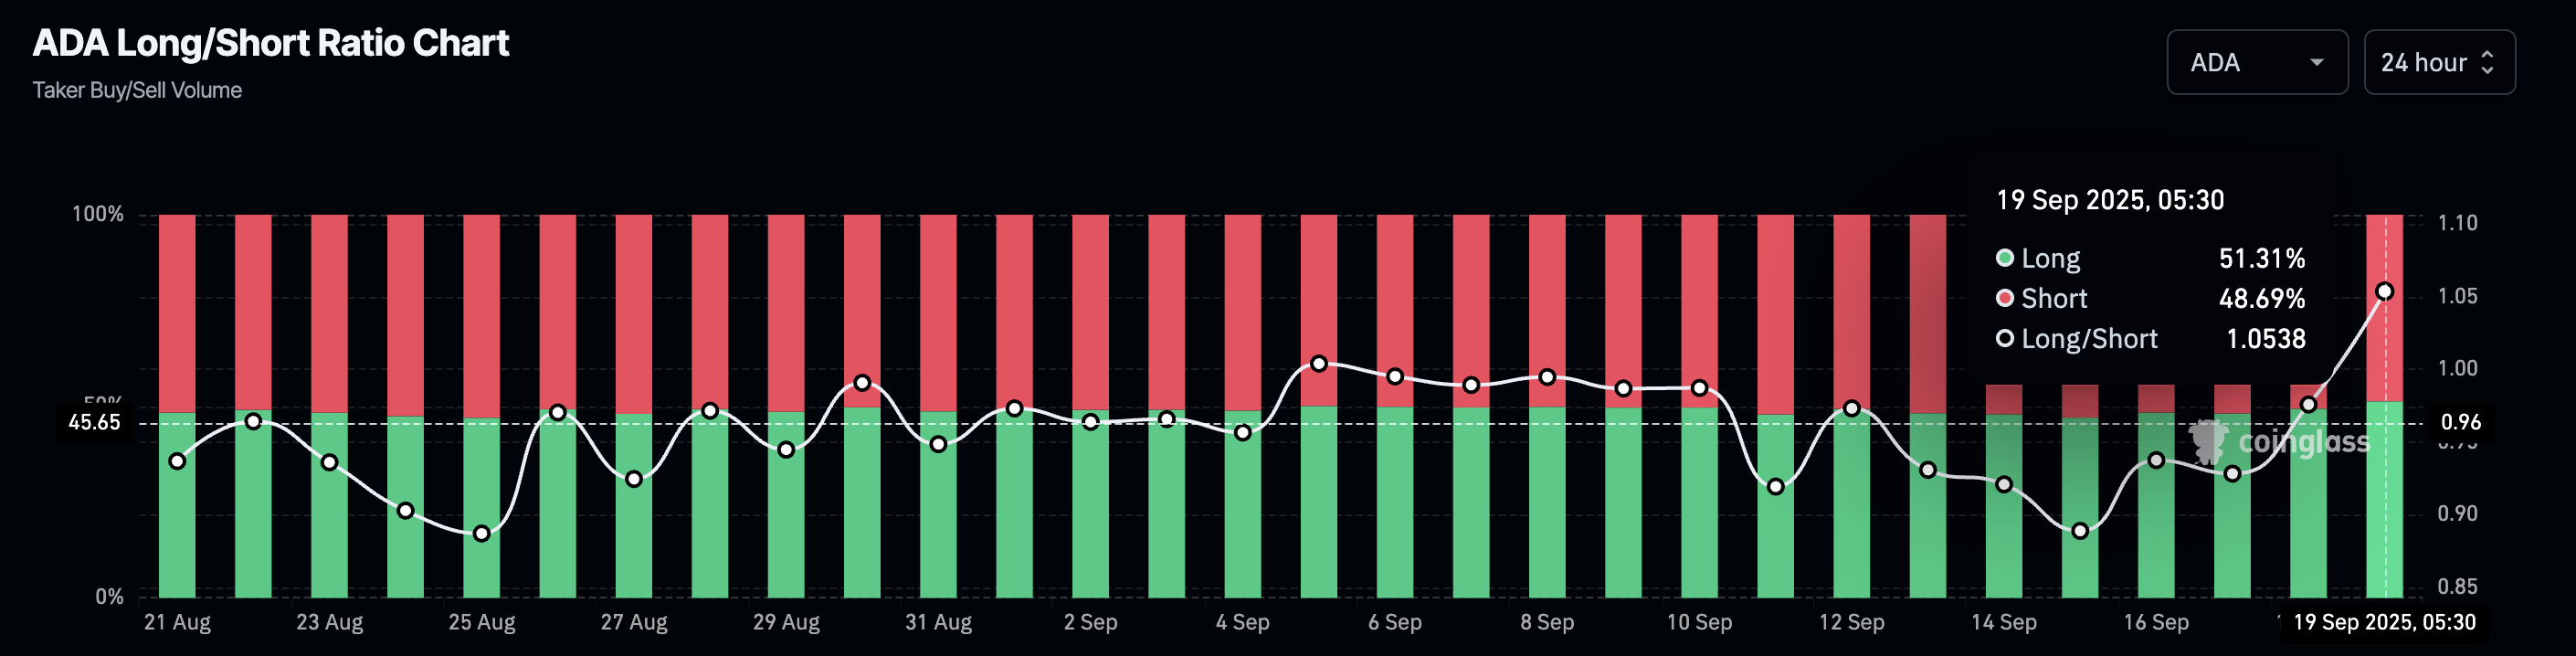
ADA Long/Short ratio. Source: CoinGlass
Cardano’s recovery eyes triangle breakout to extend gains
Cardano edges higher by nearly 1% at press time on Friday, advancing for the fourth consecutive day. The recovery run has surpassed the 200-day Exponential Moving Average (EMA) and the 50% retracement level, drawn from $1.3264 on December 3 to $0.5100 on June 22, at $0.9182.
More so, the recovery run now challenges the overhead trendline of a symmetrical triangle pattern on the daily chart, near $0.9500. A decisive close above this level would confirm the pattern breakout, making the 61.8% Fibonacci retracement level the primary target at $1.0145.
The Relative Strength Index (RSI) at 60 bounces off the halfway line, indicating a rise in buying pressure. However, the prevailing downtrend in RSI highlights a potential reversal risk.
Still, the Moving Average Convergence Divergence (MACD) indicator displays a steady rise in the average line with a fresh wave of green histogram bars. This suggests an increase in bullish momentum.
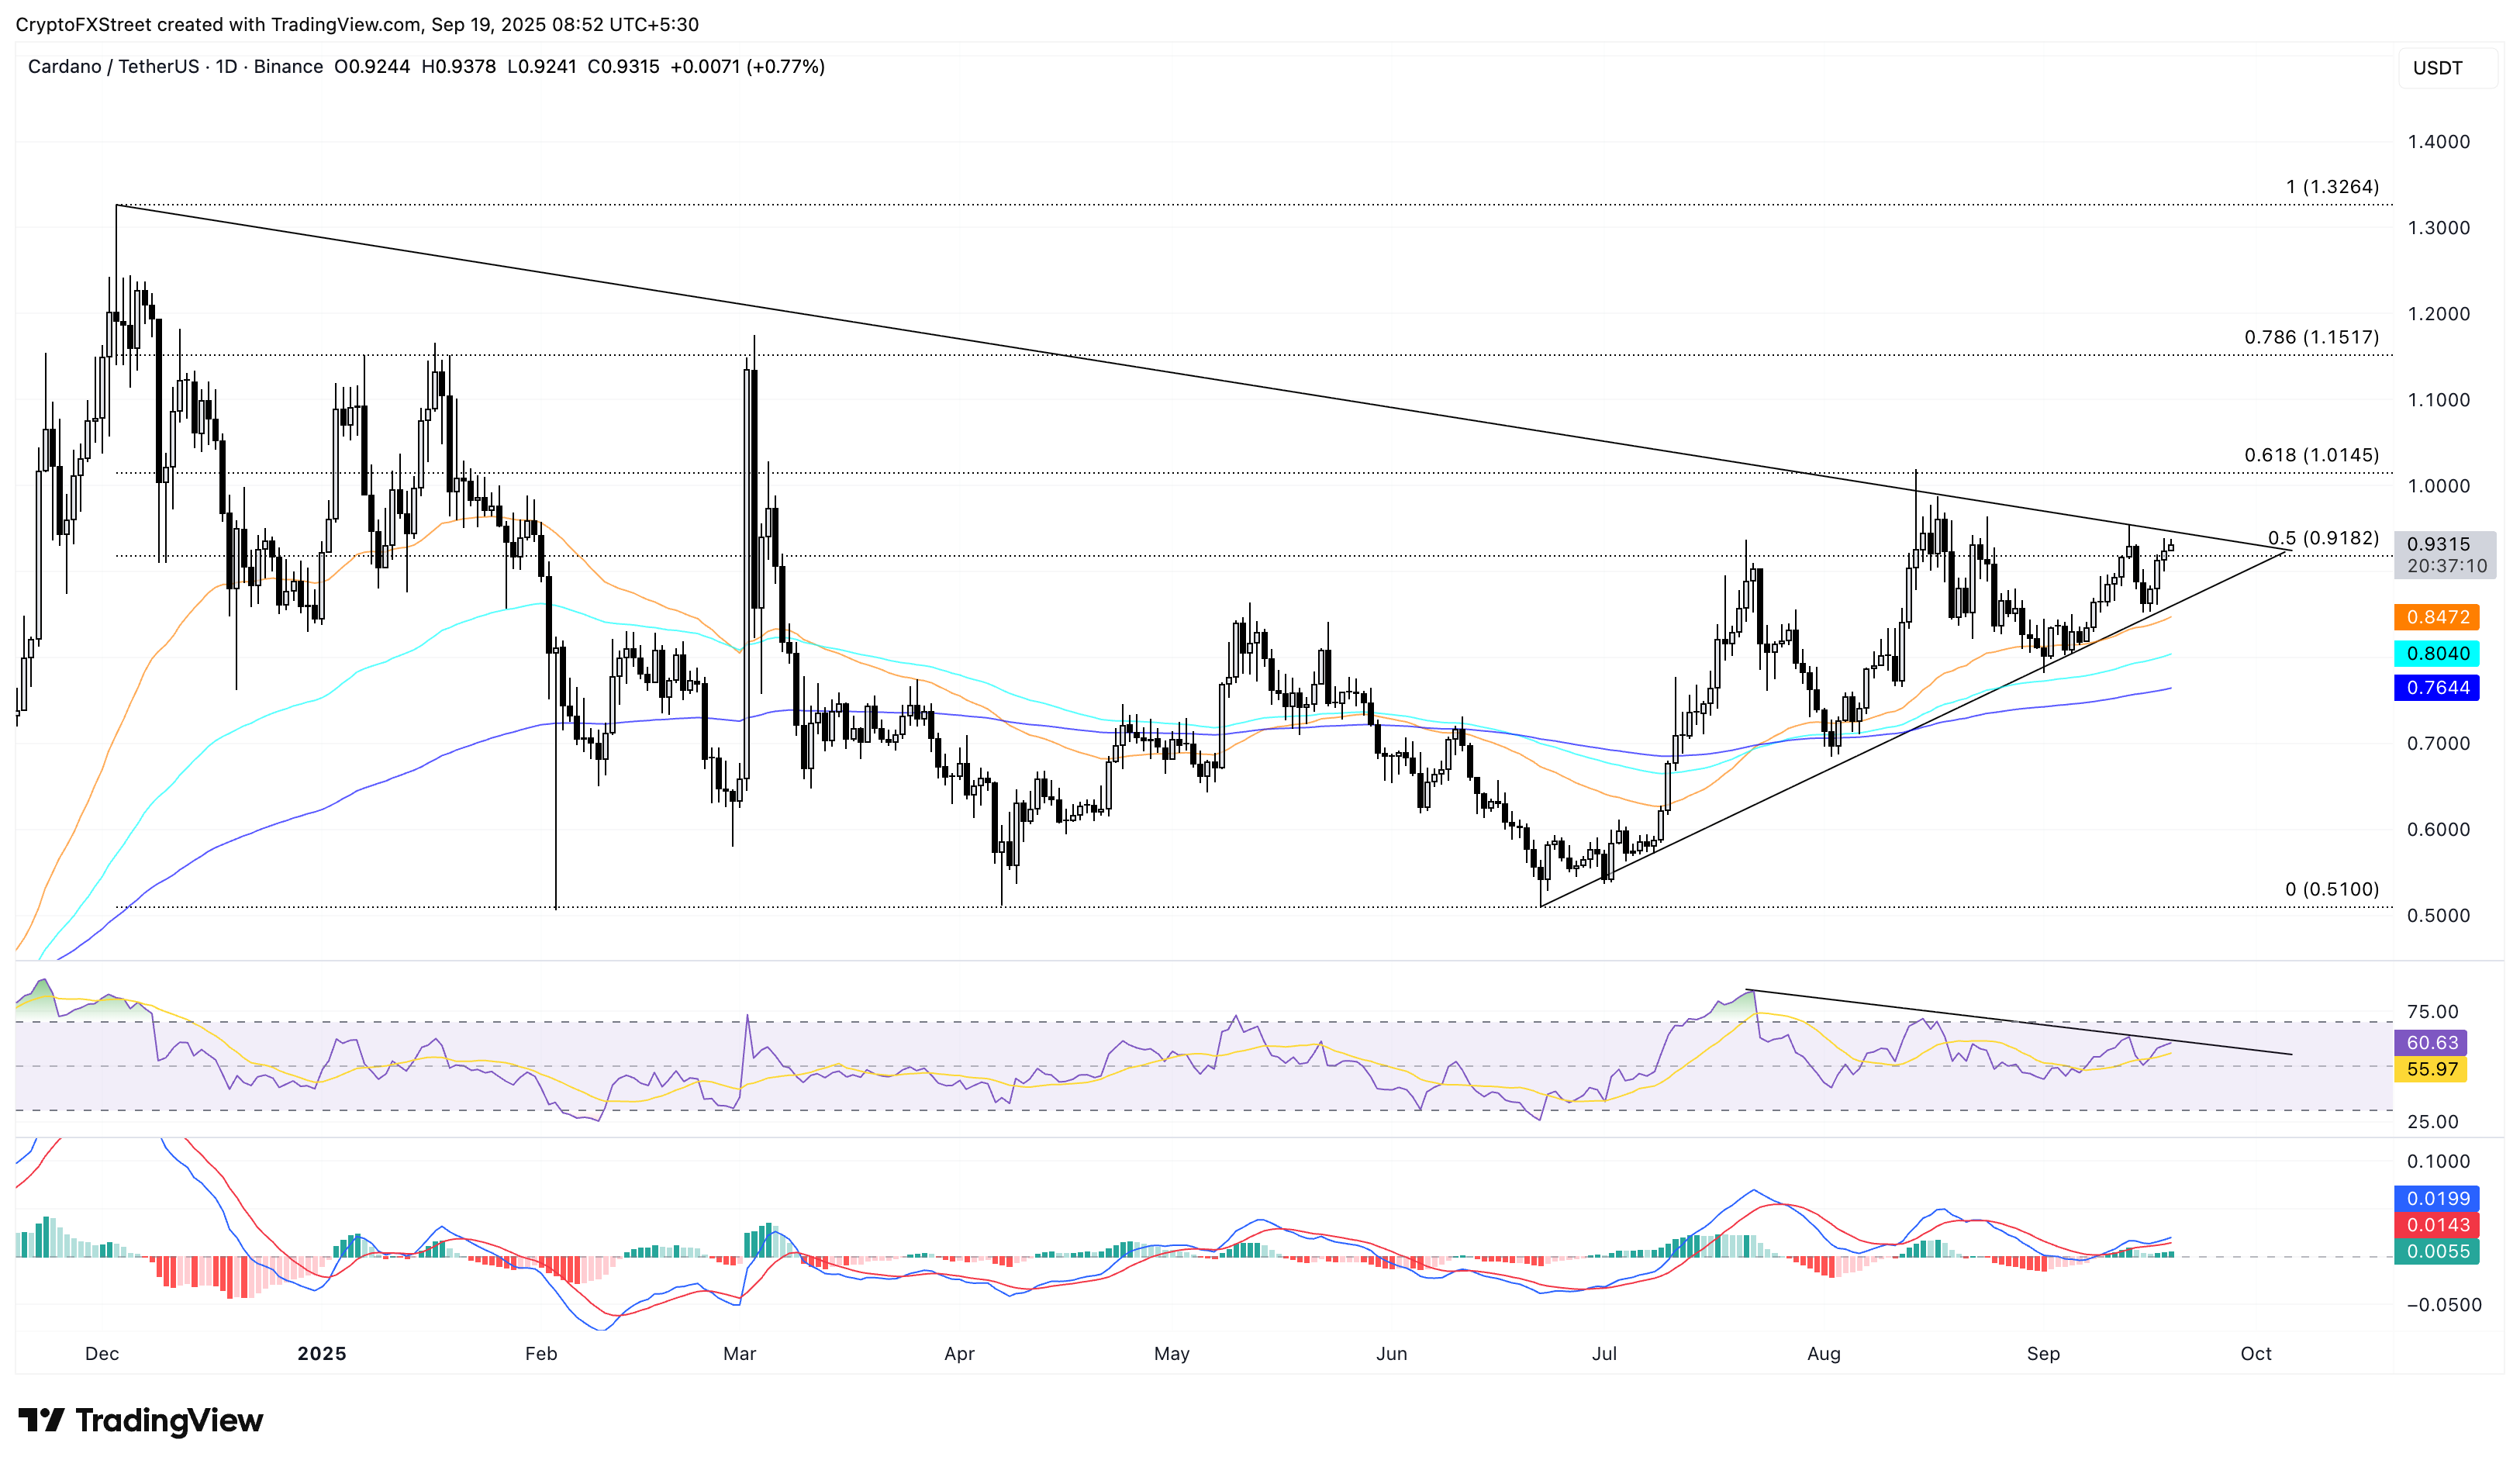
ADA/USDT daily price chart.
On the flip side, if ADA flips from the overhead trendline, resulting in a close below $0.9182, it could extend the decline to the 50-day EMA at $0.8472.
Recommended Articles


