


Crypto Today: Bitcoin, Ethereum, XRP offer recovery signs as stablecoin inflows surge
- Bitcoin recovers above the $115,000 level as steady stablecoin inflows fuel uptrend potential.
- Ethereum remains unmoved above $4,500 despite growing optimism for a Fed interest rate cut.
- XRP shows signs of recovery after defending the $3.00 support level.
Bitcoin (BTC) is approaching the $116,000 level on Tuesday after reclaiming support at around $115,000. The volatility wave that swept across the cryptocurrency market the previous day trimmed part of the gains accrued last week as investors focused on the United States (US) Federal Reserve (Fed) Interest Rate Decision on Wednesday.
Ethereum (ETH) remains above its $4,500 support level, while Ripple (XRP) exhibits recovery potential above the critical $3.00 mark.
Data spotlight: Stablecoin inflows drive Bitcoin’s recovery potential
Stablecoin inflows into exchanges are soaring as Bitcoin and altcoins face rising volatility ahead of the Federal Open Market Committee (FOMC) meeting this Wednesday, which is expected to greenlight what would be the first interest rate cut of the year.
According to a CryptoQuant chart showing the cumulative inflows of stablecoins hosted on the Ethereum network (ERC-20) into exchanges, the figure exceeded $7.2 billion on Friday, compared to $1.1 billion recorded on September 11.
According to Darkfost, an analyst highlighted by CryptoQuant, “the strength of this bull run lies in stablecoins, this cycle is very clearly driven by them. Tracking their movements, expansion, and distribution provides strong insights into what is happening in the market.”
Stablecoins serve as the primary on-ramp, supporting the digital asset economy. Investors seek stablecoins before taking positions in various cryptocurrency assets on exchanges. The surge in stablecoin inflows could also be fueled by exchanges, which are building liquidity to meet user demand.
 Exchange Inflow (Total) - All Exchanges-1758016707444-1758016707445.png)
Stablecoin inflows | Source: CryptoQuant
Chart of the day: Bitcoin eyes $120,000 breakout
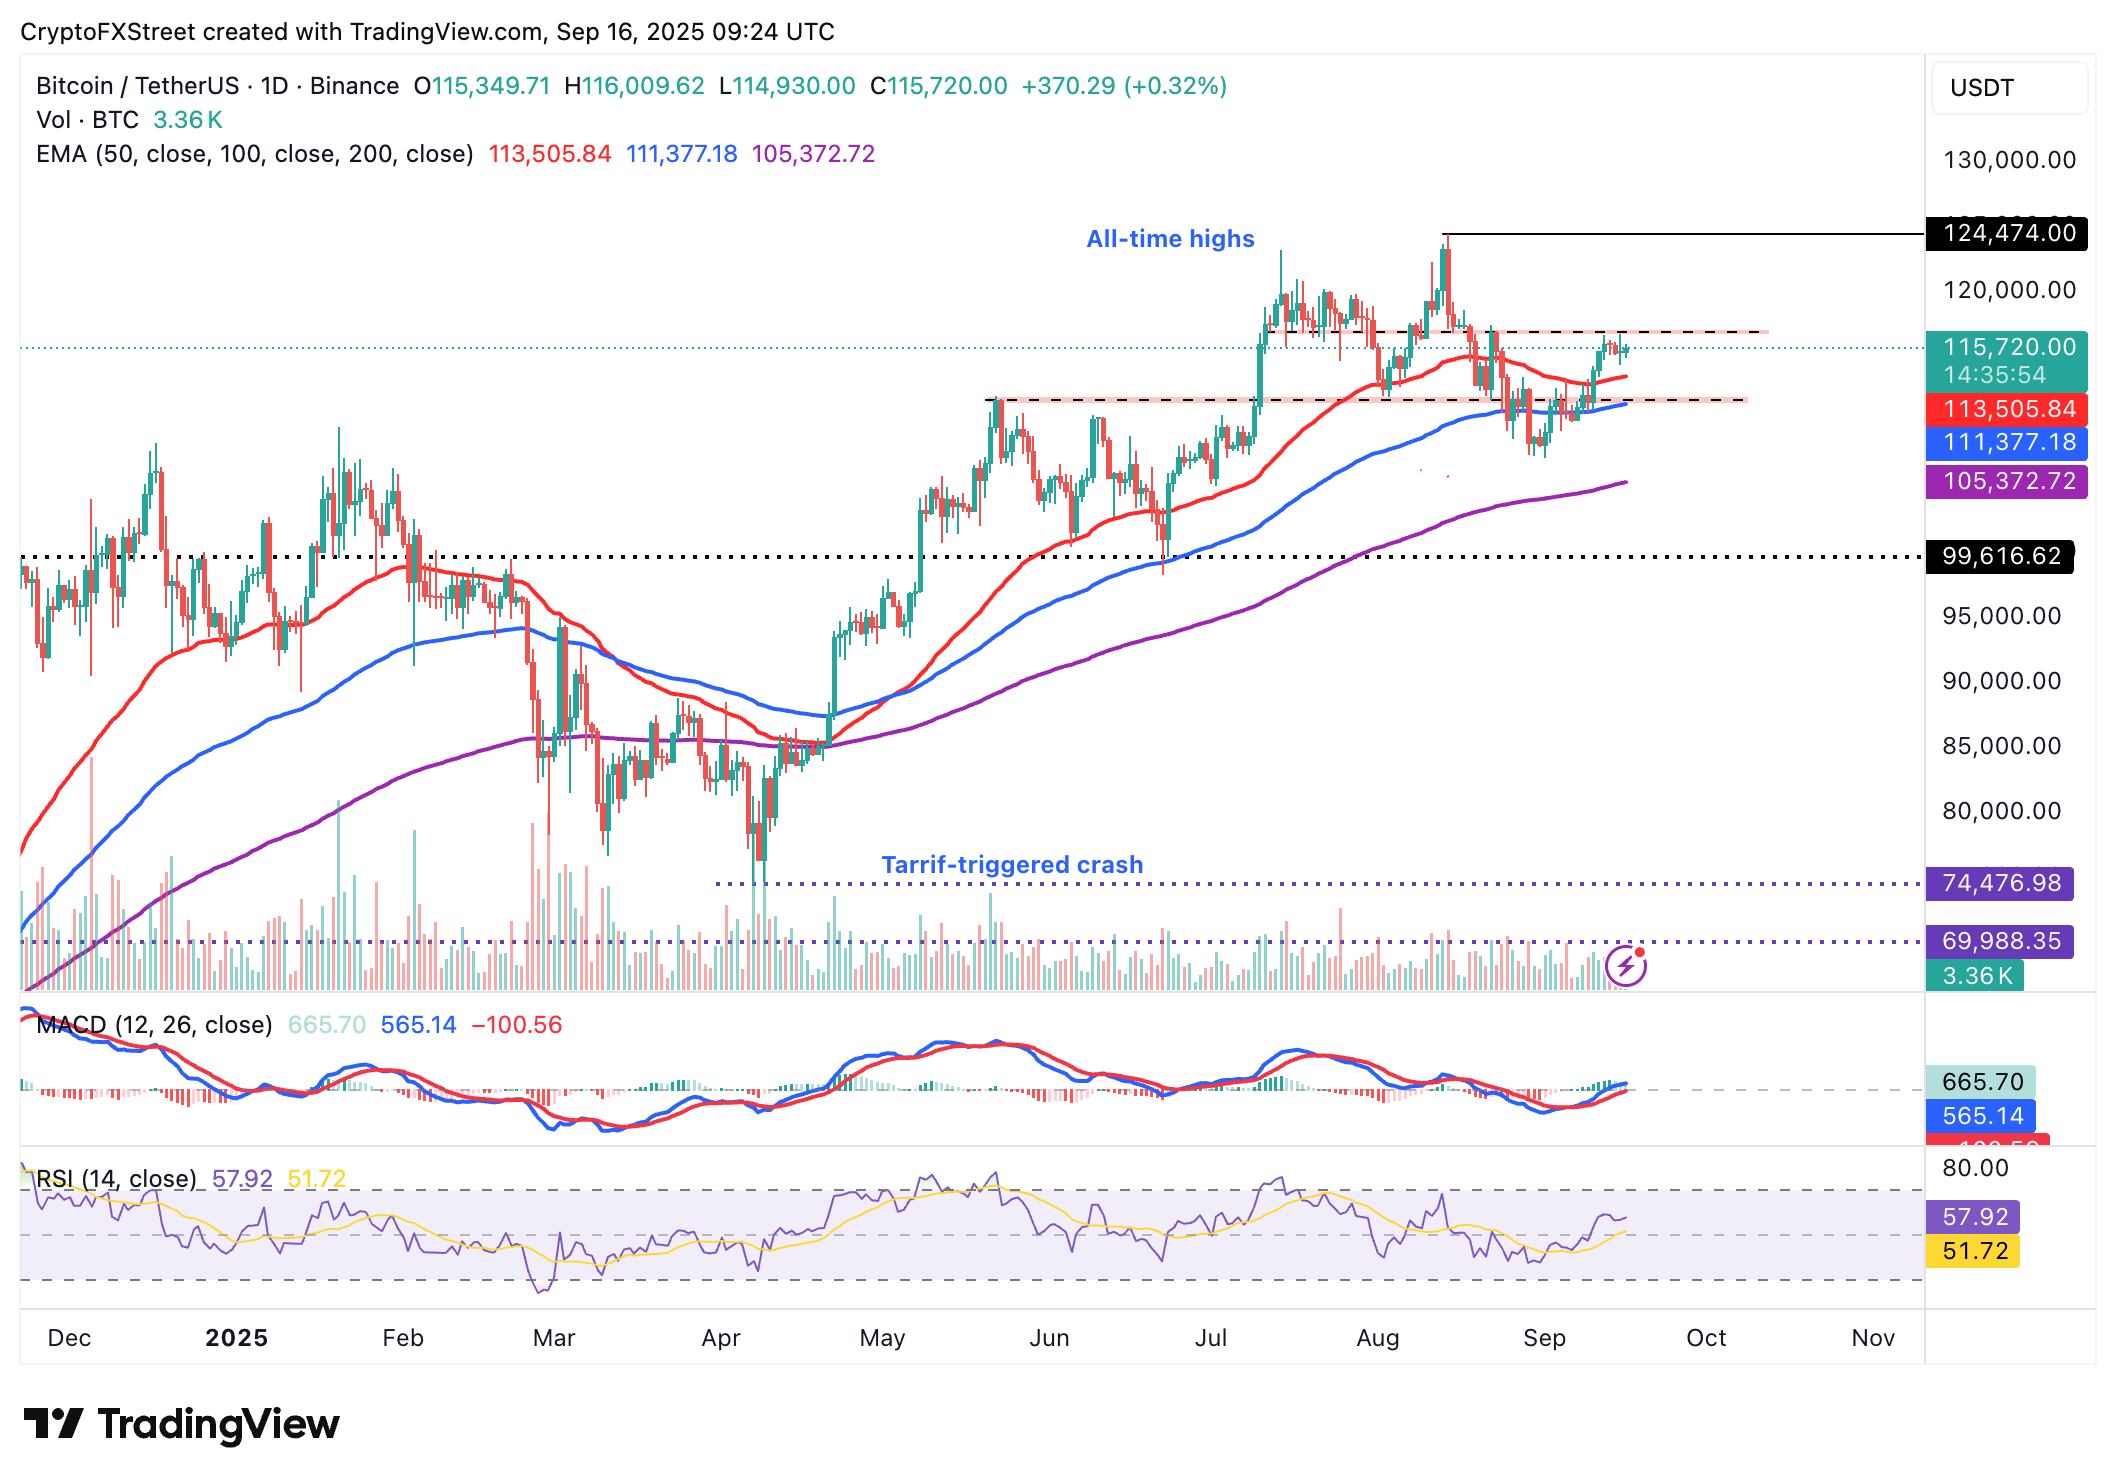
Bitcoin holds below the $116,000 level while maintaining a relatively bullish outlook as shown by key technical indicators on the daily chart. A buy signal from the Moving Average Convergence Divergence (MACD) indicator supports Bitcoin’s bullish potential. Investors will likely continue to seek exposure with the blue MACD line holding above the red signal line.
The Relative Strength Index (RSI), currently at 57, also bolsters BTC’s recovery potential. Higher RSI readings in the bullish region, approaching overbought territory, indicate rising bullish momentum.
Bitcoin also holds above key moving averages, including the 50-day Exponential Moving Average (EMA) at $113,505, the 100-day EMA at $111,377 and the 200-day EMA at $105,372, all of which will serve as tentative support levels if Bitcoin reverses the trend due to rampant profit-taking and changing market dynamics.
BTC/USDT daily chart
Altcoins update: Ethereum uptrend wobbles as XRP steadies
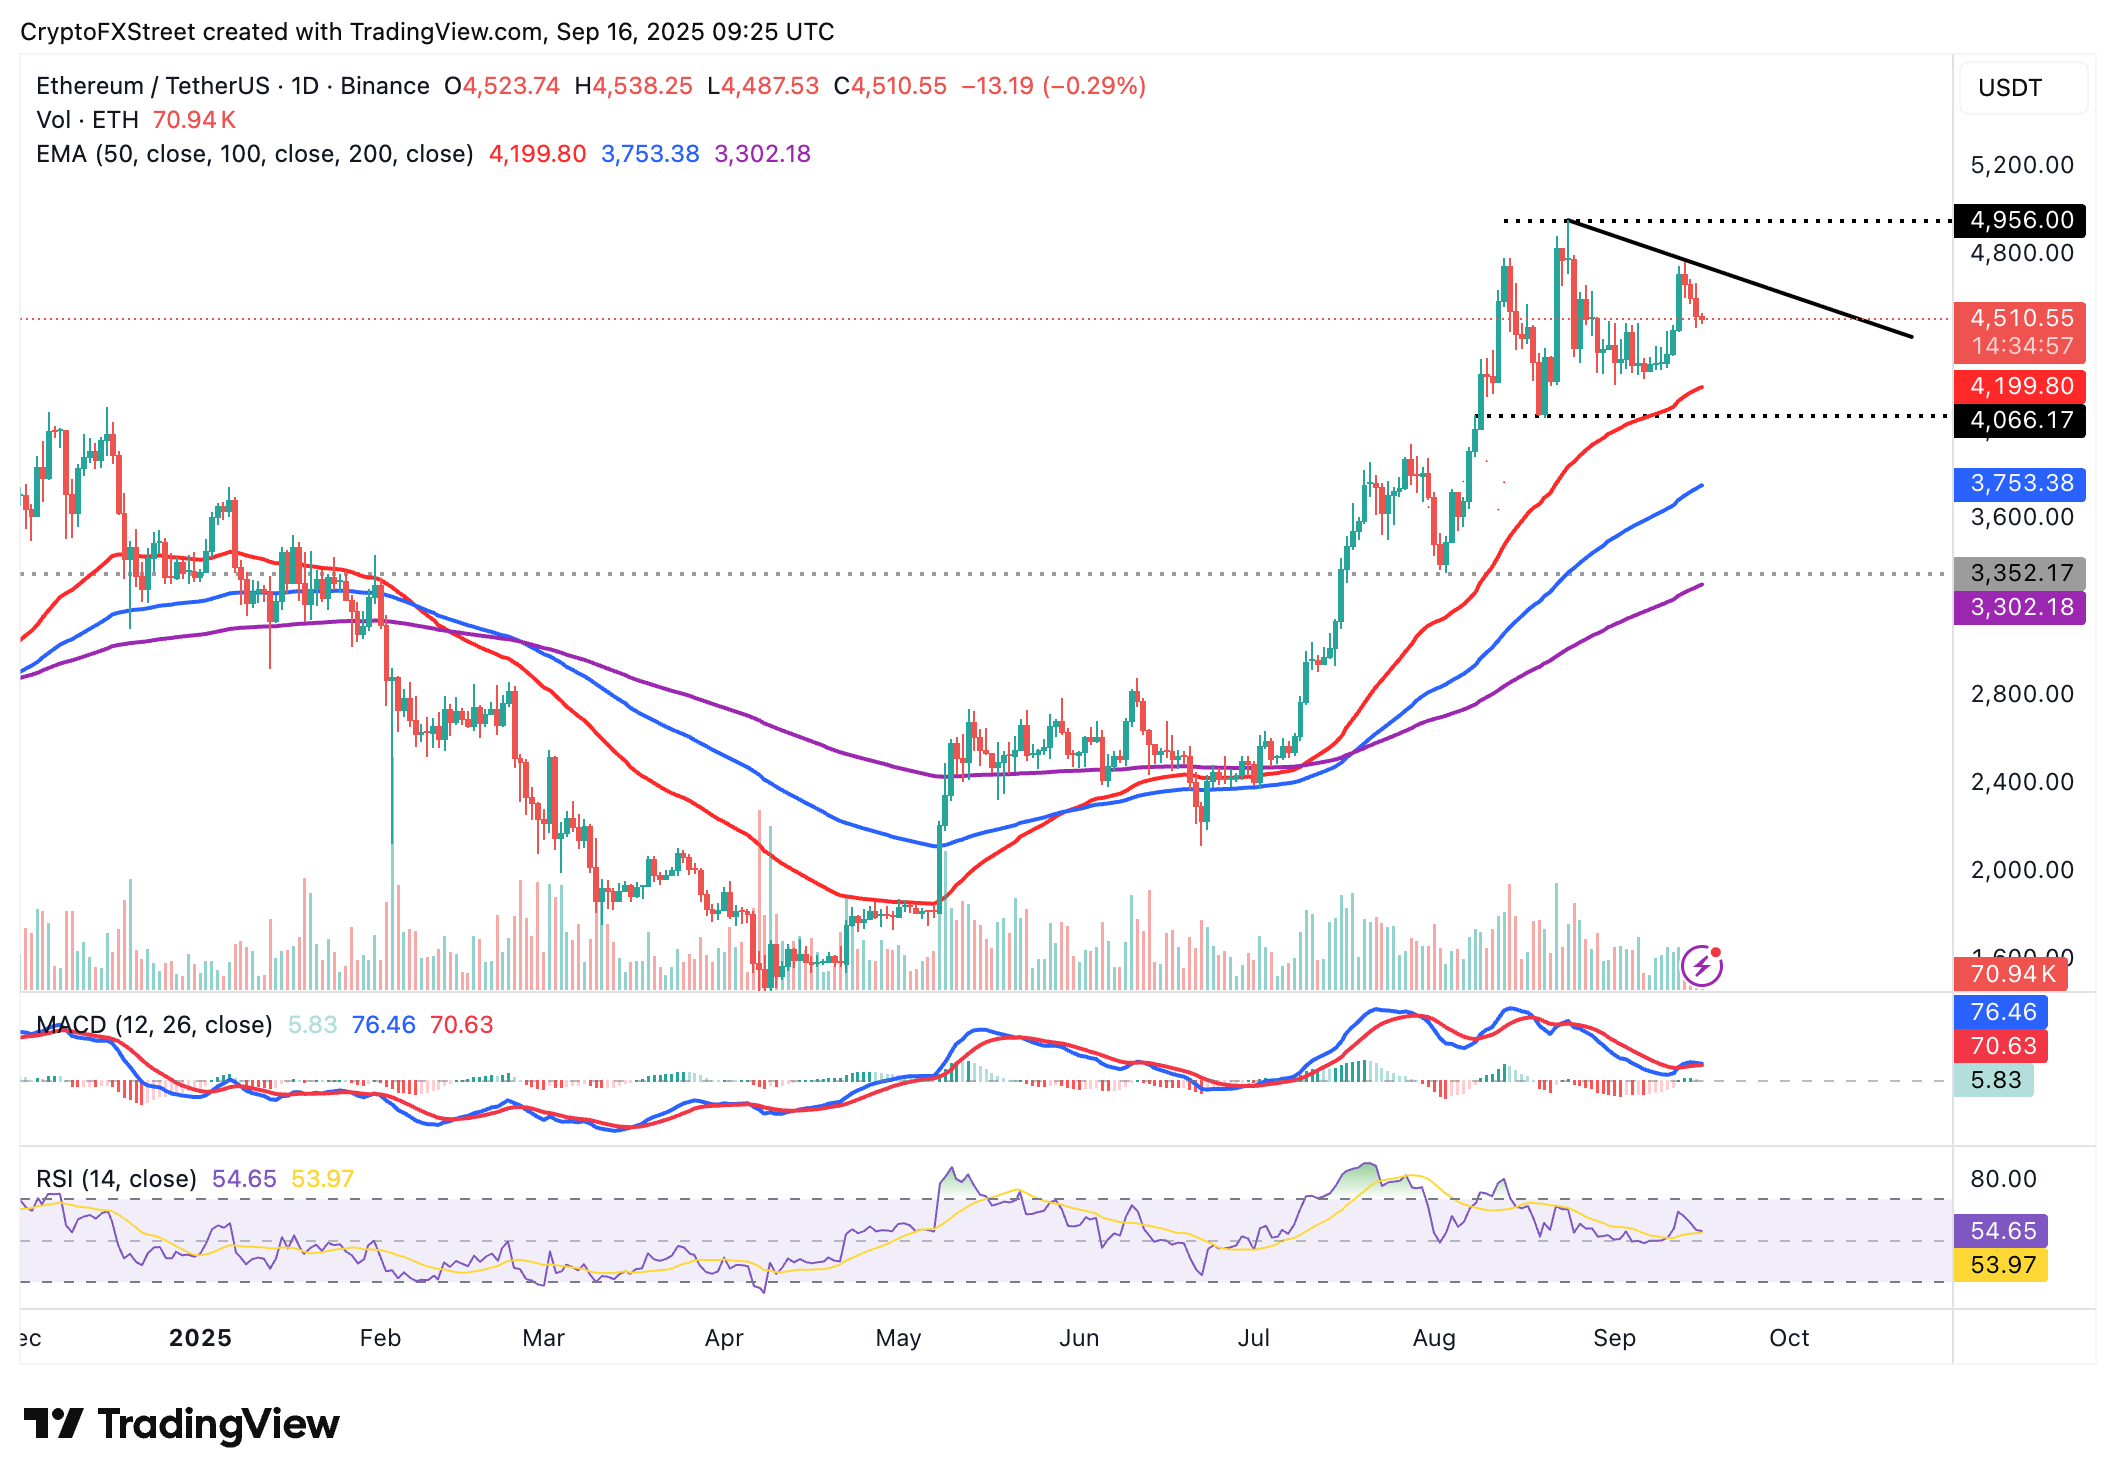
Ethereum bulls are struggling to hold the price above the $4,500 level, signaling a spike in volatility ahead of the Fed’s monetary policy decision. Key short-term technical indicators suggest that bears have the upper hand, risking a drop below $4,500.
The RSI is stable at 54 at the time of writing on the daily chart, but has declined from a recent peak of 64, indicating fading bullish momentum. A drop below the midline could imply a prolonged correction toward the 50-day EMA support at $4,199.
Traders should also look out for a potential sell signal from the MACD indicator. If the blue MACD line crosses below the red signal line, more investors are likely to consider reducing their exposure, thereby contributing to the selling pressure.
Still, growing optimism that the Fed is likely cut interest rates on Wednesday could see a shift in sentiment as traders position themselves ahead of the meeting. In that case, a recovery could build from the short-term $4,500 support toward Ethereum’s record high of $4,956 reached on August 24.
ETH/USDT daily chart
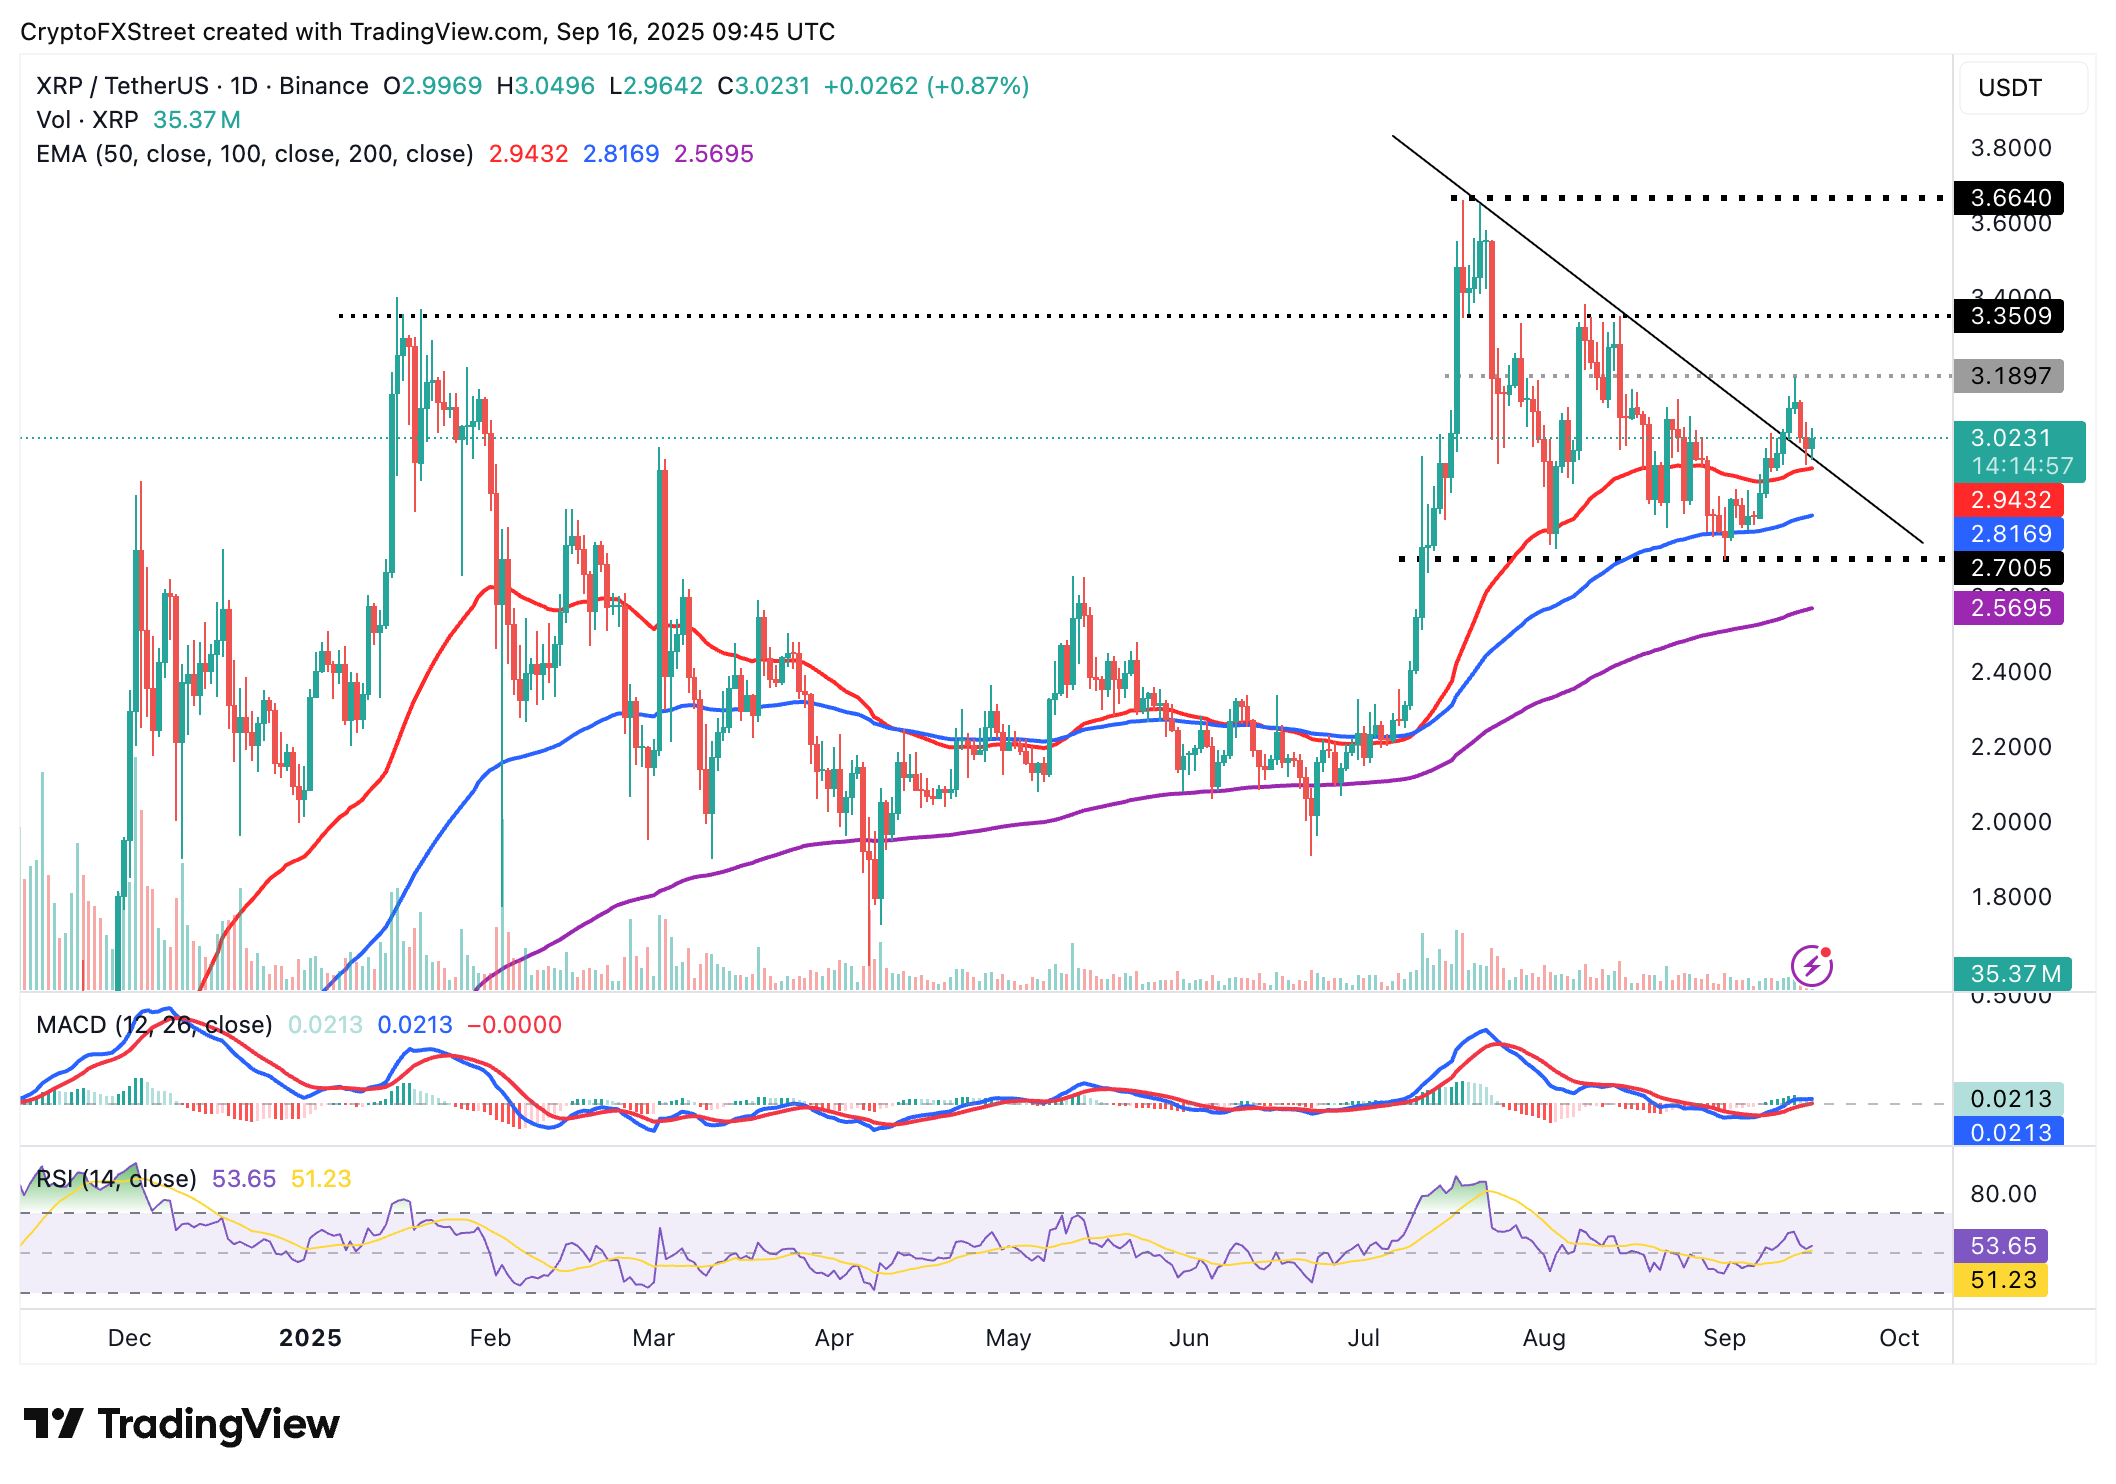
As for XRP, the price remains above the $3.00 level, which coincides with a descending trendline on the daily chart. The successful retest of this support on Monday could mark a significant bullish potential in XRP.
The RSI at 54 has recovered after testing the midline, backing the bullish potential. A continued uptrend toward overbought territory would indicate a steady bullish momentum as investors increase their exposure.
XRP/USDT daily chart
Key levels that traders may need to monitor in the coming days include the short-term hurdle at $3.18, which was previously tested on Saturday, and the next resistance at $3.35, last tested on August 14. If a trend correction occurs below the $3.00 level, the 50-day EMA at $2.94 and the 100-day EMA at $2.81 are in line to prevent declines toward the 200-day EMA at $2.56.
Cryptocurrency metrics FAQs
The developer or creator of each cryptocurrency decides on the total number of tokens that can be minted or issued. Only a certain number of these assets can be minted by mining, staking or other mechanisms. This is defined by the algorithm of the underlying blockchain technology. On the other hand, circulating supply can also be decreased via actions such as burning tokens, or mistakenly sending assets to addresses of other incompatible blockchains.
Market capitalization is the result of multiplying the circulating supply of a certain asset by the asset’s current market value.
Trading volume refers to the total number of tokens for a specific asset that has been transacted or exchanged between buyers and sellers within set trading hours, for example, 24 hours. It is used to gauge market sentiment, this metric combines all volumes on centralized exchanges and decentralized exchanges. Increasing trading volume often denotes the demand for a certain asset as more people are buying and selling the cryptocurrency.
Funding rates are a concept designed to encourage traders to take positions and ensure perpetual contract prices match spot markets. It defines a mechanism by exchanges to ensure that future prices and index prices periodic payments regularly converge. When the funding rate is positive, the price of the perpetual contract is higher than the mark price. This means traders who are bullish and have opened long positions pay traders who are in short positions. On the other hand, a negative funding rate means perpetual prices are below the mark price, and hence traders with short positions pay traders who have opened long positions.
Recommended Articles


