Polkadot Price Forecast: Supply control referendum fails to uplift investors mood

Source Fxstreet
  • Polkadot reverts to retest a symmetrical triangle pattern breakout. 
  • Polkadot DAO passed a referendum on Sunday, capping the total supply at 2.1 billion DOT tokens. 
  • Declining Open Interest and a bearish technical outlook suggest a potential drop under $4. 

Polkadot (DOT) ticks higher by nearly 1% at press time on Tuesday after a two-day pullback, presenting the possibility of a post-retest bounce back of a symmetrical triangle pattern on the daily chart. Still, the poor performance of DOT, following the Polkadot Decentralized Autonomous Organization (DAO) referendum, which caps the maximum supply at 2.1 billion DOT, highlights the downside risk.

New referendum fails to uplift investors' confidence

Polkadot’s DAO passed the “Wish For Change” referendum on Sunday with an 81% support, limiting the maximum supply of DOT tokens to 2.1 billion. This marks a shift from the previous policy of no supply cap, which could result in a lowered selling pressure, aligning with the broader market trend of buybacks and token burns.

The referendum also introduces a step-down feature in DOT token issuance every 2 years on Pi Day (March 14), which will reduce the current 120 million DOT issued annually and reach a supply of 1.91 billion tokens by 2040. 
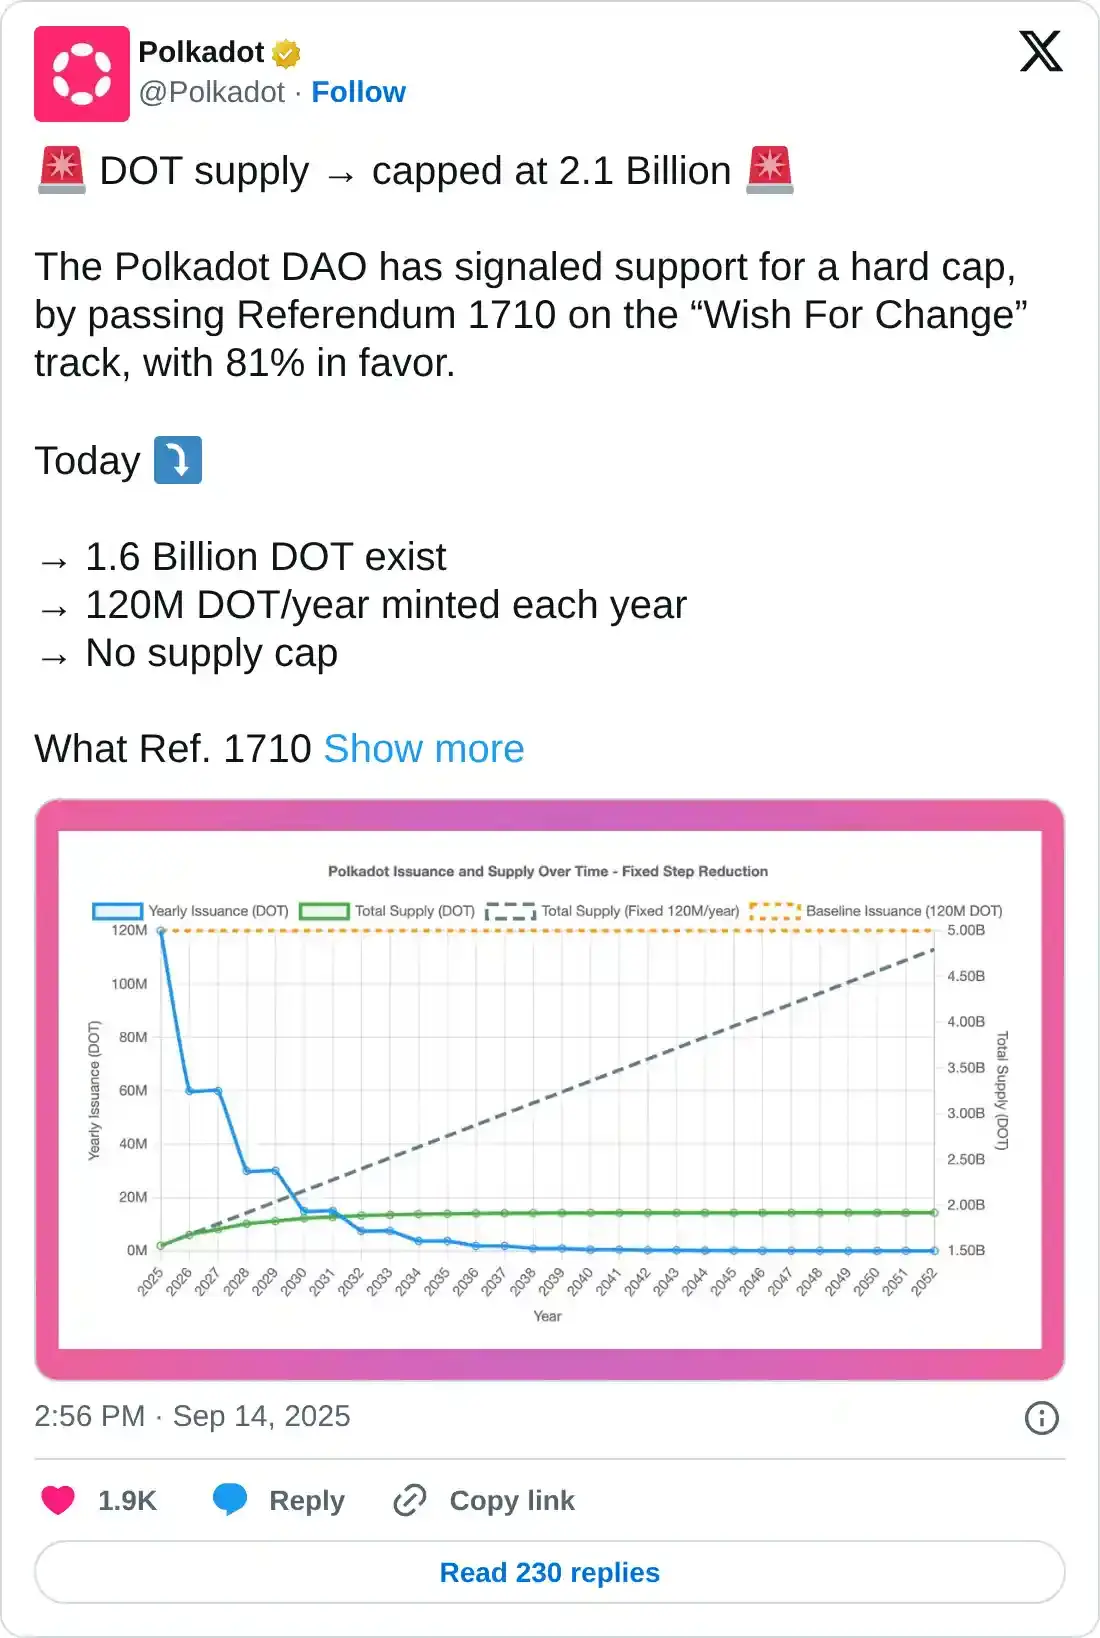
https://x.com/Polkadot/status/1967241017314115889

Polkadot struggles to hold above $4 

Despite the Polkadot ecosystem’s active effort to change its tokenomics, DOT reacted negatively, resulting in the previous two consecutive days of losses. At the time of writing, DOT ticks higher by nearly 1%, holding above the broken trendline of a symmetrical triangle pattern on the daily chart. 

CoinGlass data shows that the DOT Open Interest has declined by nearly 5% over the last 24 hours, reaching $575.9 million. This indicates a large outflow from Polkadot derivatives as traders lose interest. 
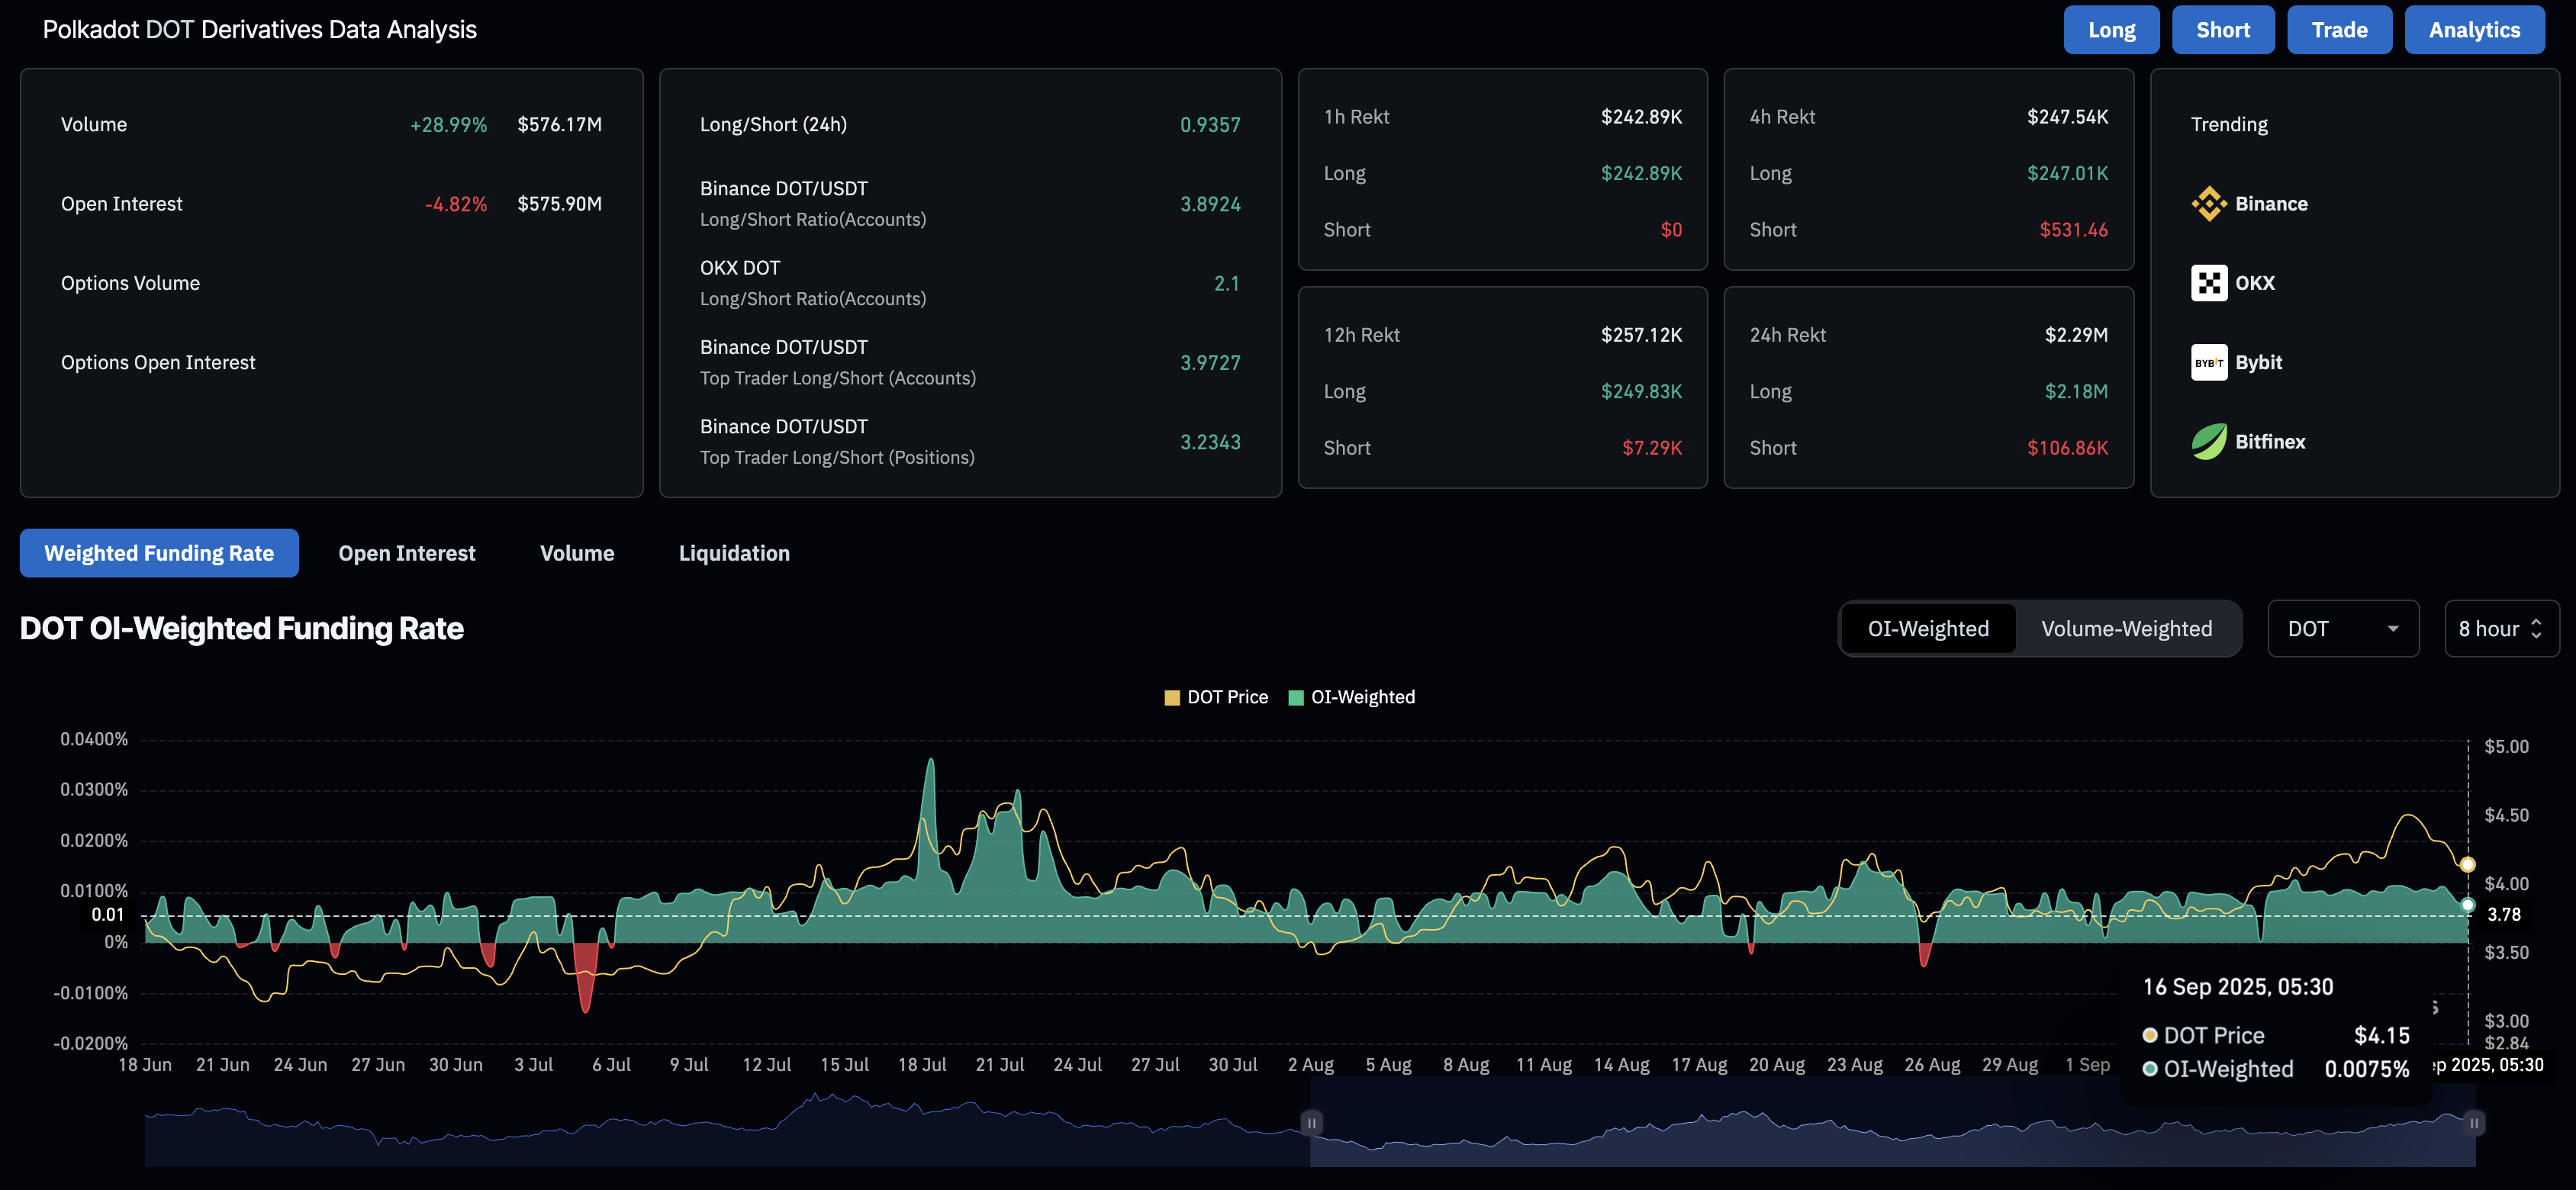
DOT derivatives. Source: CoinGlass

Looking down, a drop below the 100-day Exponential Moving Average (EMA) at $4.011 would invalidate the chances of a bounce back. In such a case, DOT could extend the decline to $3.689, last tested on September 2. 

The technical indicators on the daily chart indicate a significant decline in bullish momentum as the Relative Strength Index (RSI) drops to 54 from near the overbought boundary. At the same time, the Moving Average Convergence Divergence (MACD) retraces to its signal line, hinting at a potential crossover that would indicate a bearish shift in trend momentum, triggering a sell signal for sidelined investors.
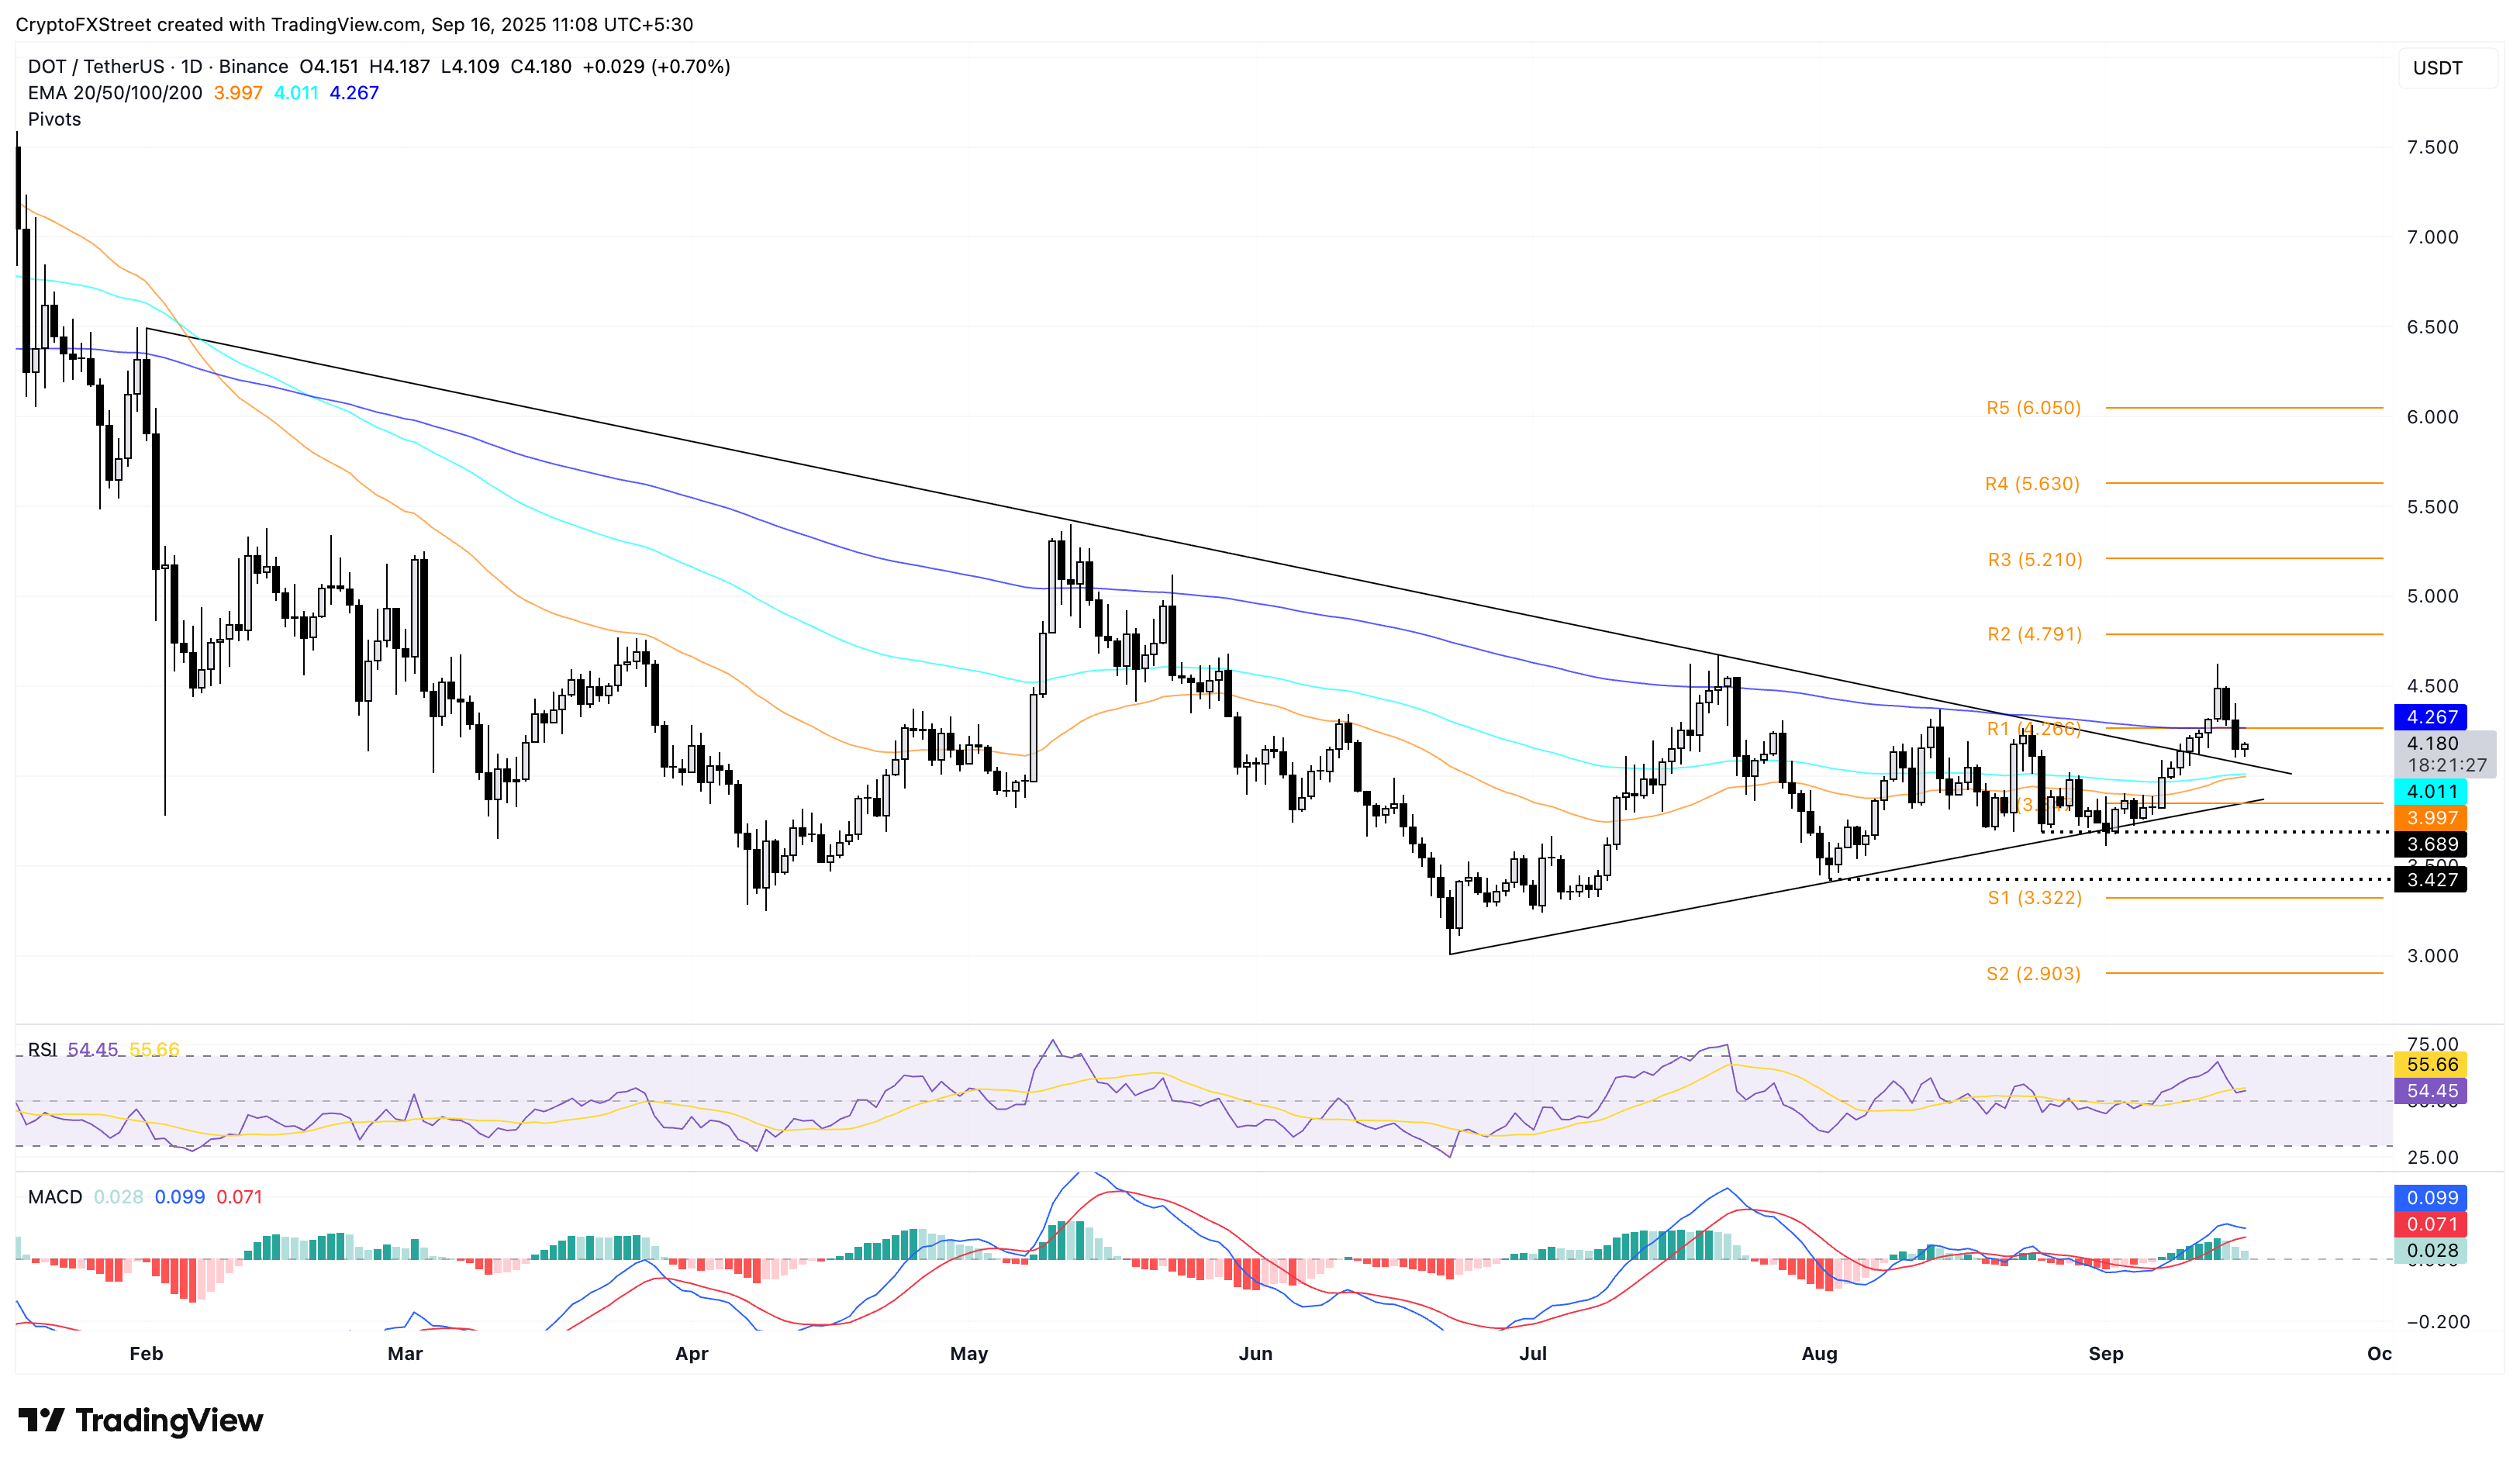
DOT/USDT daily price chart.

On the flip side, the intraday recovery should surpass the R1 pivot level at $4.266, aligning with the 200-day Exponential Moving Average (EMA), to reinforce an uptrend. A potential upside extension could target the R2 pivot level at $4.791. 

Disclaimer: For information purposes only. Past performance is not indicative of future results.
placeholder
ANZ Raises Gold Price Forecast to $3,800/Oz, Predicts Rally to Continue Through 2026Gold is expected to continue its upward momentum throughout 2025 and into early 2026, driven by ongoing geopolitical tensions, macroeconomic challenges, and market anticipation of U.S. monetary easing, according to analysts from ANZ in a research note released Wednesday.
Author  Mitrade
Sept 10, Wed
Gold is expected to continue its upward momentum throughout 2025 and into early 2026, driven by ongoing geopolitical tensions, macroeconomic challenges, and market anticipation of U.S. monetary easing, according to analysts from ANZ in a research note released Wednesday.
placeholder
Barclays Boosts S&P 500 Outlook Amid Strong AI-Driven EarningsBarclays has increased its earnings and price projections for the S&P 500 through 2025 and 2026, attributing the upgrade to stronger-than-anticipated corporate results in the first half of the year and a robust earnings landscape despite trade tensions and labor challenges.
Author  Mitrade
Sept 10, Wed
Barclays has increased its earnings and price projections for the S&P 500 through 2025 and 2026, attributing the upgrade to stronger-than-anticipated corporate results in the first half of the year and a robust earnings landscape despite trade tensions and labor challenges.
placeholder
Dollar Holds Steady Amid Inflation Data and Central Bank WatchThe U.S. dollar steadied in early Asian trading on Thursday following an unexpected 0.1% decline in the Producer Price Index (PPI) for final demand in August, as reported by the Labor Department’s Bureau of Labor Statistics.
Author  Mitrade
Sept 11, Thu
The U.S. dollar steadied in early Asian trading on Thursday following an unexpected 0.1% decline in the Producer Price Index (PPI) for final demand in August, as reported by the Labor Department’s Bureau of Labor Statistics.
placeholder
Asia Stocks Steady After Sharp GainsMost Asian stock markets remained steady on Monday following robust gains last week.
Author  Mitrade
Yesterday 07: 06
Most Asian stock markets remained steady on Monday following robust gains last week.
placeholder
Oil Prices Rise Following Attacks on Russian Energy Infrastructure Oil prices climbed further on Monday as markets reacted to Ukrainian drone strikes targeting Russian refinery infrastructure, raising concerns over potential disruptions to Russia’s crude and fuel exports.
Author  Mitrade
Yesterday 07: 19
Oil prices climbed further on Monday as markets reacted to Ukrainian drone strikes targeting Russian refinery infrastructure, raising concerns over potential disruptions to Russia’s crude and fuel exports.
goTop
quote