
Aethir Price Forecast: ATH bulls set sights above $0.070
- Aether price nears its key weekly resistance at $0.065, a firm close above this level would extend gains.
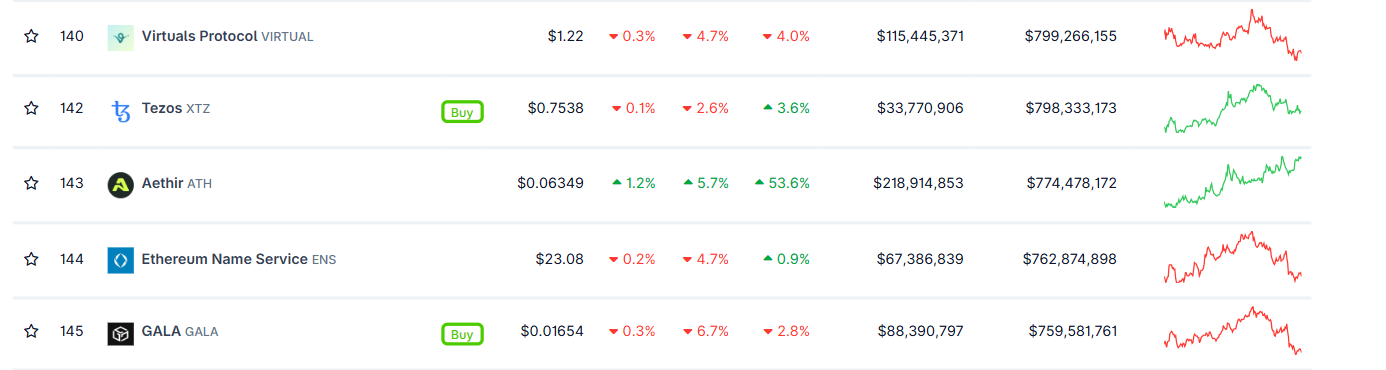
- Market capitalization climbs past $774 million, overtaking popular altcoins like ENS and GALA.
- Derivatives data show renewed buying activity as open interest surges to record highs.
Aethir (ATH) is trading slightly below its weekly resistance at $0.065 at the time of writing on Tuesday, with a close above this level eyeing a potential breakout above $0.070. Strengthening on-chain momentum, rising open interest, and a market capitalization now above $774 million highlight growing investor confidence in ATH.
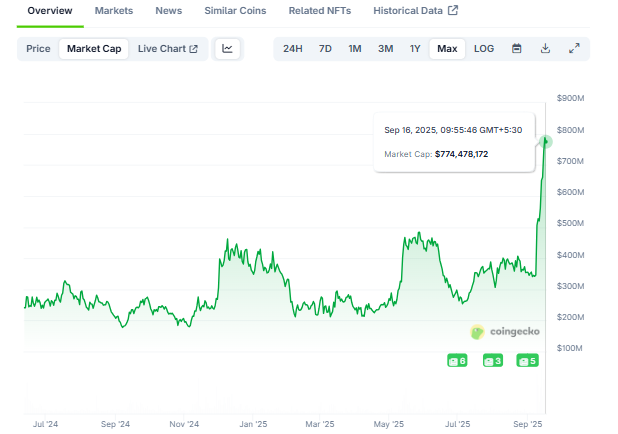
Aethir’s market capitalization soars to $774 million
Aethir price started the week on a positive note, rallying over 5% on Monday after rallying 100% in the previous week. CoinGecko data show that Aethir’s market capitalization reached $774.47 million on Tuesday, surpassing other popular meme coins, such as Ethereum Name Service (ENS) and GALA (GALA), and currently taking the 143rd position in the overall crypto market capitalization table.
Renew buying activity in ATH
CoinGlass’ data show that the futures’ open interest in Aethir at exchanges reached a new all-time high of $151.32 million on Tuesday. Rising OI represents new or additional money entering the market and new buying, which could fuel the current ATH price rally.
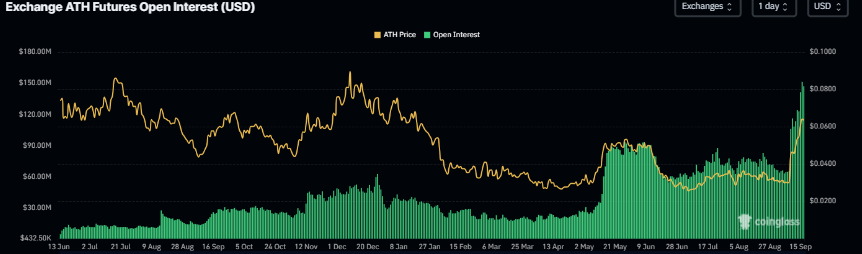
Aethir open interest chart. Source: Coinglass
Apart from the rising open interest, as explained in the previous report, demand for ATH, development, and partnership continues to grow. In Q3, ATH provided 340 million compute hours, with an average of over 28 million per week, representing a 17.5% increase from the previous quarter. Moreover, since its launch, Aethir’s Decentralized Physical Infrastructure Network (DePIN) has delivered more than 1.16 billion total compute hours.
Aethir Price Forecast: Bulls aiming for levels above $0.070
Aethir price broke above the descending trendline (drawn by joining multiple highs with a trendline since December) and its consolidating range between $0.028 and $0.037 last week, and rose 100%. At the start of this week on Monday, it continues its upward momentum, retesting the weekly resistance at $0.065. When writing on Tuesday, it trades slightly down at around $0.062.
If ATH closes above the weekly resistance at $0.065 on a daily basis, it could extend the rally toward its next daily resistance at $0.073.
The Relative Strength Index (RSI) on the daily chart read 82, above its overbought conditions, indicating strong bullish momentum. The Moving Average Convergence Divergence (MACD) also showed a bullish crossover last week, which remains in effect. Moreover, the rising green histogram bars above the neutral value further support the bullish thesis.
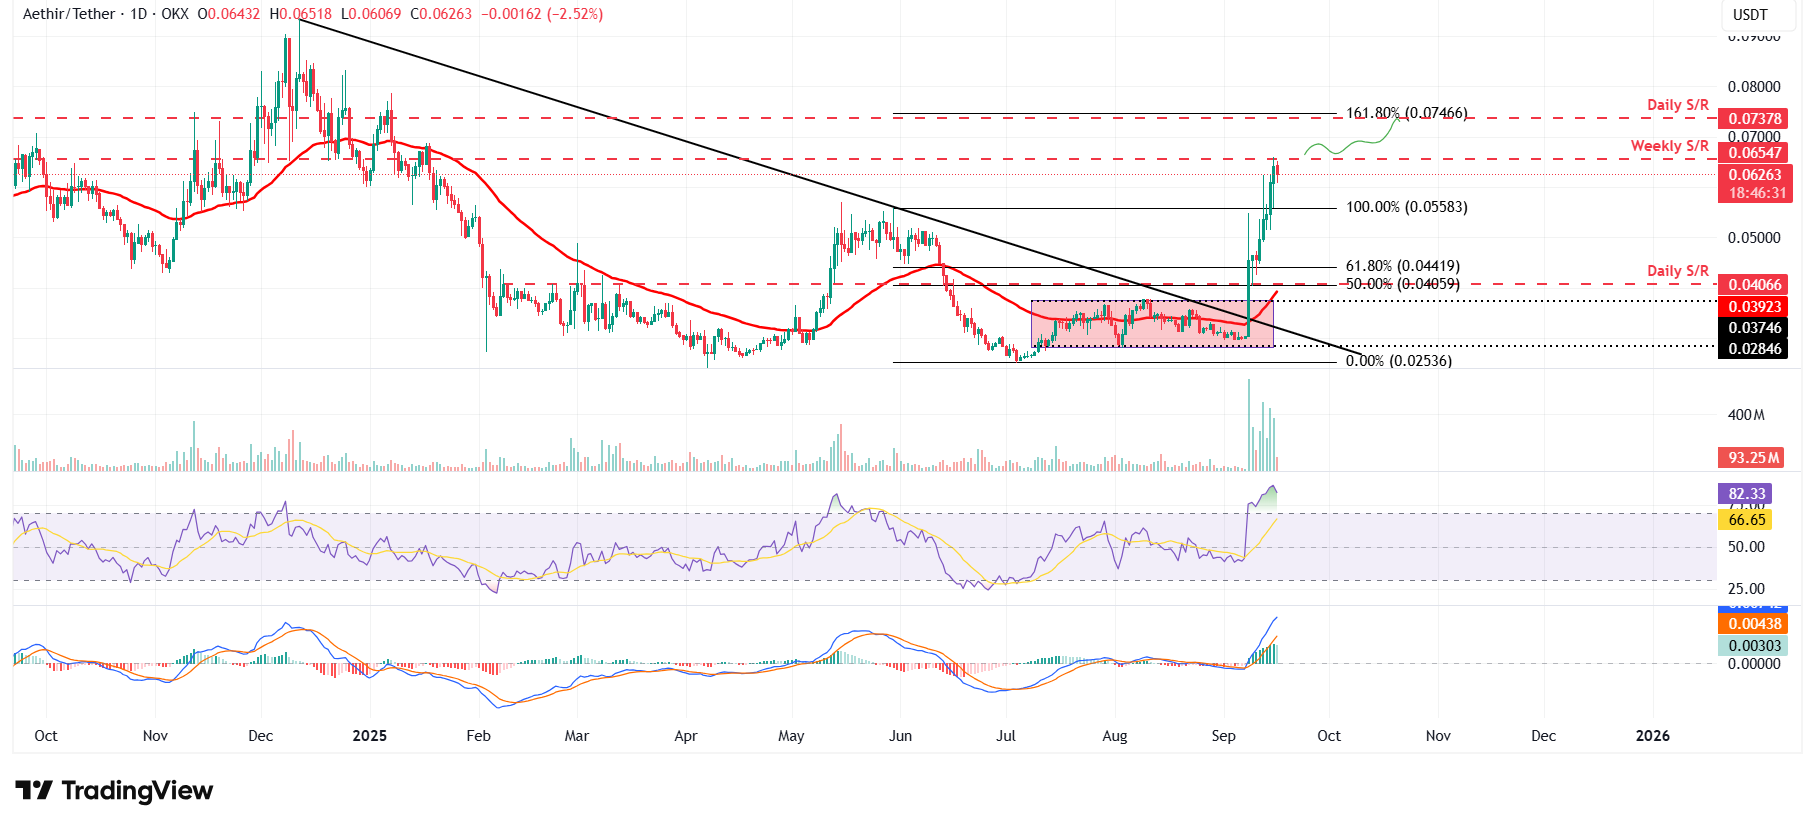
ATH/USDT daily chart
However, if ATH faces a correction, it could extend the decline toward the Sunday low at $0.055.
Recommended Articles


