
Curve DAO Price Forecast: Large wallets accumulate and bullish divergence fuel recovery prospects
- Curve DAO price extends its recovery on Tuesday after finding support near its 200-day EMA.
- Santiment data shows that large wallets are accumulating CRV tokens.
- The technical outlook suggests a recovery ahead as the 4-hour chart indicates a bullish divergence in play.
Curve DAO (CRV) is extending its recovery trading above $0.75 at the time of writing on Tuesday after holding support at the 200-day Exponential Moving Average (EMA) the previous day. The accumulation of CRV tokens by large wallets and a bullish divergence on the 4-hour chart indicate improving momentum, raising the prospects of a sustained rebound in the upcoming days.
CRV whales buy dips while bullish bets continue to rise
Santiment’s Supply Distribution data supports a bullish outlook for Curve DAO, as the number of large-wallet holders (whales) is increasing.
The metric indicates that whales holding between 10 million and 100 million CRV tokens (blue line) have accumulated 13.3 million tokens from Friday to Tuesday. During the same period, wallets holding between 100,000 and 1 million (red line) and those with 1 million to 10 million have shed 12.56 million CRV tokens.
This shows that the second cohort of whales could have fallen prey to the capitulation event. In contrast, the first set of wallets seized the opportunity and accumulated Curve DAO at a discount.
 [09-1756788870293-1756788870294.31.22, 02 Sep, 2025].png)
CRV supply distribution metric chart. Source: Santiment
Looking at the derivatives data further supports the bullish outlook. Coinglass’s long-to-short ratio for CRV reads 1.01 on Tuesday, nearly its monthly high, suggesting that traders are betting for the asset price to rally.
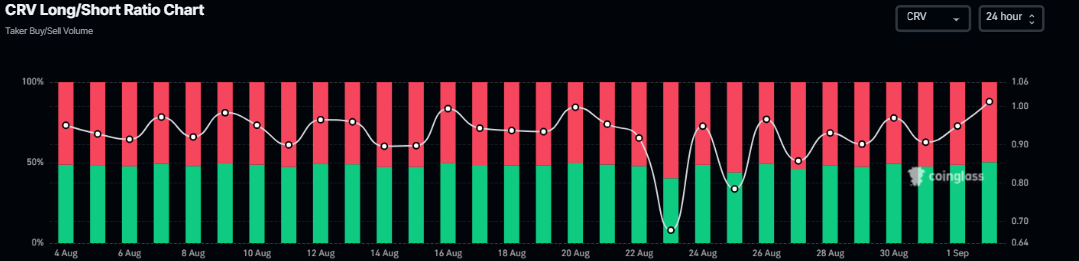
CRV long-to-short ratio chart
Curve DAO Price Forecast: CRV shows signs of a reversal
Curve DAO failed to close above the daily resistance level at $0.81 on August 27 and declined by 8.6% until Monday, retesting its 200-day EMA at $0.71. At the time of writing on Tuesday, CRV rebounds, trading above $0.75.
If the 200-day EMA at $0.71 continues to hold as support, CRV could extend the recovery toward its daily resistance at $0.81.
The Relative Strength Index (RSI) on the daily chart read 40, pointing upward toward its neutral level of 50, indicating signs of fading bearish momentum.
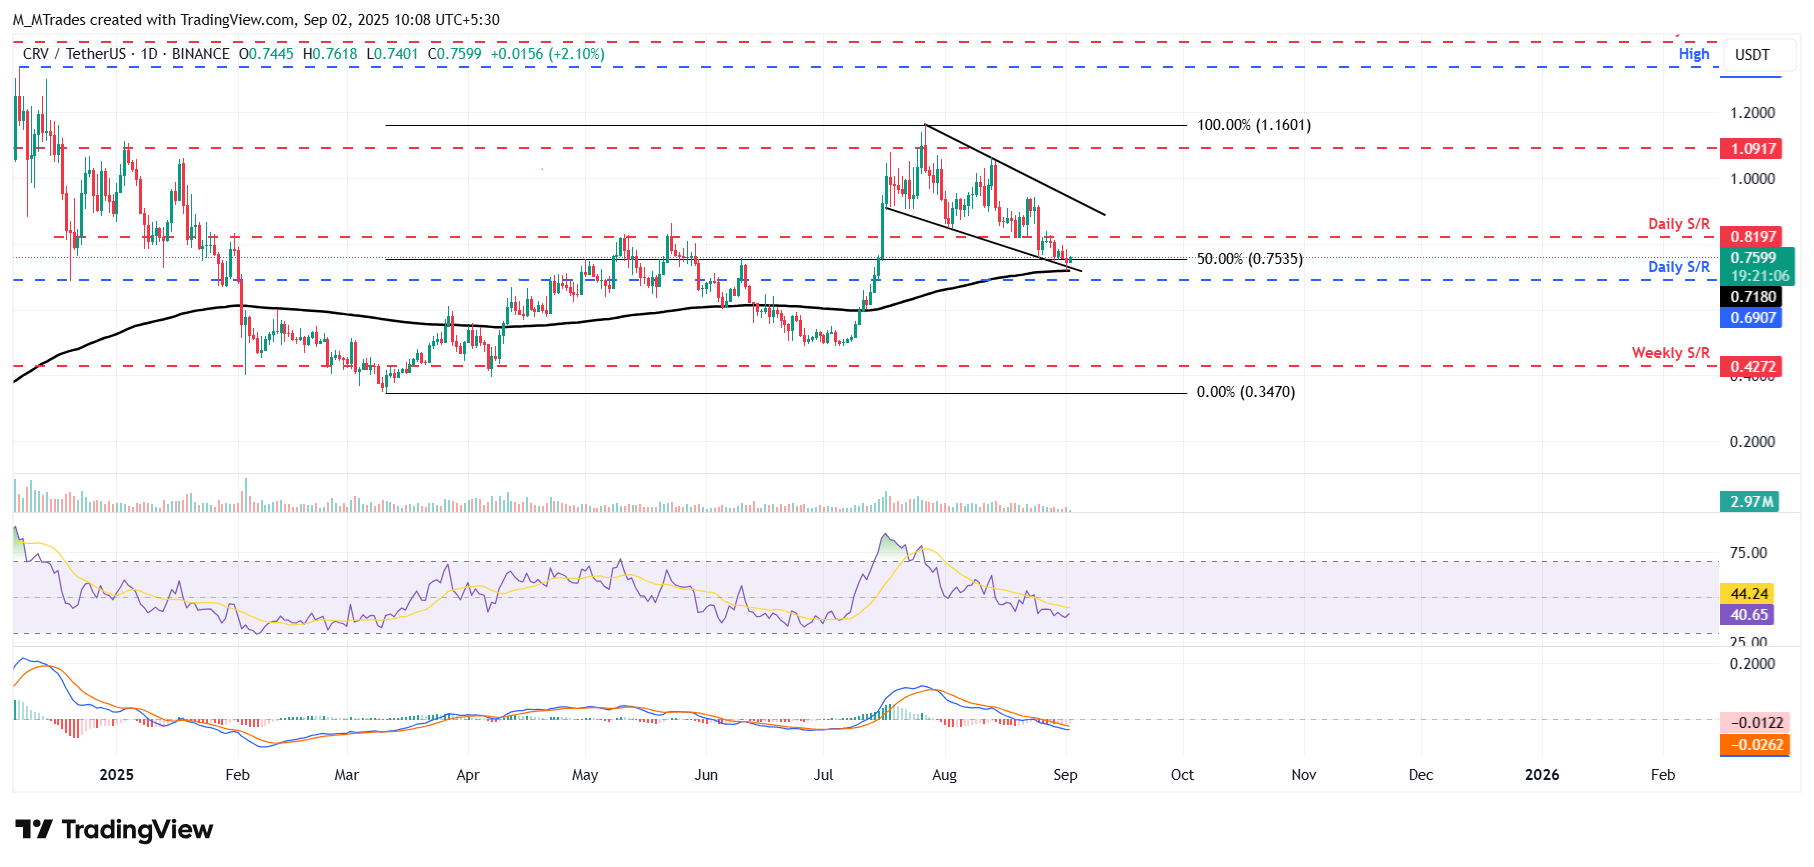
CRV/USDT daily chart
Looking at the 4-hour chart, CRV shows a bullish RSI divergence in play. The formation of a lower low on Monday contrasts with the RSI’s higher highs during the same period. This development is termed a bullish divergence and often signals a trend reversal or a short-term rally.
If CRV recovers, it could extend the advance toward its 50-day Exponential Moving Average (EMA) on the 4-hour chart at $0.79. A successful close above this level could extend the gains toward its next resistance at $0.84.
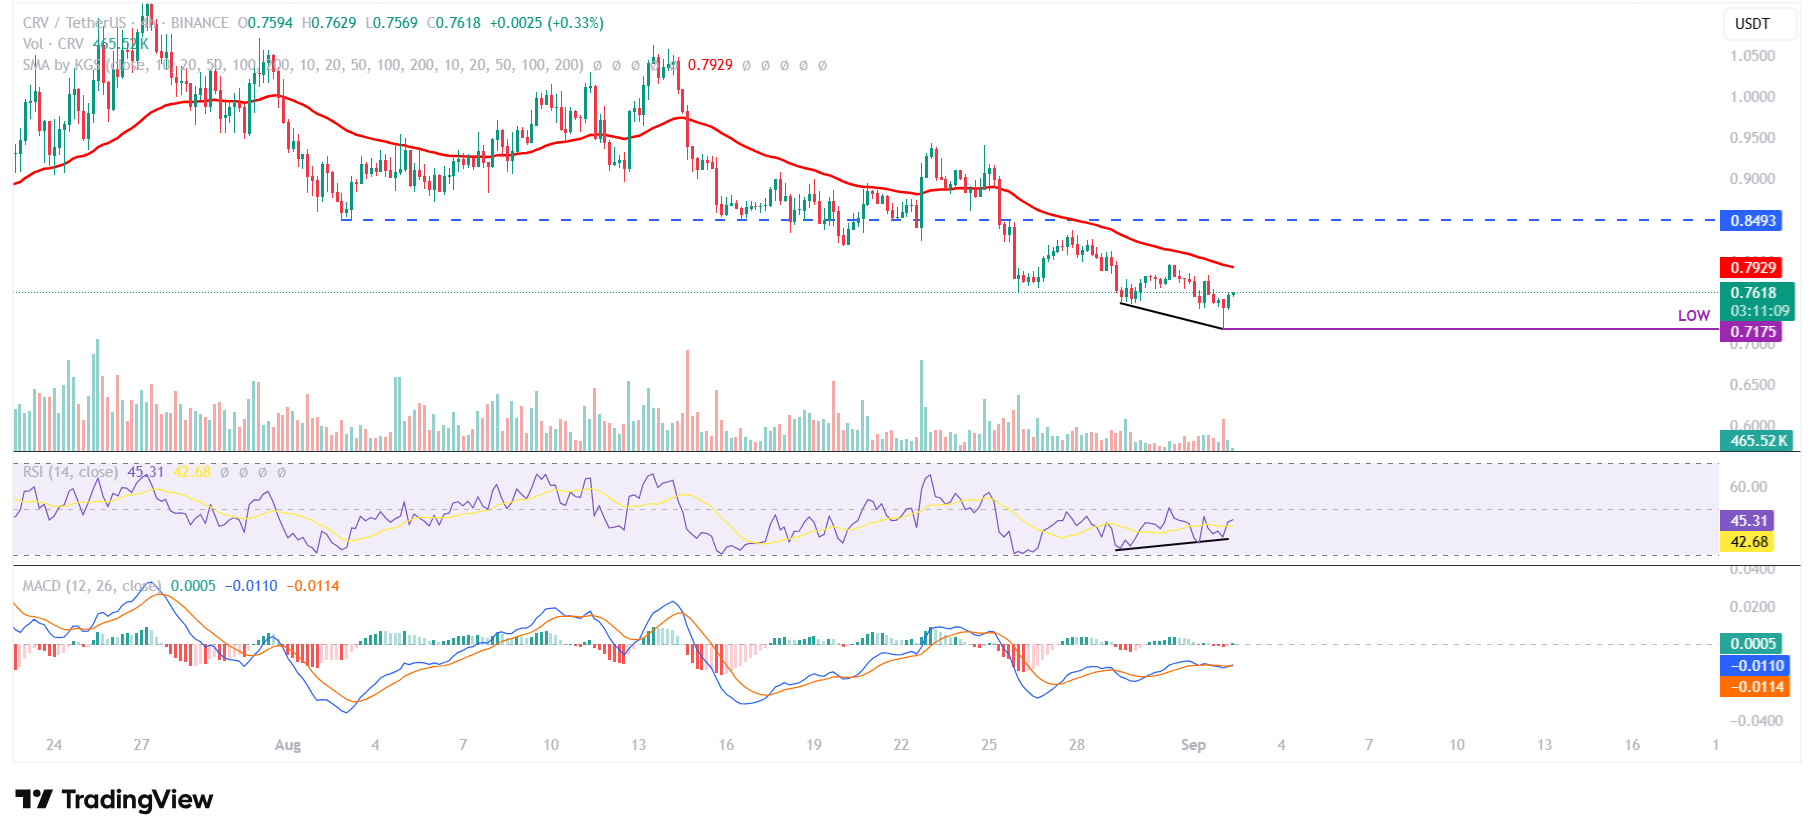
CRV/USDT 4-hour chart
However, if CRV faces a correction, it could extend the decline toward its Monday’s low at $0.71.
Recommended Articles


