
USD/CHF steadies near 13-year low ahead of Swiss CPI, US NFP
- USD/CHF remains unchanged on Wednesday, trading around 0.7913 and staying close to its lowest level since July 2011.
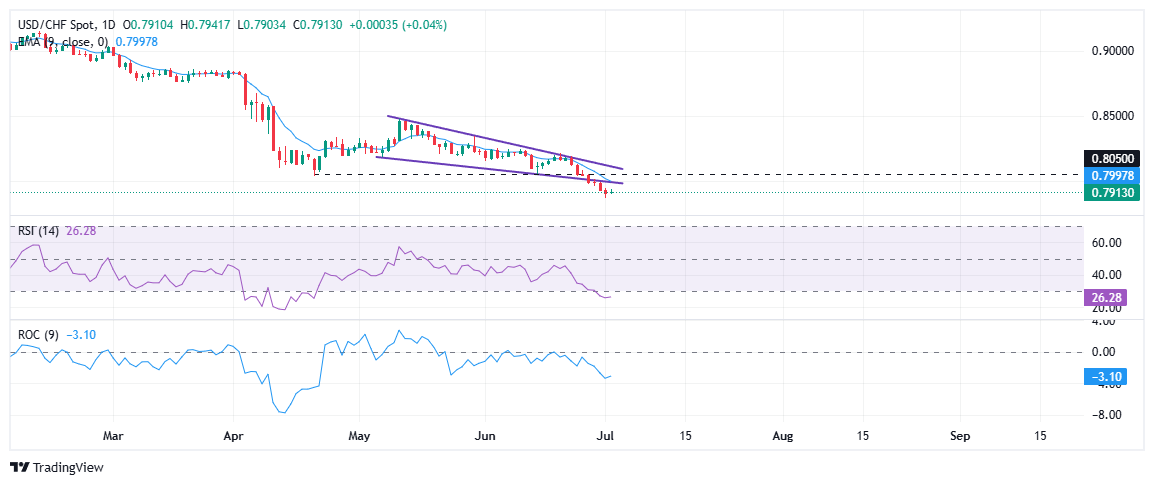
- Technical bias remains bearish following a breakdown of the falling wedge on the daily chart.
- Traders will be eyeing the Swiss CPI data and the US NFP report, due on Thursday, for fresh direction.
The Swiss Franc (CHF) is trading flat against the US Dollar (USD) on Wednesday as the greenback finds some footing following an extended decline. The USD/CHF pair is hovering around 0.7913 after reaching an intraday high of 0.7941, holding near its lowest level since July 2011. Despite the lack of directional momentum, the broader technical setup continues to favor the bears, with the pair holding near multi-year lows and showing signs of further downside pressure.
Recent commentary from the Swiss National Bank (SNB) also suggested a willingness to revive unconventional tools if inflation pressures reemerge. SNB board member Attilio Zanetti suggested that negative interest rates remain on the table if necessary to anchor price stability, adding that the central bank still has “sufficient instruments” even with policy rates near zero. While such measures aren’t imminent, the remarks underline the SNB’s flexible stance and its openness to act if economic conditions worsen.
At the same time, the International Monetary Fund (IMF) revised down its 2025 Swiss Gross Domestic Product (GDP) forecast to 1.3%, from 1.7% previously, citing risks from geopolitical tensions, energy market volatility, and the persistently strong Swiss Franc. Growth is expected to slow further to 1.2% in 2026.
From a technical perspective, recently, the price broke below a falling wedge pattern on the daily chart. This kind of pattern can sometimes signal a trend reversal, but in this case, it is supporting the idea that the downtrend is likely to continue.
The pair is also trading below its 9-day Exponential Moving Average (EMA), offering dynamic resistance around 0.7998. The inability to reclaim this short-term moving average suggests that sellers are still firmly in control, and any upside attempt may be capped unless the pair closes decisively above the EMA.
Momentum indicators also support the bearish case. The Relative Strength Index (RSI) is hovering near 26.78, deep in oversold territory. While this suggests that the pair may be due for a short-term technical bounce, such moves tend to be corrective rather than trend-changing in nature, especially when the broader trend is clearly pointing lower. Meanwhile, the Rate of Change (ROC) remains negative at -3.06, indicating sustained downside momentum and a lack of bullish conviction.
Immediate support for USD/CHF is seen at the 0.7900 psychological mark. A clean daily close below this level could pave the way for further losses toward 0.7800, which marks the next key support zone. This level hasn’t been tested in over a decade and could attract some buying interest. However, given the current momentum, the risk remains tilted to the downside.
On the other hand, any recovery attempt will likely encounter resistance at 0.7998 (9-day EMA), followed by the 0.8050 zone, which is the former support that has now turned into resistance. A decisive move above both levels could temporarily ease the bearish pressure, but as long as the pair remains below the 0.8500 psychological mark, the broader trend will continue to favor the Swiss Franc.
Looking ahead, traders will focus on Swiss Consumer Price Index (CPI) data due on Thursday, which could offer fresh clues on the SNB’s policy path. On the other side, the spotlight will shift to the US Nonfarm Payrolls (NFP) report. Any surprises on the jobs front could trigger fresh volatility in USD/CHF.
Recommended Articles


