


EUR/USD pares some losses ahead of Eurozone PMI data
- The Euro picks up to 1.1540 from 1.1500 lows as the US Dollar loses steam.
- US Nonfarm payrolls beat forecasts in September, but the jobless rate grew unexpectedly
- Eurozone PMIs are expected to show a moderate improvement in business activity.
EUR/USD is going through a mild recovery on Friday, trading at the 1.1545 area at the time of writing, after bouncing from two-week lows on Thursday, right above 1.1500. The pair, however, remains on track for a nearly 0.7% weekly decline, with investors awaiting the release of the Eurozone preliminary HCOB Purchasing Managers' Index (PMI) data, due later today.
The US Dollar (USD) has maintained a firm tone through the week, as investors came to terms wth the fact that the US Federal Reserve (Fed) might take some time before easing its monetary policy further. The minutes of October's FOMC meeting revealed a wide divergence among policymakers, and the long-awaited Nonfarm Payrolls (NFP) data for September has failed to shed further light on the outcome of the Fed's December meeting.
The US economy added more jobs than forecasted in September, according to data from the US Department of Labor, but the Unemployment Rate unexpectedly increased to a 4-year high of 4.4%. The final data left traders puzzled about the Fed's near-term path, but hopes of a December interest rate cut receded further. The US Dollar, however, lost some ground following the data release.
The focus today is on the Eurozone PMIs ahead of the speeches of European Central Bank officials, Christine Lagarde, Luis de Guindos, Joachim Nagel, and José Luis Escrivá. In the US session, the S&P Global preliminary PMIs and November's Michigan Consumer Sentiment Index, together with a slew of Fed officials, will provide the fundamental guidance for the USD.
Euro Price Today
The table below shows the percentage change of Euro (EUR) against listed major currencies today. Euro was the strongest against the US Dollar.
| USD | EUR | GBP | JPY | CAD | AUD | NZD | CHF | |
|---|---|---|---|---|---|---|---|---|
| USD | -0.13% | -0.17% | -0.24% | -0.10% | -0.13% | -0.21% | -0.19% | |
| EUR | 0.13% | -0.03% | -0.11% | 0.03% | 0.00% | -0.09% | -0.06% | |
| GBP | 0.17% | 0.03% | -0.10% | 0.06% | 0.04% | -0.05% | -0.03% | |
| JPY | 0.24% | 0.11% | 0.10% | 0.16% | 0.13% | 0.03% | 0.06% | |
| CAD | 0.10% | -0.03% | -0.06% | -0.16% | -0.03% | -0.13% | -0.09% | |
| AUD | 0.13% | -0.01% | -0.04% | -0.13% | 0.03% | -0.09% | -0.07% | |
| NZD | 0.21% | 0.09% | 0.05% | -0.03% | 0.13% | 0.09% | 0.02% | |
| CHF | 0.19% | 0.06% | 0.03% | -0.06% | 0.09% | 0.07% | -0.02% |
The heat map shows percentage changes of major currencies against each other. The base currency is picked from the left column, while the quote currency is picked from the top row. For example, if you pick the Euro from the left column and move along the horizontal line to the US Dollar, the percentage change displayed in the box will represent EUR (base)/USD (quote).
Daily digest market movers: The Euro picks up on profit-taking
- US Nonfarm Payrolls data was mixed, but investors pared back expectations of a Fed rate cut in December. The US Dollar, however, is pulling back from highs, as traders might be taking profits after a sharp rally in the previous five trading days. The Euro, on the other hand, has no fundamental support for a significant recovery.
- On Friday, all eyes will be on the Eurozone preliminary HCOB PMIs for November. Services PMI is expected to have remained steady at 53.0, while the Manufacturing PMI is seen accelerating to 50.2 from the 50.0 level seen in October.
- In the US, S&P Global preliminary Manufacturing PMI is expected to have slowed to 52.0 in November from 52.5 in October, while the Services PMI is expected to remain steady at a 54.8 rate.
- Later on the day, the Michigan Consumer Sentiment Index is expected to show a moderate improvement, to 50.5 in November from last month's 50.3 reading. Consumer Inflation Expectations for the next 12 months are seen at 4.7% and at 3.6% in the next five years, in both cases, unchanged from October.
- On Thursday, US Nonfarm Payrolls data beat expectations with a 119K net increase in employment in September, well above the 50K gain consensus. August's reading was revised down to 4K net loss from the previously estimated 22K increase. The Unemployment Rate, however, unexpectedly rose to 4.4% from 4.3% in the previous month, which curbed market enthusiasm about the data release.
- In the Eurozone, the European Commission's preliminary Consumer Confidence Index remained steady at -14.2 in November, against expectations of a moderate improvement to -14.0.
Technical Analysis: EUR/USD is likely to meet resistance at 1.1550
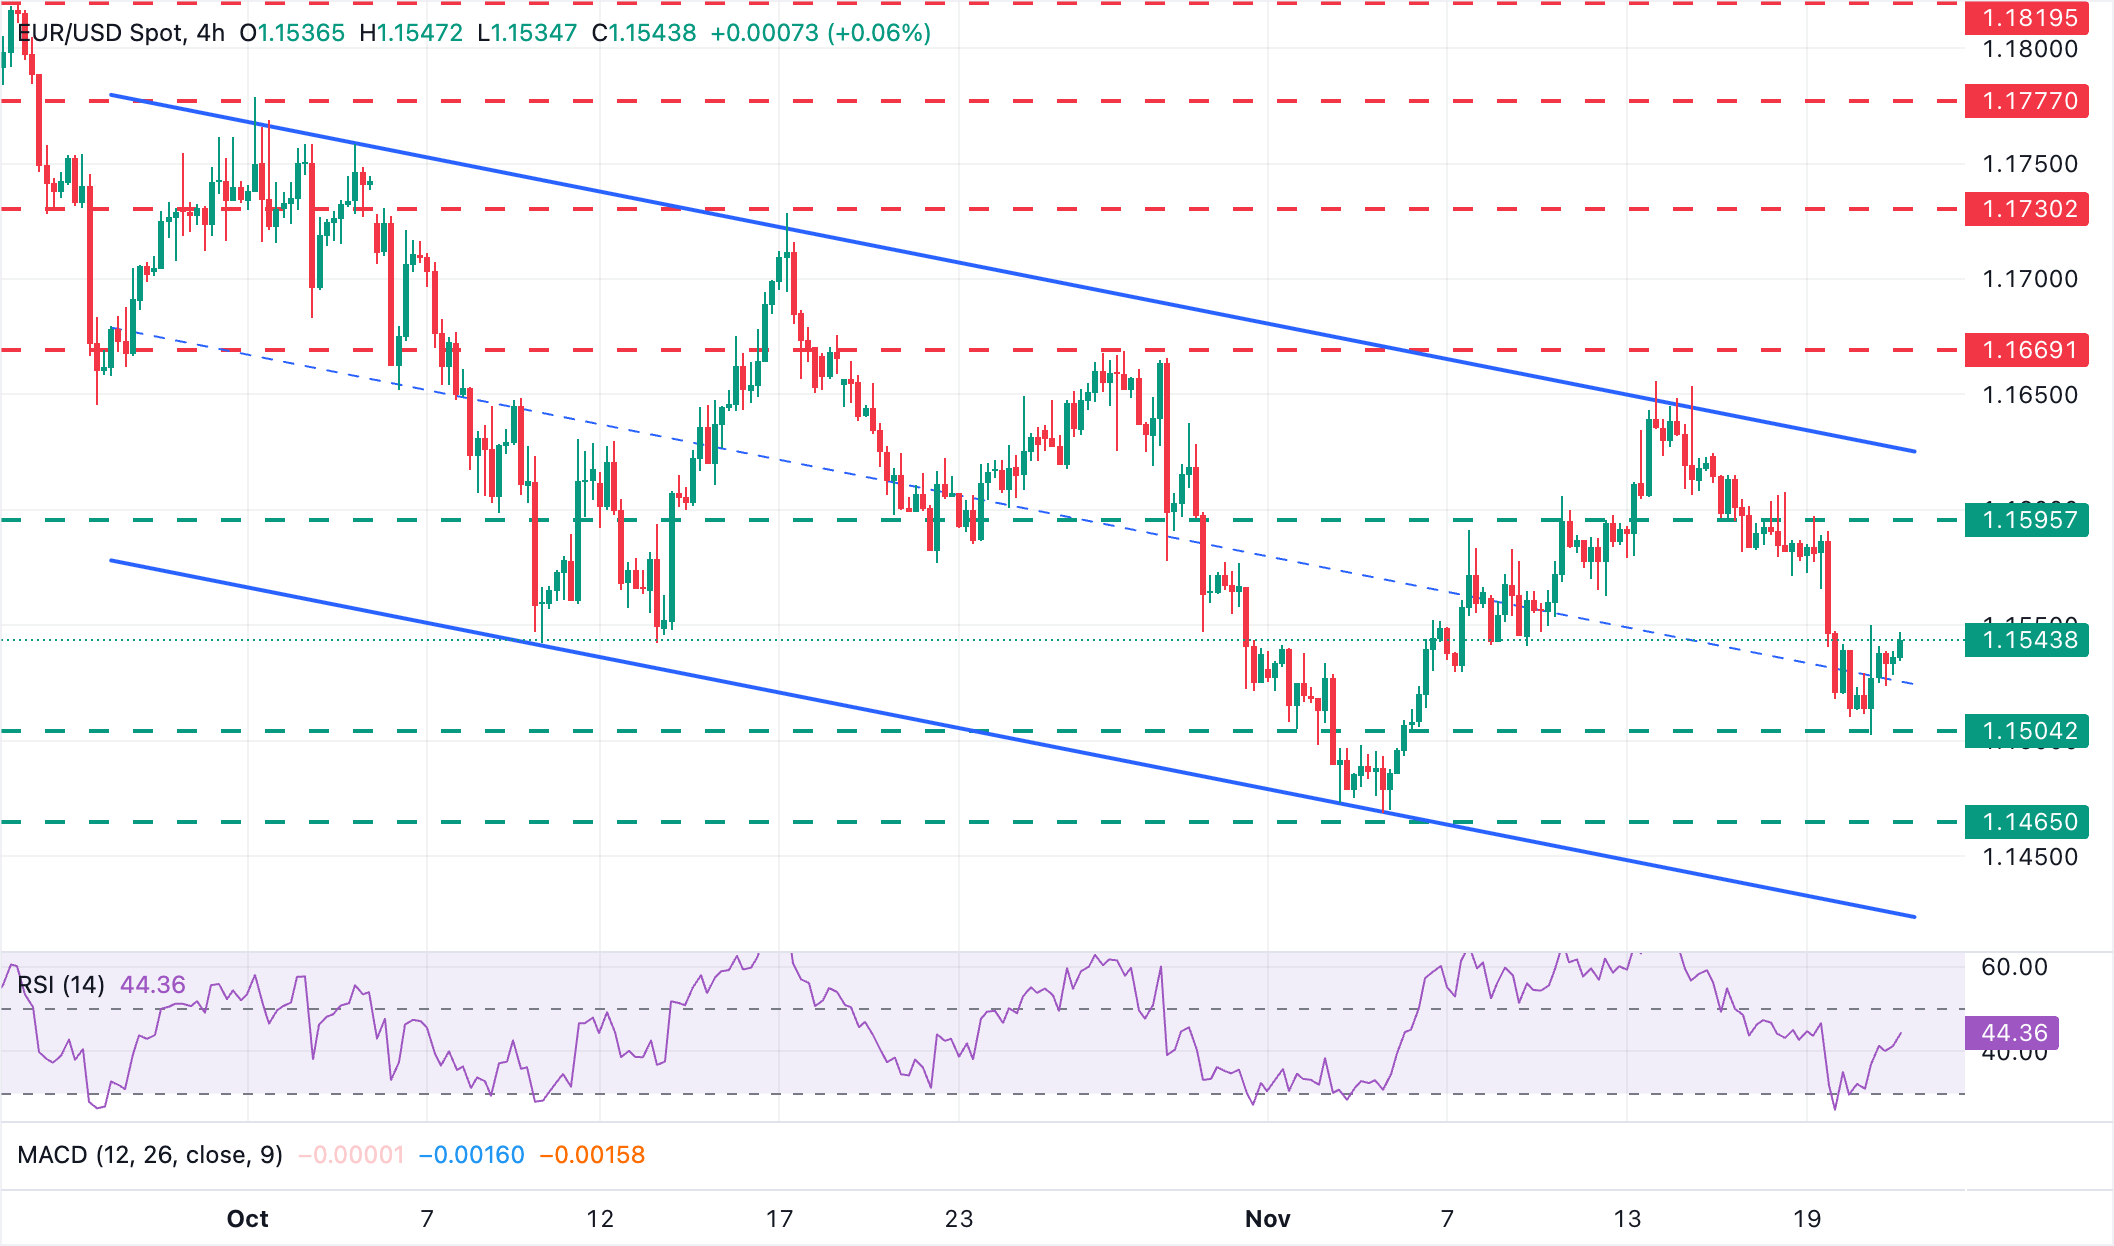
The EUR/USD has bounced from two-week lows at the 1.1500 area but remains trading within Thursday's range, with 1.1550 likely to challenge bulls. Technical indicators are trending higher on the 4-hour chart, but the Relative Strength Index (RSI) remains below the key 50 level, which suggests that the recovery attempt remains frail.
The pair should breach Thursday's high at the mentioned 1.1550 level, to gather momentum, and shift the focus to the November 18 and 19 highs in the area of 1.1600 and to the top of a descending channel from the mid-October highs, which is now around 1.1625.
However, failure to break 1.1550 might increase bears' confidence to retest the 1.1500 psychological level, focusing on the November 5 lows, near 1.1470, and the mentioned channel support, around 1.1425.
Economic Indicator
HCOB Manufacturing PMI
The Manufacturing Purchasing Managers Index (PMI), released on a monthly basis by S&P Global and Hamburg Commercial Bank (HCOB), is a leading indicator gauging business activity in the Eurozone manufacturing sector. The data is derived from surveys of senior executives at private-sector companies from the manufacturing sector. Survey responses reflect the change, if any, in the current month compared to the previous month and can anticipate changing trends in official data series such as Gross Domestic Product (GDP), industrial production, employment and inflation. The index varies between 0 and 100, with levels of 50.0 signaling no change over the previous month. A reading above 50 indicates that the manufacturing economy is generally expanding, a bullish sign for the Euro (EUR). Meanwhile, a reading below 50 signals that activity among goods producers is generally declining, which is seen as bearish for EUR.
Read more.Next release: Fri Nov 21, 2025 09:00 (Prel)
Frequency: Monthly
Consensus: 50.2
Previous: 50
Source: S&P Global
Economic Indicator
HCOB Services PMI
The Services Purchasing Managers Index (PMI), released on a monthly basis by S&P Global and Hamburg Commercial Bank (HCOB), is a leading indicator gauging business activity in the Eurozone services sector. As the services sector dominates a large part of the economy, the Services PMI is an important indicator gauging the state of overall economic conditions. The data is derived from surveys of senior executives at private-sector companies from the services sector. Survey responses reflect the change, if any, in the current month compared to the previous month and can anticipate changing trends in official data series such as Gross Domestic Product (GDP), industrial production, employment and inflation. The index varies between 0 and 100, with levels of 50.0 signaling no change over the previous month. A reading above 50 indicates that the services economy is generally expanding, a bullish sign for the Euro (EUR). Meanwhile, a reading below 50 signals that activity among services providers is generally declining, which is seen as bearish for EUR.
Read more.Next release: Fri Nov 21, 2025 09:00 (Prel)
Frequency: Monthly
Consensus: 53
Previous: 53
Source: S&P Global
Recommended Articles


