
EUR/GBP steady near 0.87 amid French unrest and UK fiscal challenges
- The EUR/GBP trades within tight 0.8650–0.8750 band amid France’s political turmoil and Britain’s stagnating job market.
- Macron’s meeting with opposition yields little progress; pension reform delay signals persistent instability in France.
- Investors eye diverging policy paths, with ECB likely on hold while BoE seen cutting rates twice in 2026.
The EUR/GBP advanced on Friday but remained shy of the 0.8700 figure after hitting a daily high of 0.8725 earlier during the European session. France political turmoil and a stagnating economy in the UK, could keep the cross-pair trading within familiar levels of 0.8650-0.8750.
Euro steadies as uncertainty in Paris offsets weak UK outlook and dovish BoE expectations
Market mood turned negative as US President Donald Trump threatened to impose additional tariffs on China, after the latter-imposed export controls on rare earths.
Aside from this, the reunion between opposing parties and French President Emmanuel Macron finished. France’s economist party’s Marine Tondelier said that Macron was ready to delay further application of pension reform. She added that she does not expect a premier from the left.
Meanwhile, Britain’s jobs market remains sluggish as reported by a survey of recruitment companies. Uncertainty about UK public finances weighs on Sterling, as investors expect an increase in taxes so Chancellor Rachel Reeves could meet her fiscal targets.
From a central bank perspective, the Bank of England and the European Central Bank are expected to keep rates unchanged. Nevertheless, the former is expected to cut twice next year, while the ECB, finished its easing cycle as confirmed by President Christine Lagarde who said the disinflation process is over.
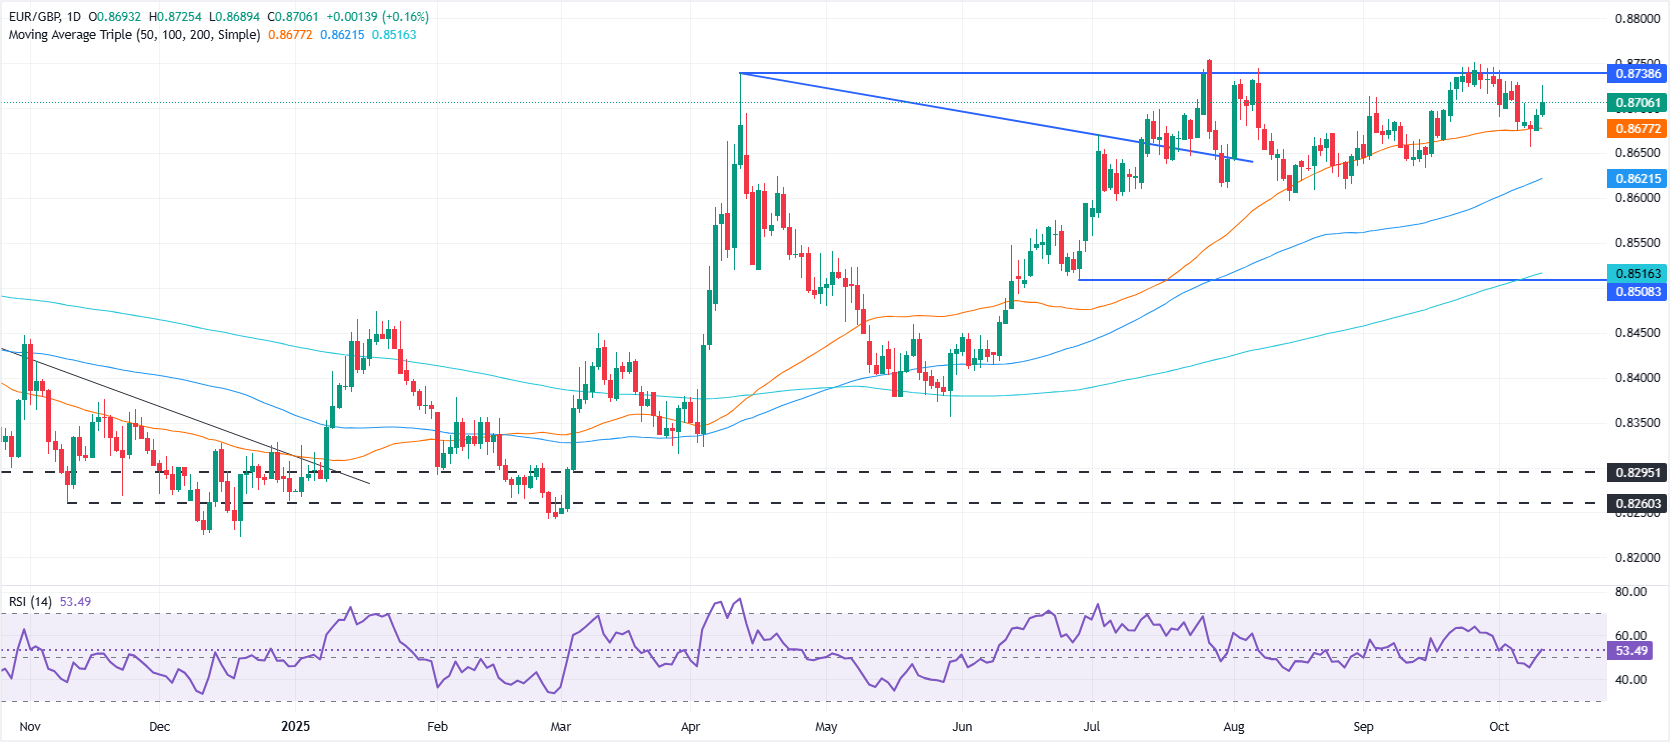
EUR/GBP Price Forecast: Technical outlook
The technical picture shows the EUR/GBP might remain consolidating, even though the trend is slightly up. Bullish momentum diminished, and if sellers drive the pair below the 50-day SMA at 0.8677, they threaten to clear the latest cycle low seen at 0.8656, the October 8 low. A breach of the latter will expose 0.8600.
On the upside, if buyers claim 0.8700, they could test September’s high at 0.8751.
Pound Sterling Price This week
The table below shows the percentage change of British Pound (GBP) against listed major currencies this week. British Pound was the strongest against the New Zealand Dollar.
| USD | EUR | GBP | JPY | CAD | AUD | NZD | CHF | |
|---|---|---|---|---|---|---|---|---|
| USD | 0.80% | 0.67% | 1.39% | 0.32% | 1.52% | 1.61% | 0.50% | |
| EUR | -0.80% | -0.24% | 0.49% | -0.52% | 0.67% | 0.75% | -0.35% | |
| GBP | -0.67% | 0.24% | 0.83% | -0.27% | 0.93% | 1.01% | -0.10% | |
| JPY | -1.39% | -0.49% | -0.83% | -1.01% | 0.08% | 0.14% | -0.94% | |
| CAD | -0.32% | 0.52% | 0.27% | 1.01% | 1.23% | 1.28% | 0.19% | |
| AUD | -1.52% | -0.67% | -0.93% | -0.08% | -1.23% | 0.08% | -1.01% | |
| NZD | -1.61% | -0.75% | -1.01% | -0.14% | -1.28% | -0.08% | -1.09% | |
| CHF | -0.50% | 0.35% | 0.10% | 0.94% | -0.19% | 1.01% | 1.09% |
The heat map shows percentage changes of major currencies against each other. The base currency is picked from the left column, while the quote currency is picked from the top row. For example, if you pick the British Pound from the left column and move along the horizontal line to the US Dollar, the percentage change displayed in the box will represent GBP (base)/USD (quote).
Recommended Articles


