
GBP/USD climbs as Fed-BoE policy divergence fuels Pound strength
- GBP/USD rises after US NFP shows just 22K jobs added, pushing unemployment to 4.3%.
- Markets fully price September 25 bps Fed cut, while slim 8% chance remains for larger 50 bps easing move.
- BoE expected to hold rates steady as strong retail sales and higher inflation limit policy flexibility.
The Pound Sterling advances at the beginning of the week as traders continue to digest the recent US employment report that keeps investors’ chances about an interest rate cut by the Fed. At the time of writing, the GBP/USD trades at 1.3541, up 0.26%.
Pound gains 0.26% as weak US jobs cement Fed cut bets, while BoE seen holding rates on inflation uptick
Last Friday delivered a Nonfarm Payrolls report for August that showed that just 22K people were added to the workforce in the US. This pushed the Unemployment Rate up from 4.2% to 4.3% and cemented the case for a 25-bps rate cut by the US central bank at the upcoming September meeting.
Some market participants are wondering about a possible 50 bps rate cut, with odds standing slim, at around 8%, revealed the Prime Market Terminal interest rate probability tool.
Contrarily, the Bank of England (BoE) is projected to hold rates unchanged due to the latest uptick on inflation. Also, solid Retail Sales revealed last week, could tie BoE’s hands to ease policy next week.
Therefore, monetary policy divergence between the Fed and the BoE, favors further upside on the GBP/USD. Nevertheless, traders would be eyeing the release of the Consumer Price Index (CPI) in the US, for August. A softer reading than expected could prompt investors to price in additional monetary policy relaxation by the Fed.
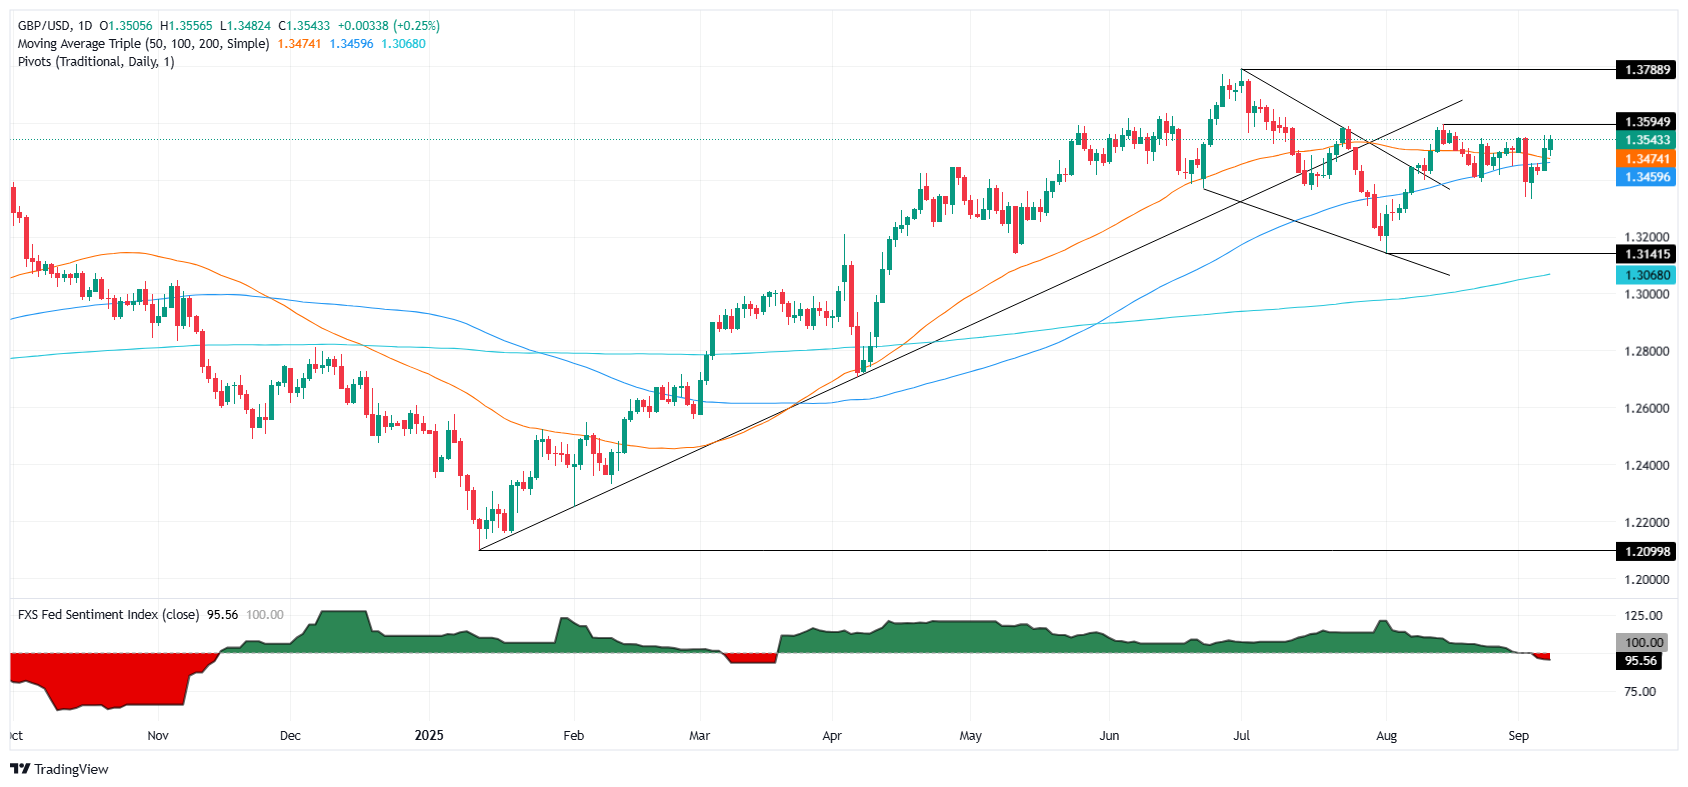
GBP/USD Price Forecast: Technical outlook
The GBP/USD consolidated, but a clear break above 1.3560 could push the pair towards 1.3600. Momentum favors further upside with the Relative Strength Index (RSI) aiming higher at bullish territory, but shy of overbought conditions.
If buyers reclaim 1.3600, the next stop would be the July 4 high of 1.3681, ahead of 1.3700. Conversely, a drop below 1.3550 could expose the 1.3500 figure. On further weakness, the next key support levels would be the 20-day Simple Moving Average (SMA) and the 50-day SMA, each at 1.3491 and 1.3470, respectively.
Pound Sterling Price Today
The table below shows the percentage change of British Pound (GBP) against listed major currencies today. British Pound was the strongest against the US Dollar.
| USD | EUR | GBP | JPY | CAD | AUD | NZD | CHF | |
|---|---|---|---|---|---|---|---|---|
| USD | -0.29% | -0.27% | -0.46% | -0.09% | -0.55% | -0.74% | -0.64% | |
| EUR | 0.29% | 0.00% | -0.07% | 0.19% | -0.25% | -0.41% | -0.35% | |
| GBP | 0.27% | -0.01% | -0.16% | 0.18% | -0.26% | -0.42% | -0.36% | |
| JPY | 0.46% | 0.07% | 0.16% | 0.27% | -0.15% | -0.46% | -0.19% | |
| CAD | 0.09% | -0.19% | -0.18% | -0.27% | -0.37% | -0.60% | -0.55% | |
| AUD | 0.55% | 0.25% | 0.26% | 0.15% | 0.37% | -0.16% | -0.10% | |
| NZD | 0.74% | 0.41% | 0.42% | 0.46% | 0.60% | 0.16% | 0.06% | |
| CHF | 0.64% | 0.35% | 0.36% | 0.19% | 0.55% | 0.10% | -0.06% |
The heat map shows percentage changes of major currencies against each other. The base currency is picked from the left column, while the quote currency is picked from the top row. For example, if you pick the British Pound from the left column and move along the horizontal line to the US Dollar, the percentage change displayed in the box will represent GBP (base)/USD (quote).
Recommended Articles


