
Meme Coins Rally Begins: Dogecoin, Shiba Inu, Pepe regain momentum as risk-on sentiment thrives


Dogecoin jumps over 5% on Monday, hinting at a bullish week as it overcomes the fall last Thursday.
Shiba Inu signals a potential trend reversal with a wedge breakout, reinstating a bullish trend.
Pepe holds above a critical psychological support to bounce back, triggering a buy signal from the MACD indicator.
Meme coins market capitalization surged over 6% on Tuesday, surpassing $62 billion. Dogecoin (DOGE) and Shiba Inu (SHIB) recorded a rise of over 5% on Monday, while Pepe (PEPE) experienced a jump of over 8%. The technical outlook for DOGE and SHIB signals a potential breakout rally in the short term, while PEPE prepares for a trend reversal.
Dogecoin outgrows bearish channel, eyes $0.20 breakout
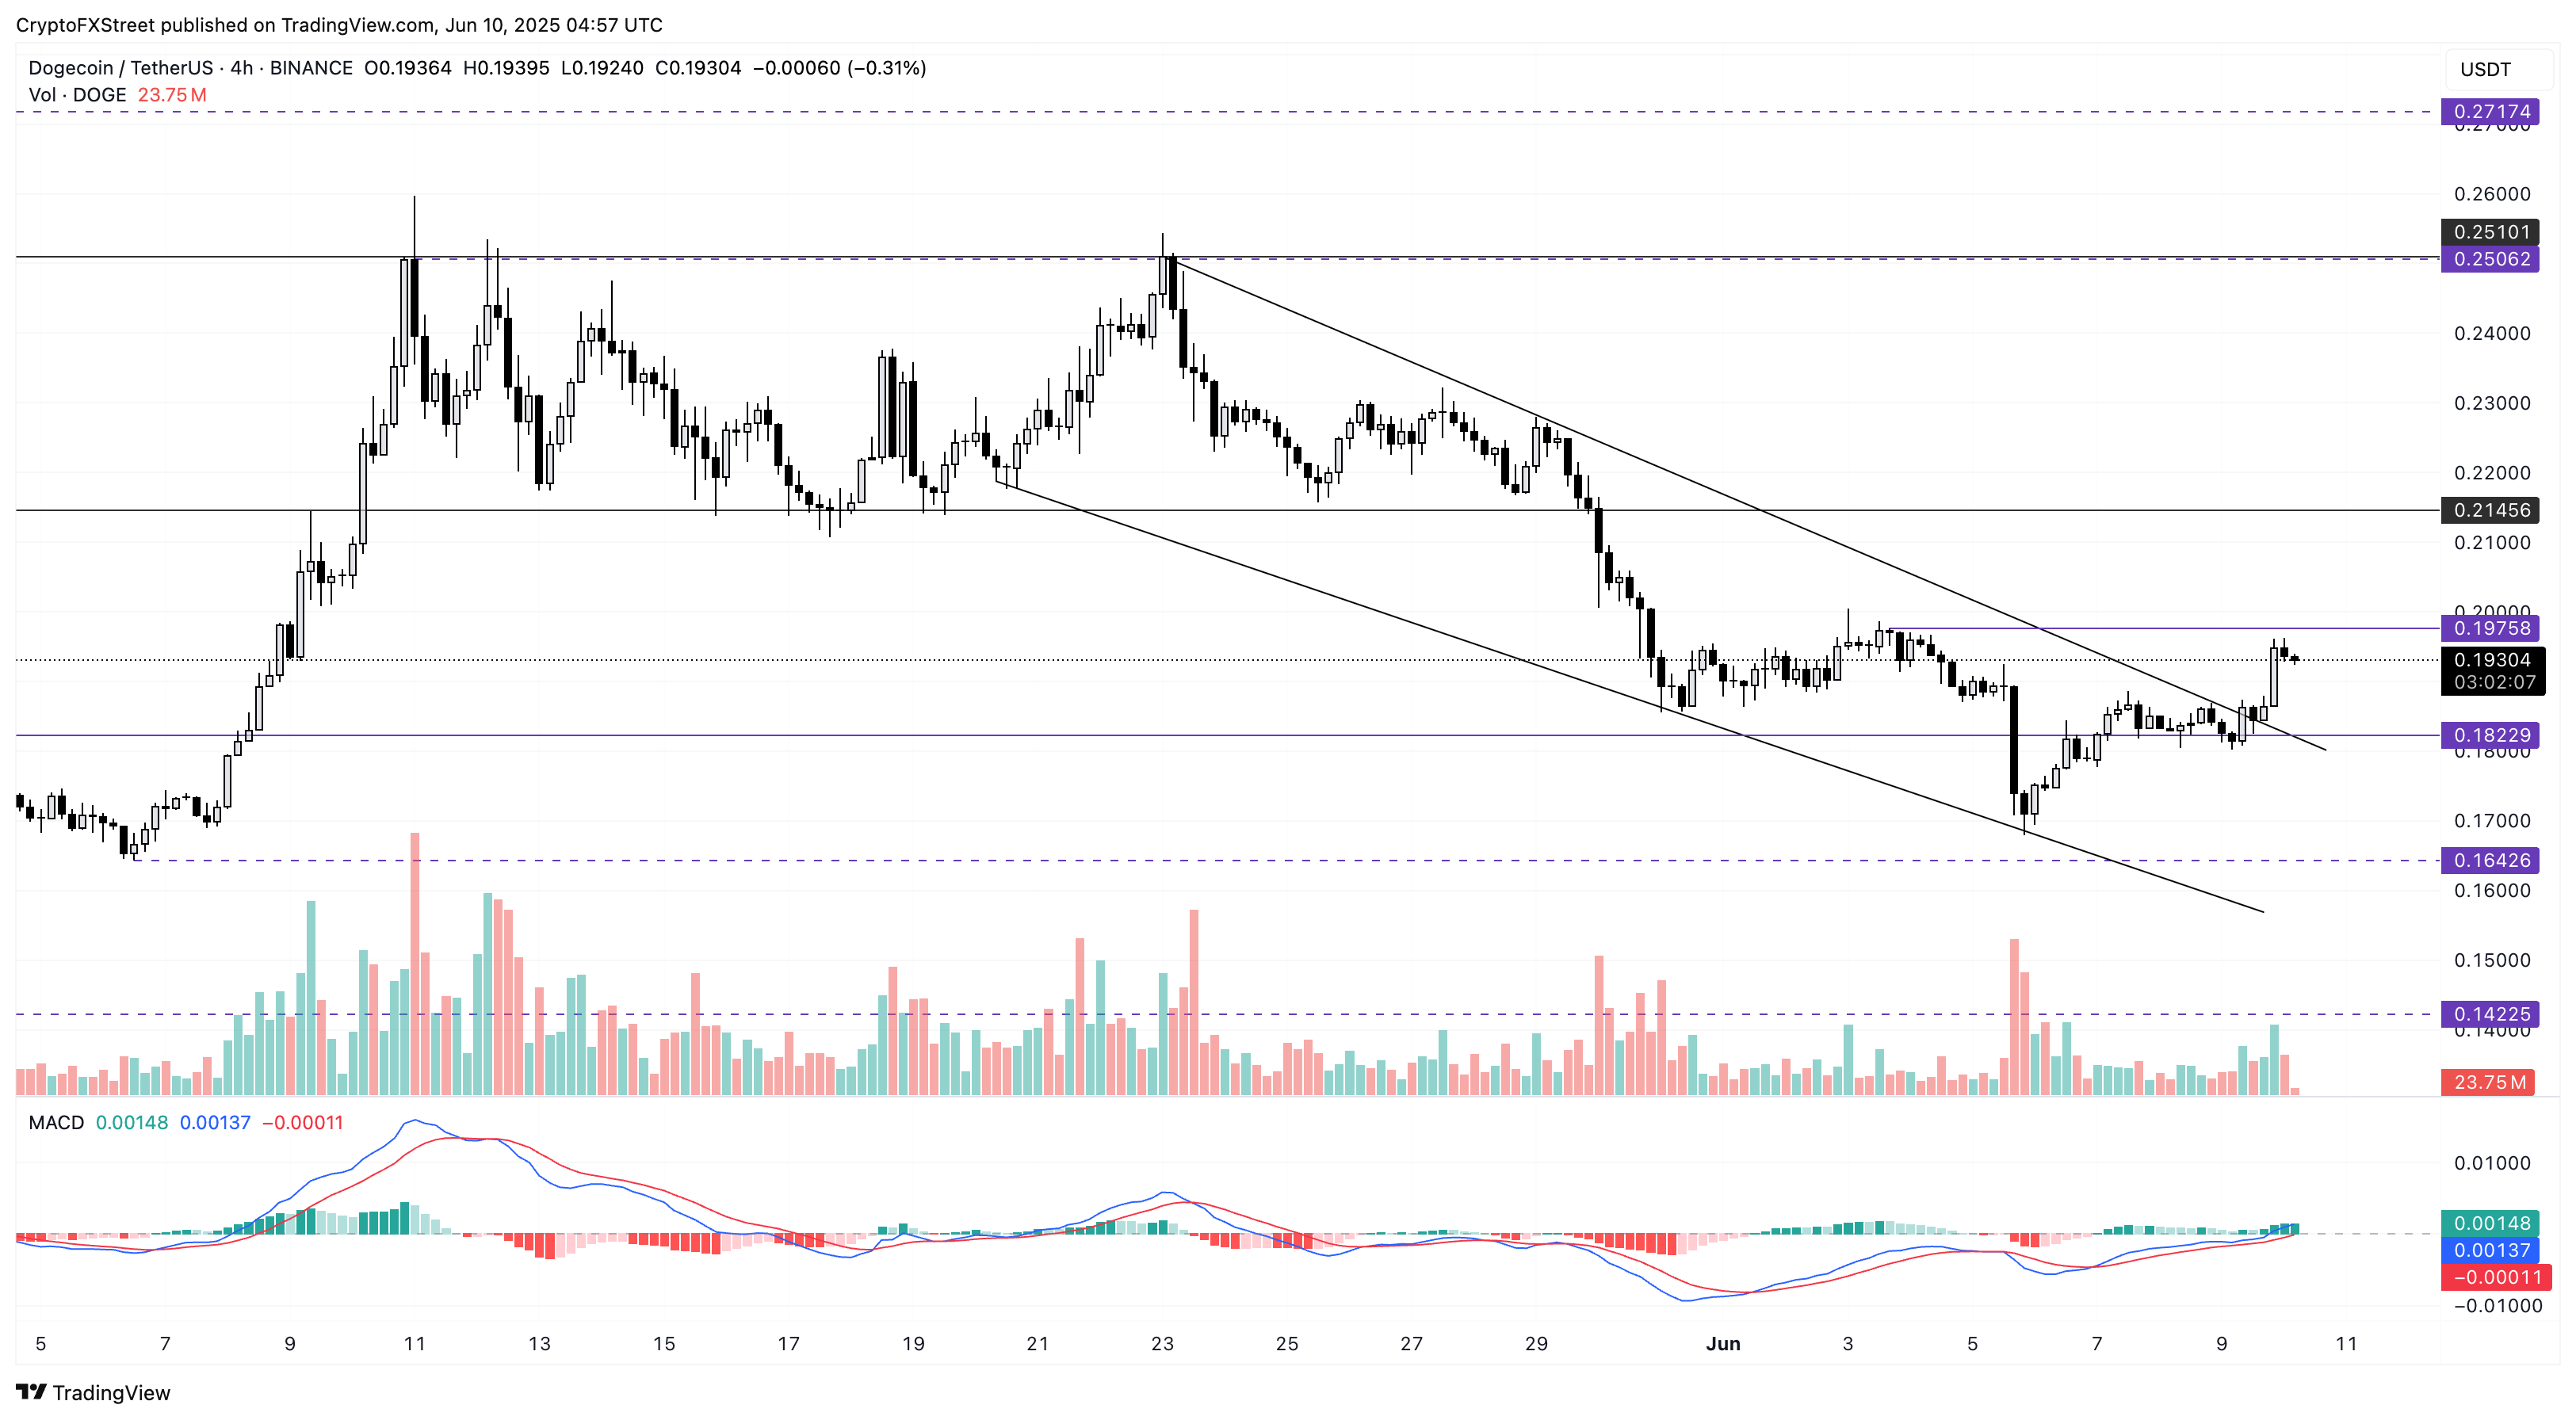
DOGE crosses above the resistance trendline formed by the peaks on May 23, May 29, and June 8 on the 4-hour price chart shared below. This marks the breakout of a falling channel, the price action formed a parallel support trendline with lows on May 20, May 31, and June 5.
At the time of writing, Dogecoin edges lower by under 1% on Tuesday, projecting a brief breather phase in motion. Suppose the meme coin closes above the highest weekly close at $0.1975 on the 4-hour chart. Investors could consider it a buying opportunity with the next immediate resistance at $0.2145.
The Moving Average Convergence/Divergence (MACD) indicator and its signal lines cross above the zero line, signaling a trend reversal.
SHIB/USDT 4-hour price chart. Source: Tradingview
Conversely, a reversal from the $0.1975 could result in a corrective trend to the broken trendline near $0.1822. Investors could find a selling opportunity if DOGE closes below $0.1822, with the support floor at $0.1642, last tested on May 6.
Shiba Inu marks a wedge pattern breakout
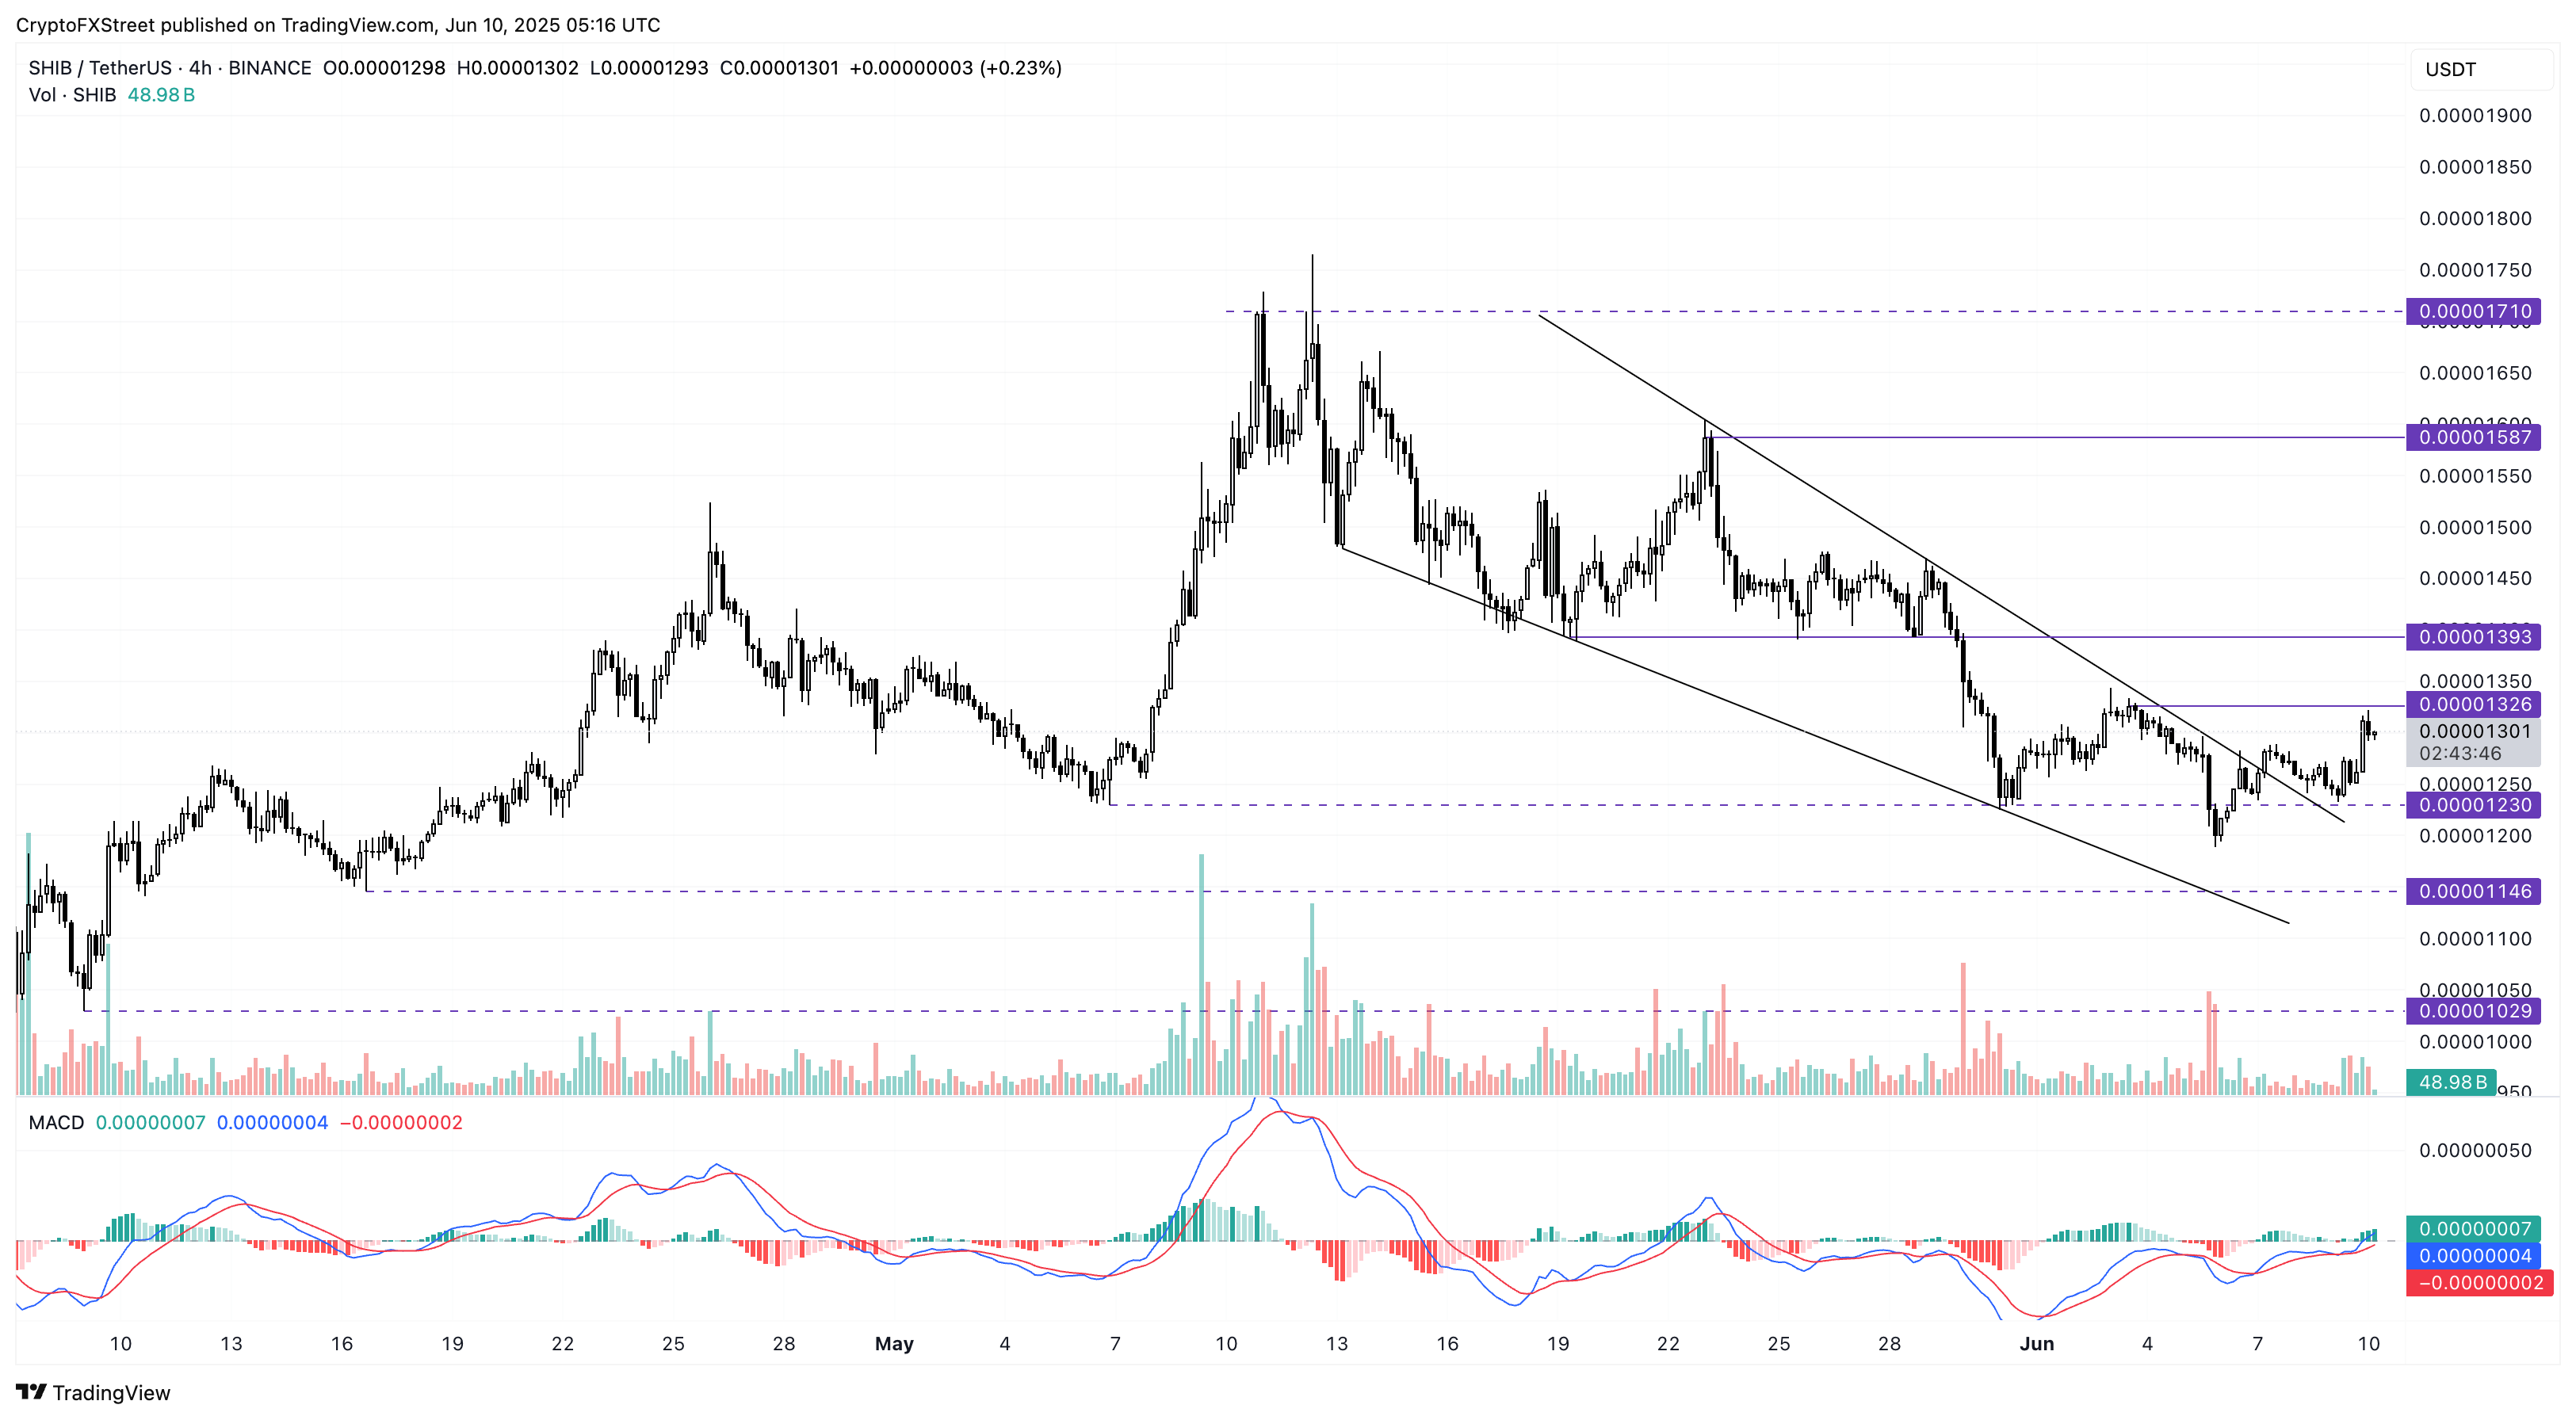
Shiba Inu drops marginally over 1% at press time on Tuesday after a sudden 5% jump on the day before. Similar to DOGE, the Ethereum-based meme coin breaks out of a local resistance trendline in the 4-hour chart, as shared below.
Despite a bounce off the $0.00001230 support floor, highlighted by the late May reversal, SHIB struggles to surpass the weekly high in the 4-hour chart at $0.00001329. A clean push above this resistance could propel SHIB towards the $0.00001393 level, which acted as a crucial support floor last month.
The MACD indicator surges above the zero line alongside its signal lines, projecting a high likelihood of trend reversal.
SHIB/USDT 4-hour price chart. Source: Tradingview
Conversely, a flip below $0.00001230 support could extend the declining trend to $0.00001029, the lowest price in April.
Pepe trend reversal shows massive upside potential
Pepe leads the gains among top meme coins with a surge of over 8% on Monday, printing its fourth consecutive bullish candle. The frog-themed Ethereum-based meme coin holds ground above the $0.000010 psychological support and marks the highest closing price in the last week, a complete recovery from the flash crash on Thursday.
At the time of writing, PEPE trades at $0.00001253 under the 50% Fibonacci level at $0.00001681, retraced from the all-time high at $0.00002836 to the year-to-date low at $0.00000525.
Investors with purchase costs below the 50% Fibonacci level are likely to boost buying pressure, as seen in early May, to reach the halfway mark as a profit booking spot. Thus, the meme coin recovery shows upside potential of over 30%.
The MACD indicator is on the verge of signalling a buy signal with the blue line ready to cross above the red line. A crossover aligned with the resurgence of bullish histograms from the zero line could signal a trend reversal.
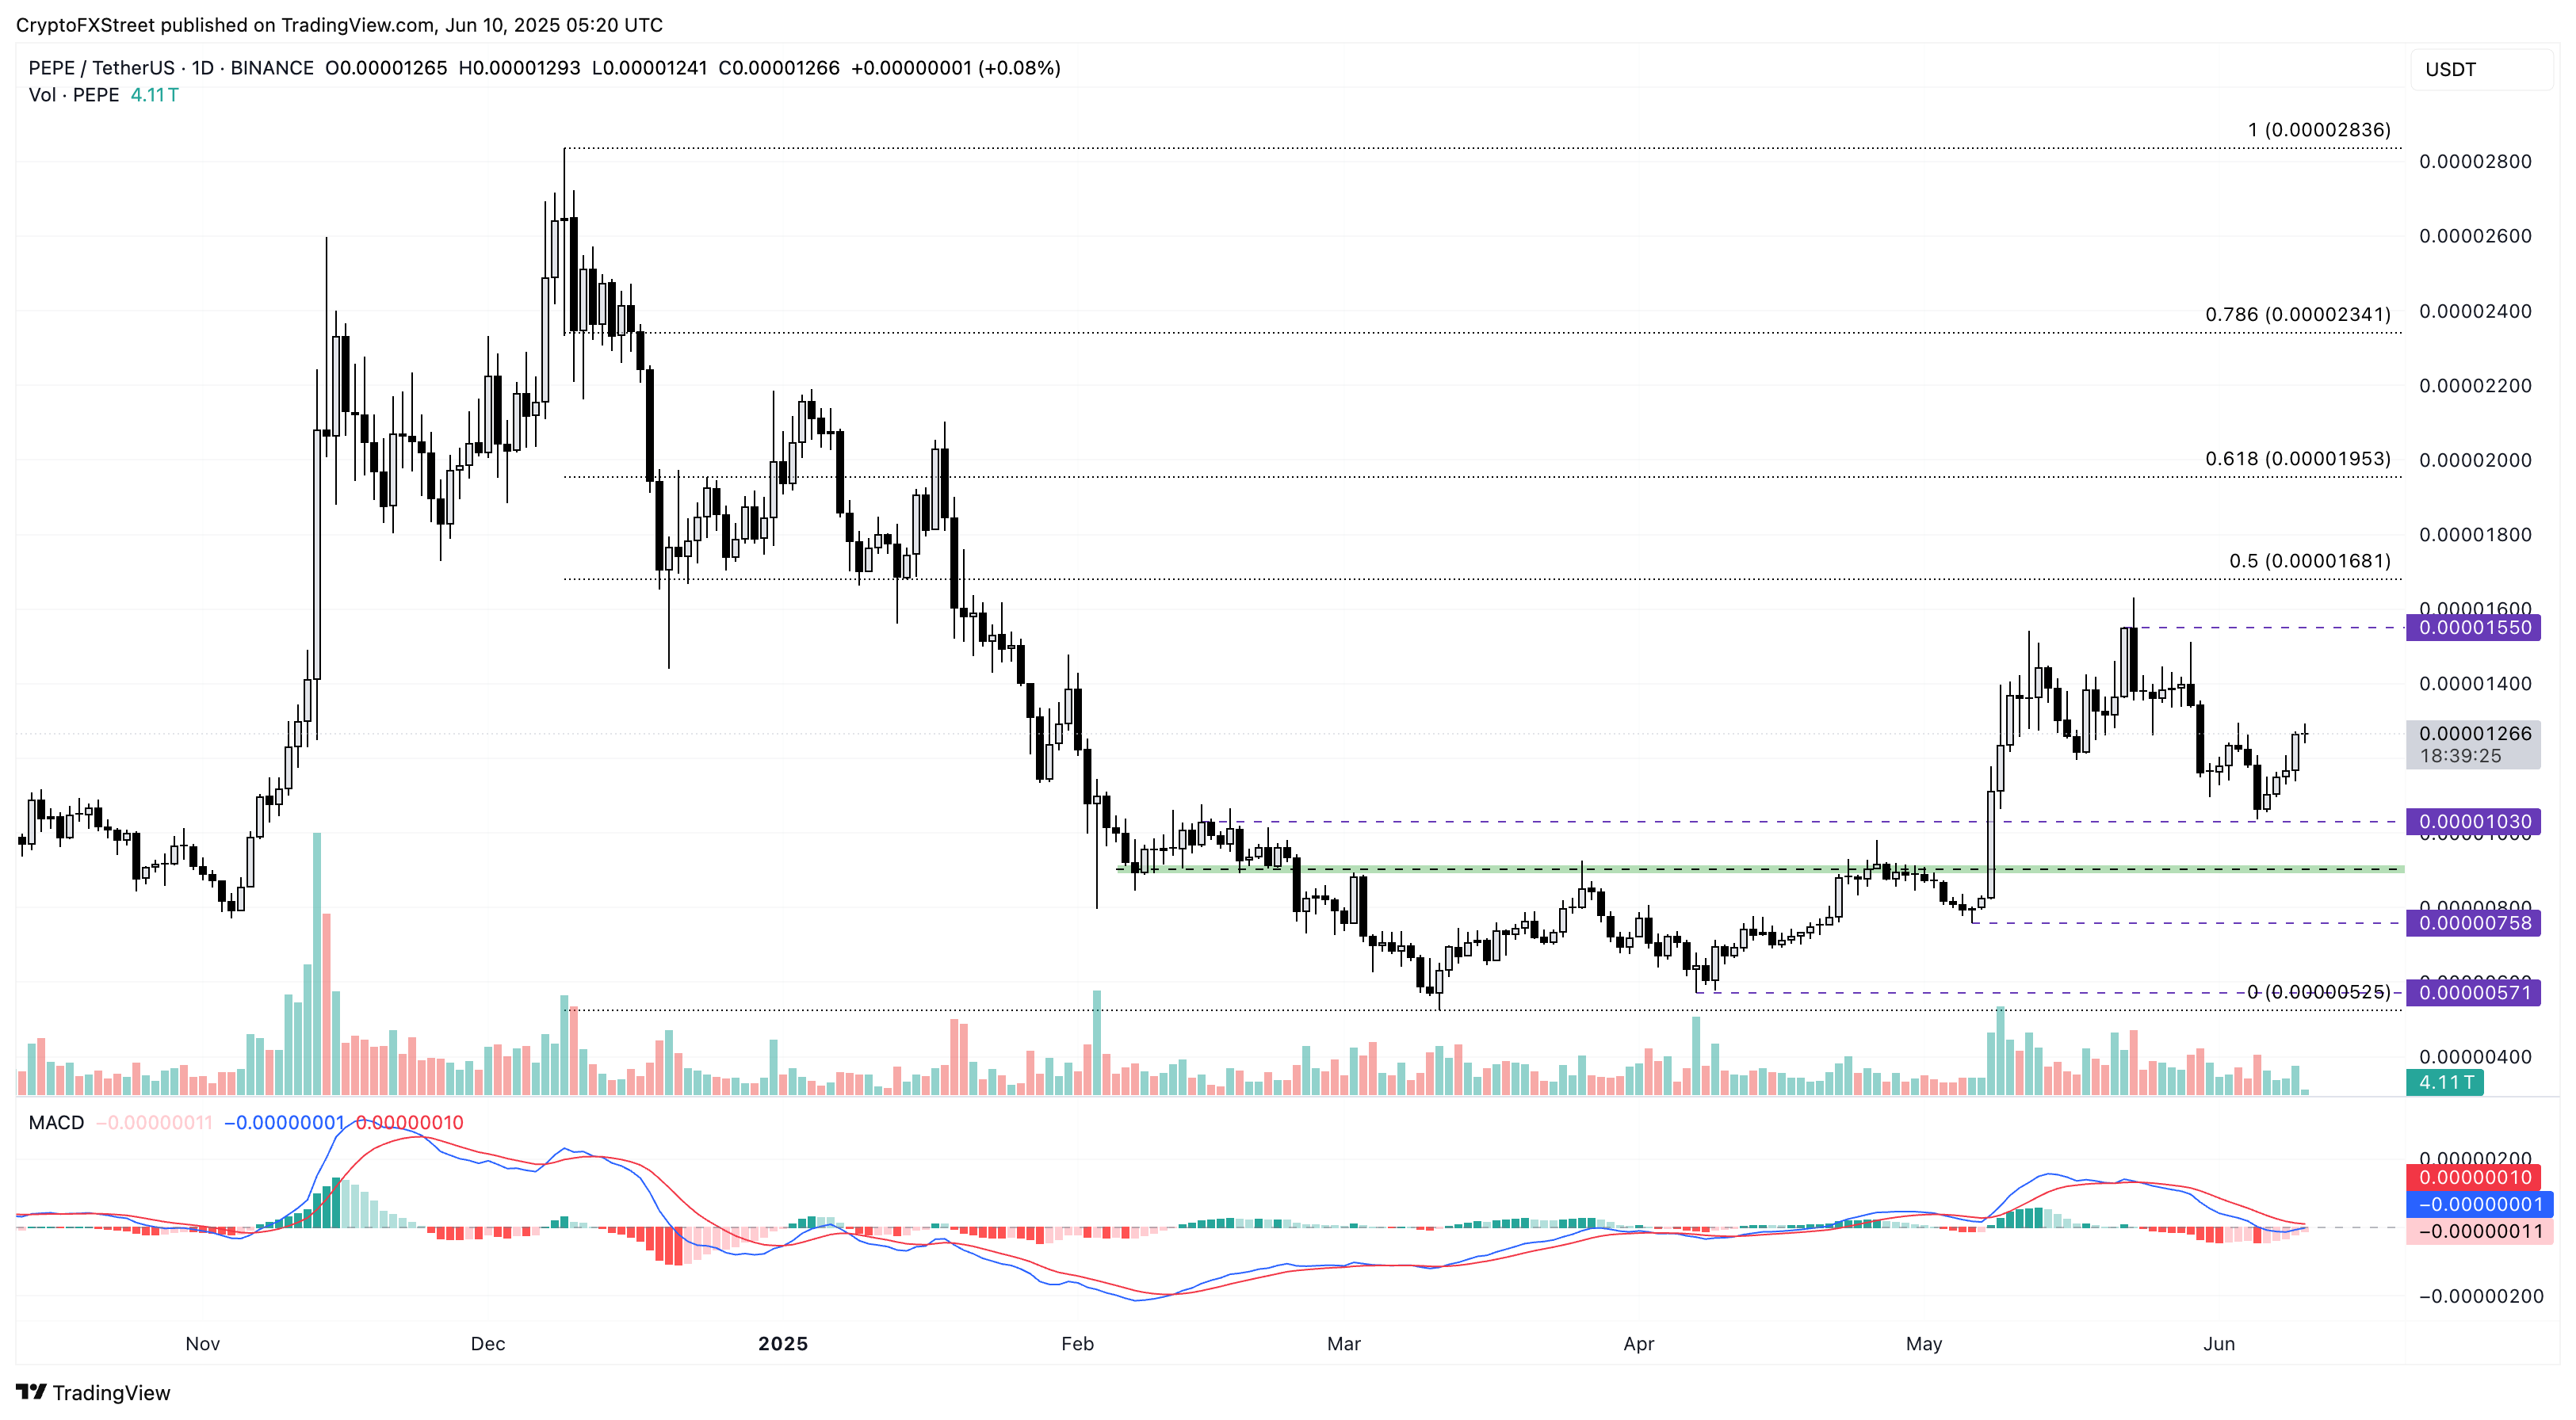
PEPE/USDT daily price chart. Source: Tradingview
Conversely, failing to maintain momentum above the $0.000010 psychological level will nullify the short-term bullish outlook. In such a case, a closing below the support level could extend the downfall to $0.00000758, last tested on May 6.
* The content presented above, whether from a third party or not, is considered as general advice only. This article should not be construed as containing investment advice, investment recommendations, an offer of or solicitation for any transactions in financial instruments.


