

Chiliz Price Forecast: Derivatives-backed uptrend targets further gains
- Chiliz price extends its gains on Tuesday after surging nearly 5% the previous day.
- Derivatives data backs the bullish sentiment, with open interest increasing, funding rates turning positive and long bets rising.
- The technical outlook suggests a continuation of the rally, targeting levels above $0.051.
Chiliz (CHZ) continues to trade in green above $0.049 on Tuesday, having rallied nearly 5% in the previous day. CHZ is outperforming the broader cryptocurrency market so far this week, as the token’s resilience appears to be driven by improving sentiment in the derivatives market. On the technical side, the outlook remains constructive, suggesting CHZ could extend its advance toward levels above $0.051.
Derivatives metrics support a bullish outlook for CHZ
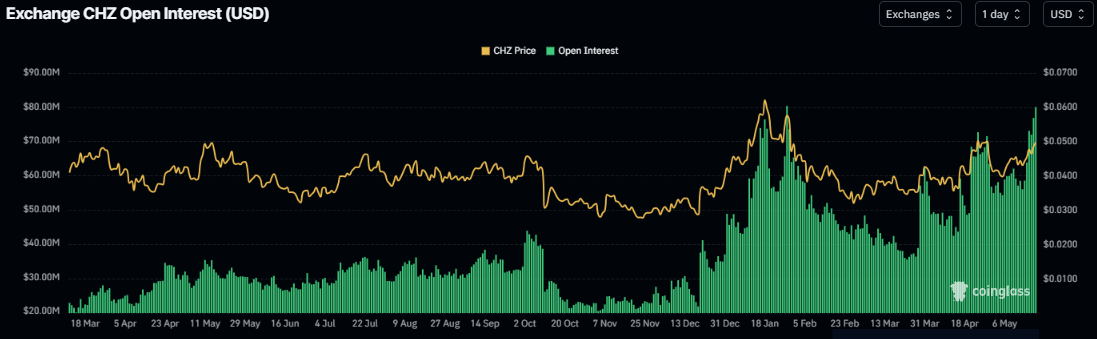
CoinGlass data shows that the futures’ Open Interest (OI) at exchanges in Chiliz surges to $79.96 million on Tuesday, up from $58 million in the previous week and nearing the yearly highs of $80 million back in January. An increasing OI indicates new or additional money entering the market and new buying, which could fuel a rally in the CHZ price.
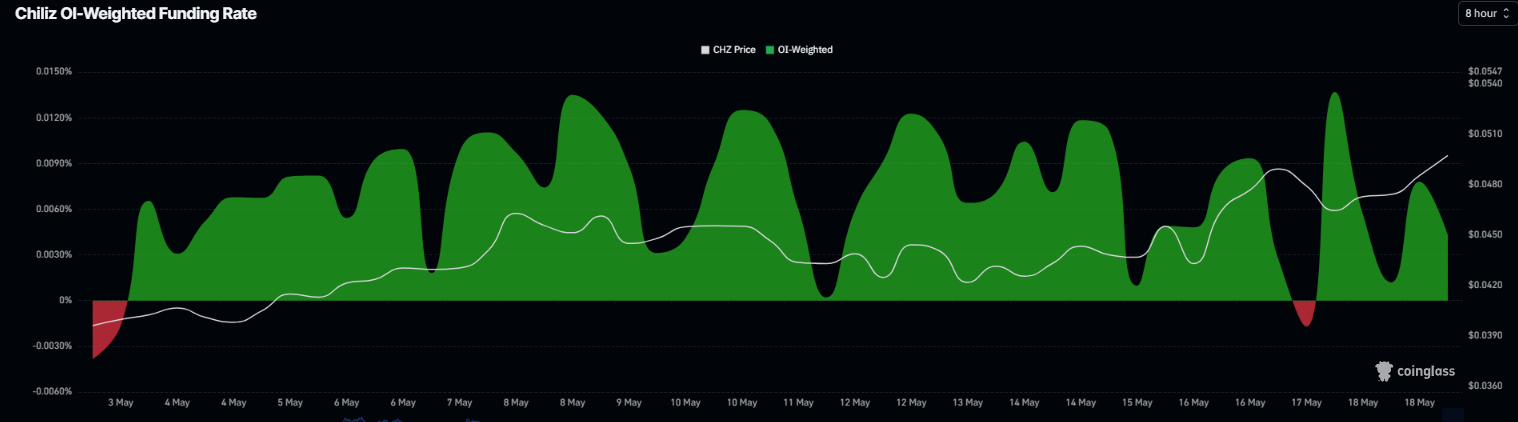
In addition, the funding rates also show a bullish bias. Chiliz’s funding rates flipped positive on Sunday and surge to 0.0043% on Tuesday, indicating that longs are paying shorts. Historically, as shown in the chart below, when the funding rates have flipped from negative to positive and risen, the CHZ price has rallied sharply.
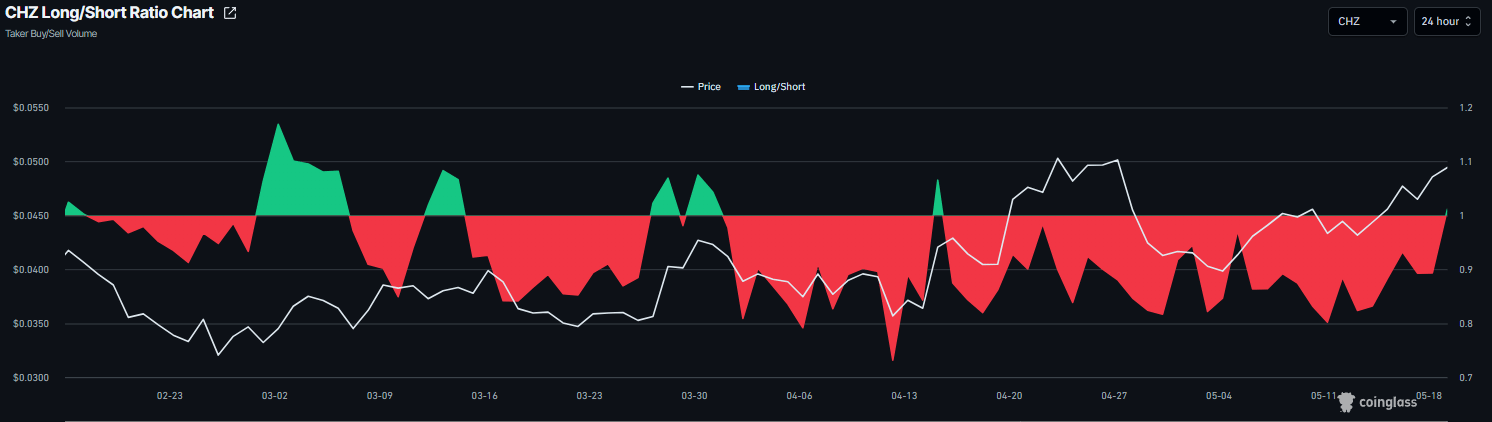
CoinGlass’ long-to-short ratio for CHZ read 1.01 on Tuesday, after sitting in the red territory for over a week. This ratio, being above one, reflects bullish sentiment in the market, as more traders are betting on the asset’s price to rise.
Chiliz Price Forecast: CHZ bulls aiming for levels above the $0.051 mark
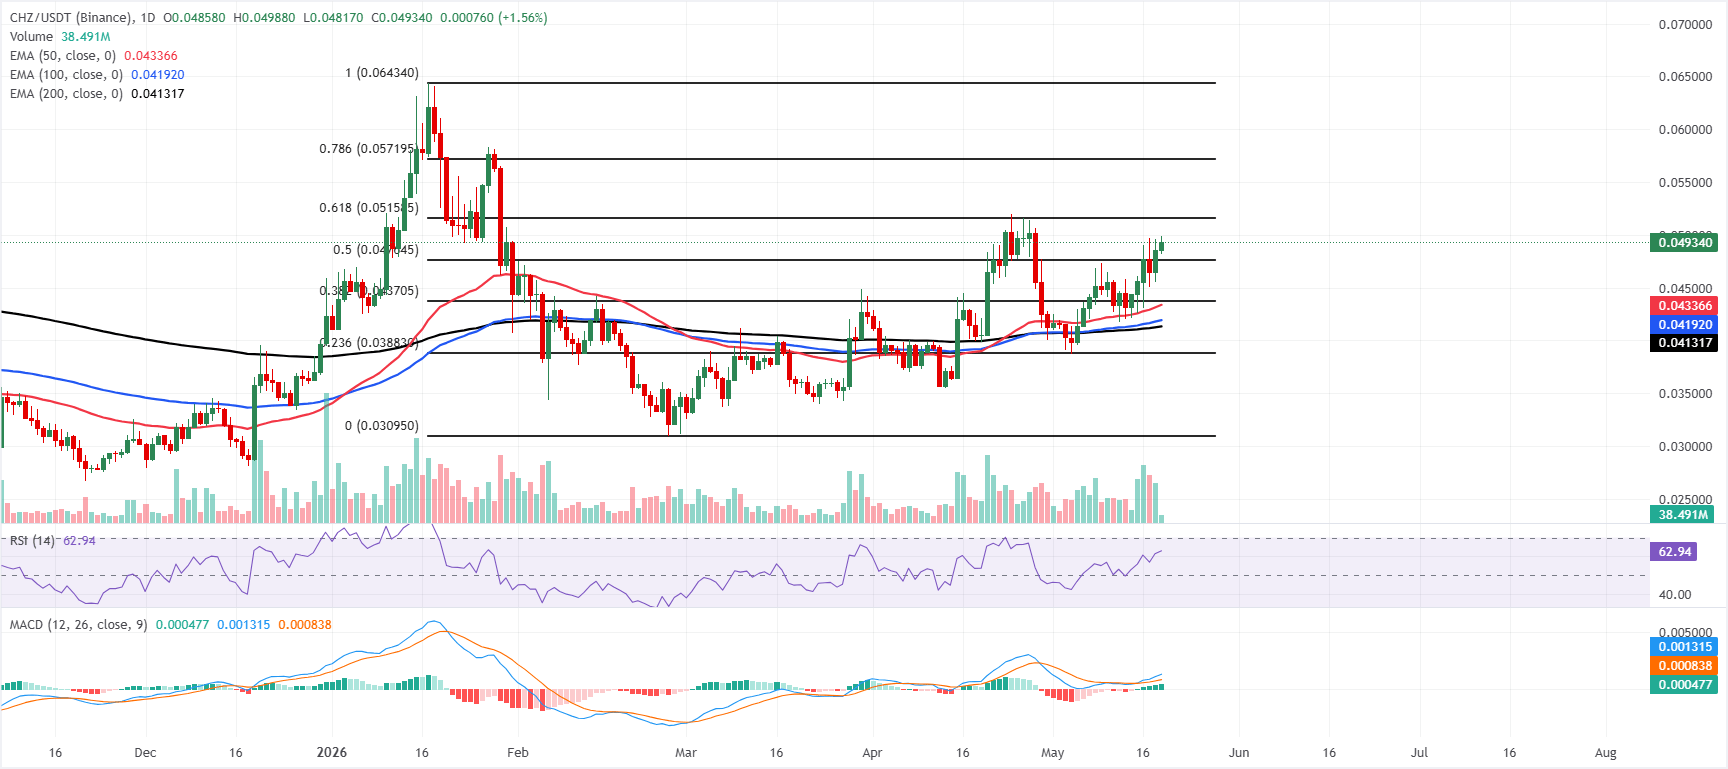
Chiliz trades at $0.049 on Tuesday, maintaining a constructive bullish bias as it holds well above the 50-day, 100-day, and 200-day Exponential Moving Averages (EMAs), which are clustered between roughly $0.041 and $0.043.
CHZ has reclaimed the 50% retracement at $0.047 as support, while the Relative Strength Index (RSI) at 62 leans toward bullish momentum without yet signaling overbought conditions. The Moving Average Convergence Divergence (MACD) line has turned positive, with the histogram marginally above zero, hinting at steady, rather than explosive, upside pressure.
On the topside, initial resistance is seen at the 61.8% Fibonacci retracement at $0.051, followed by a higher barrier at the 78.6% retracement at $0.057 and then the January high at $0.064.
On the downside, immediate support is located at the reclaimed 50% retracement at $0.047, ahead of a broader demand cluster around the 38.2% Fibonacci retracement level at $0.043 and the 50-day EMA at $0.043, with the 100-day and 200-day EMAs at $0.041, reinforcing the medium-term floor if a deeper pullback unfolds.
(The technical analysis of this story was written with the help of an AI tool.)
Recommended Articles


