

NZD/USD Price Forecast: Kiwi eases to 0.5850 in cautious markets
- NZD/USD eases to the 0.5850 area from Monday's highs at 0.5880.
- Investors remain cautious amid the uncertain situation in the Middle East.
- High Oil prices put additional pressure on the Kiwi.
The New Zealand Dollar (NZD) is pulling back against the US Dollar (USD) on Tuesday, trading right above 0.5850 at the time of writing, down from Monday’s highs at 0.5880. A cautious market mood, amid the back-and-forth in the US-Iran war, and high Oil prices are keeping the risk-sensitive Kiwi on the defensive.
US President Donald Trump said on Monday that he called off an attack on Iran as the latest peace proposal offers a “very good chance” of reaching a nuclear deal. Markets have taken this news with cautious enthusiasm, as concerns of a long-lasting inflationary impact from the energy shock grow.
The Brent Crude Oil barrel trades above $107.00, and the US benchmark WTI at $103.00. These figures put significant pressure on New Zealand’s businesses and consumers, weighing heavily on economic growth.
Technical Analysis: A bullish correction within the bearish trend
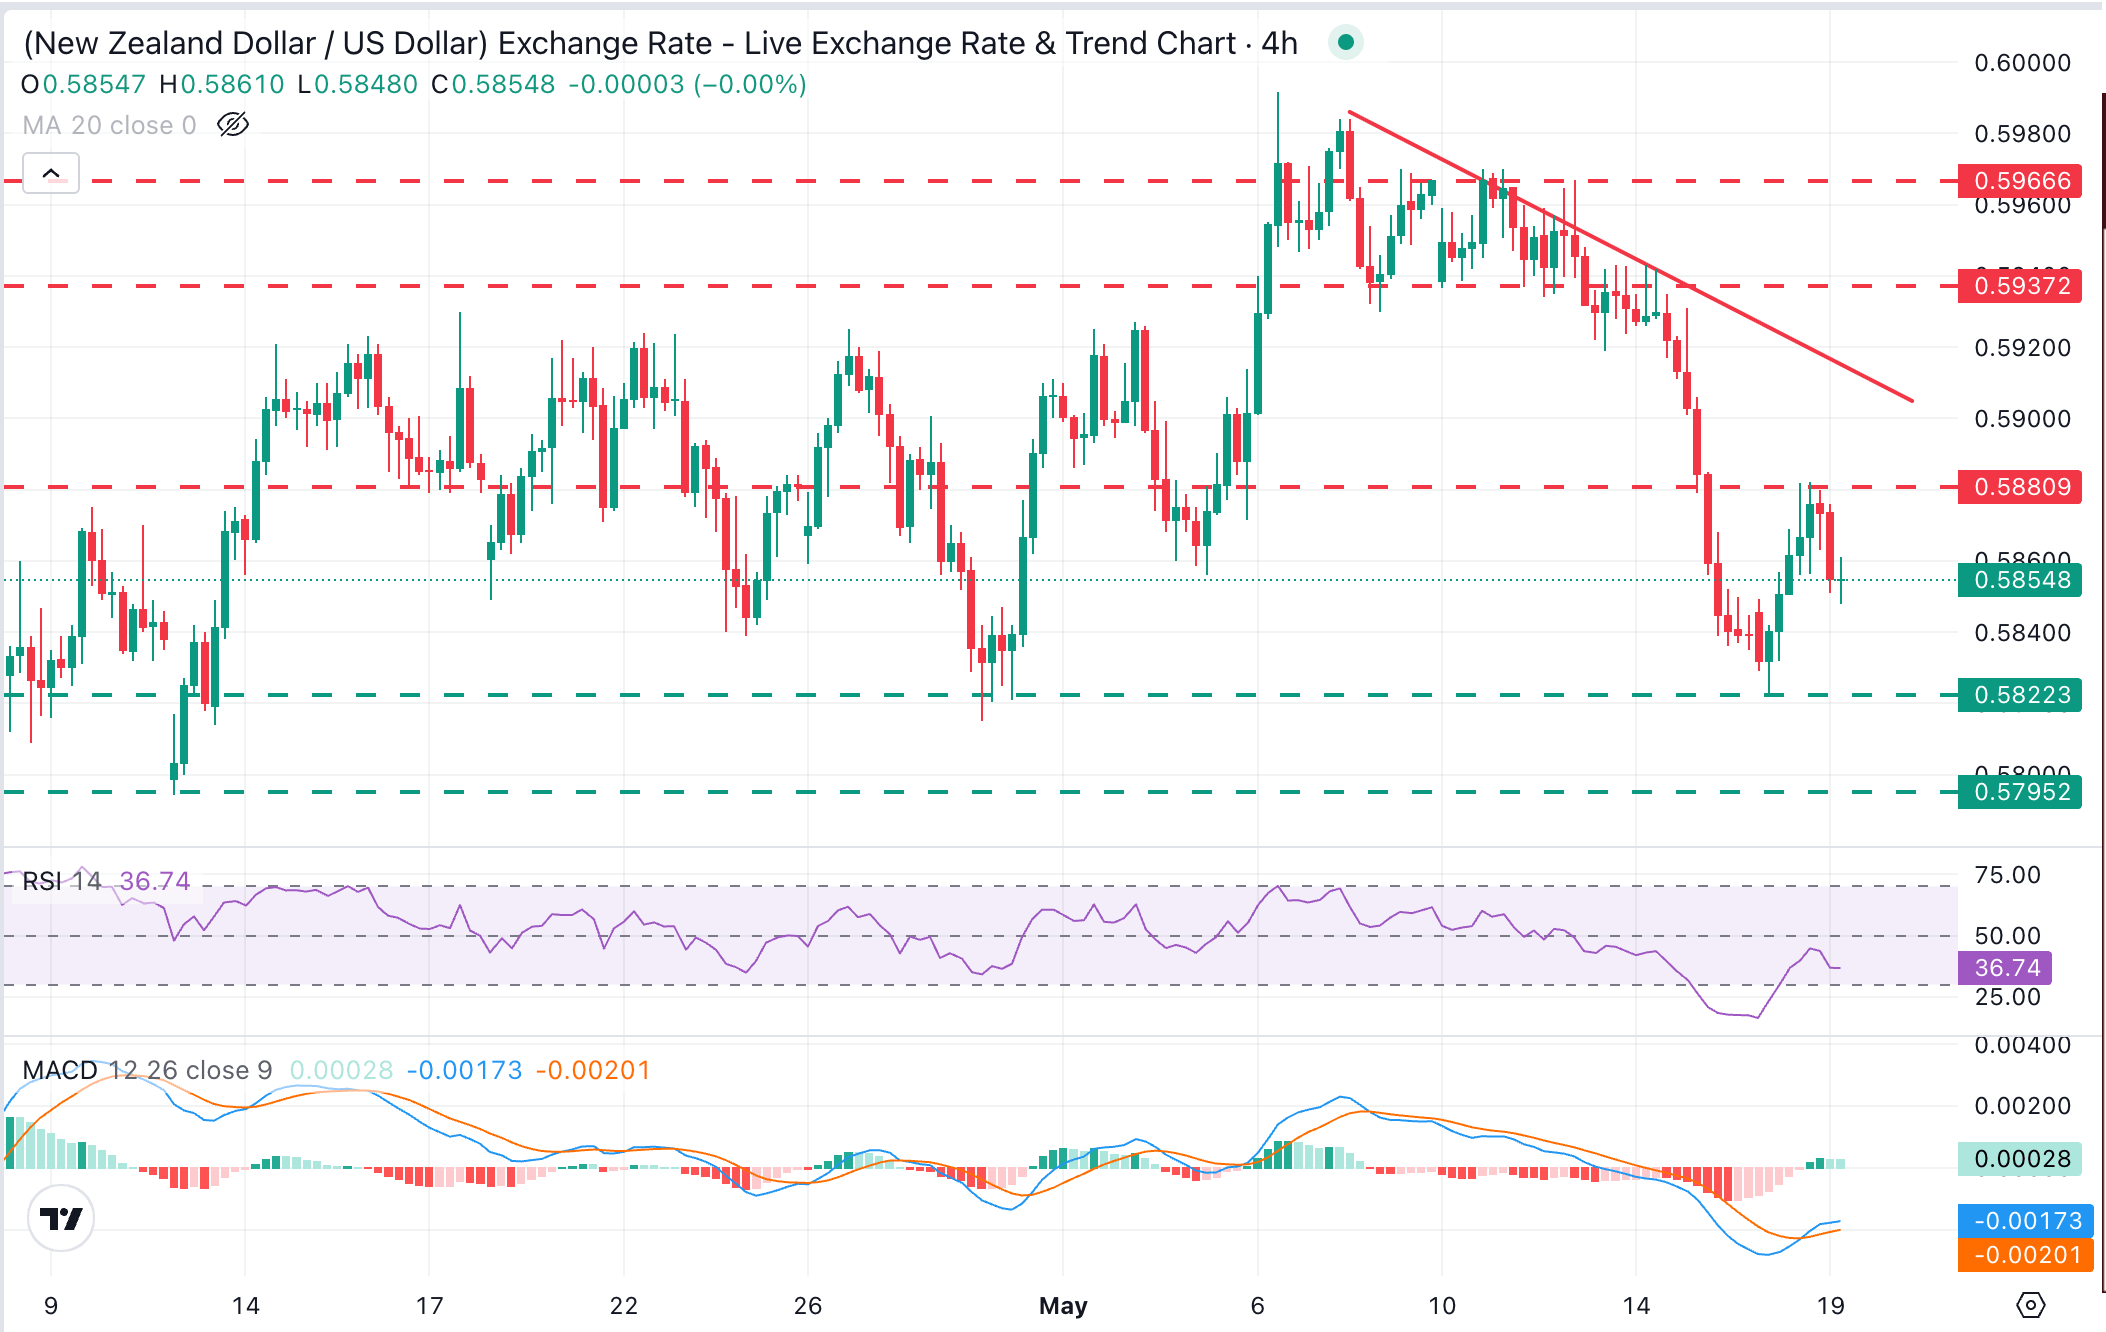
NZD/USD maintains a bearish near-term tone intact despite Monday's rebound from lows near 0.5820. The 4-hour Relative Strength Index (RSI), at 36, signals subdued momentum after recovering from oversold territory, and the Moving Average Convergence Divergence (MACD) has turned marginally positive but remains shallow, hinting that any rebounds are likely corrective.
Bulls have been capped at the 0.5880 area, which keeps price action well below the descending trendline from early May highs, now around 0.5915. Further up, a previous support-turned-resistance, around 0.5935, emerges as the next target.
On the downside, 0.5850 is acting as support on Tuesday, closing the path towards the April 29, May 18 low, near 0.5820, and the April 12 low near 0.5795.
(The technical analysis of this story was written with the help of an AI tool.)
New Zealand Dollar Price Today
The table below shows the percentage change of New Zealand Dollar (NZD) against listed major currencies today. New Zealand Dollar was the strongest against the Australian Dollar.
| USD | EUR | GBP | JPY | CAD | AUD | NZD | CHF | |
|---|---|---|---|---|---|---|---|---|
| USD | 0.22% | 0.28% | 0.16% | 0.04% | 0.50% | 0.31% | 0.19% | |
| EUR | -0.22% | 0.07% | -0.04% | -0.17% | 0.29% | 0.11% | -0.03% | |
| GBP | -0.28% | -0.07% | -0.09% | -0.24% | 0.20% | 0.03% | -0.09% | |
| JPY | -0.16% | 0.04% | 0.09% | -0.13% | 0.32% | 0.16% | 0.01% | |
| CAD | -0.04% | 0.17% | 0.24% | 0.13% | 0.45% | 0.28% | 0.14% | |
| AUD | -0.50% | -0.29% | -0.20% | -0.32% | -0.45% | -0.16% | -0.31% | |
| NZD | -0.31% | -0.11% | -0.03% | -0.16% | -0.28% | 0.16% | -0.14% | |
| CHF | -0.19% | 0.03% | 0.09% | -0.01% | -0.14% | 0.31% | 0.14% |
The heat map shows percentage changes of major currencies against each other. The base currency is picked from the left column, while the quote currency is picked from the top row. For example, if you pick the New Zealand Dollar from the left column and move along the horizontal line to the US Dollar, the percentage change displayed in the box will represent NZD (base)/USD (quote).
Recommended Articles


