
Ripple Price Forecast: XRP targets bullish close on Tuesday as retail investors recover risk appetite
- XRP bulls move to pare losses following an intraday sweep to $2.40.
- Retail interest increases with the XRP futures Open Interest averaging $3.8 billion.
- The MACD indicator hints at a buy signal on the daily chart.
Ripple (XRP) rises alongside crypto majors such as Bitcoin (BTC) and Ethereum (ETH), trading above $2.50 on Tuesday. The recovery comes after XRP extended its down leg to $2.40 earlier in the day, reflecting intense volatility across the cryptocurrency market.
Traders will be watching out for a daily close above $2.50 to ascertain XRP’s recovery potential. Key short-term milestones include a sustained breakout above the resistance range between $2.61 and $2.70.
Retail demand stabilizes as XRP rebounds
The XRP derivatives market is stabilizing, as evidenced by the futures Open Interest (OI) recovering to $3.8 billion from approximately $3.5 billion on Sunday. Although minor, the uptick reflects a potential shift in sentiment from bearish to bullish.
The XRP OI peaked at $10.94 billion days after the price reached a historical high of $3.66 on July 18, underscoring the impact of steady retail demand. Therefore, there is a need for a steady uptrend in OI to bolster bullish momentum this week.
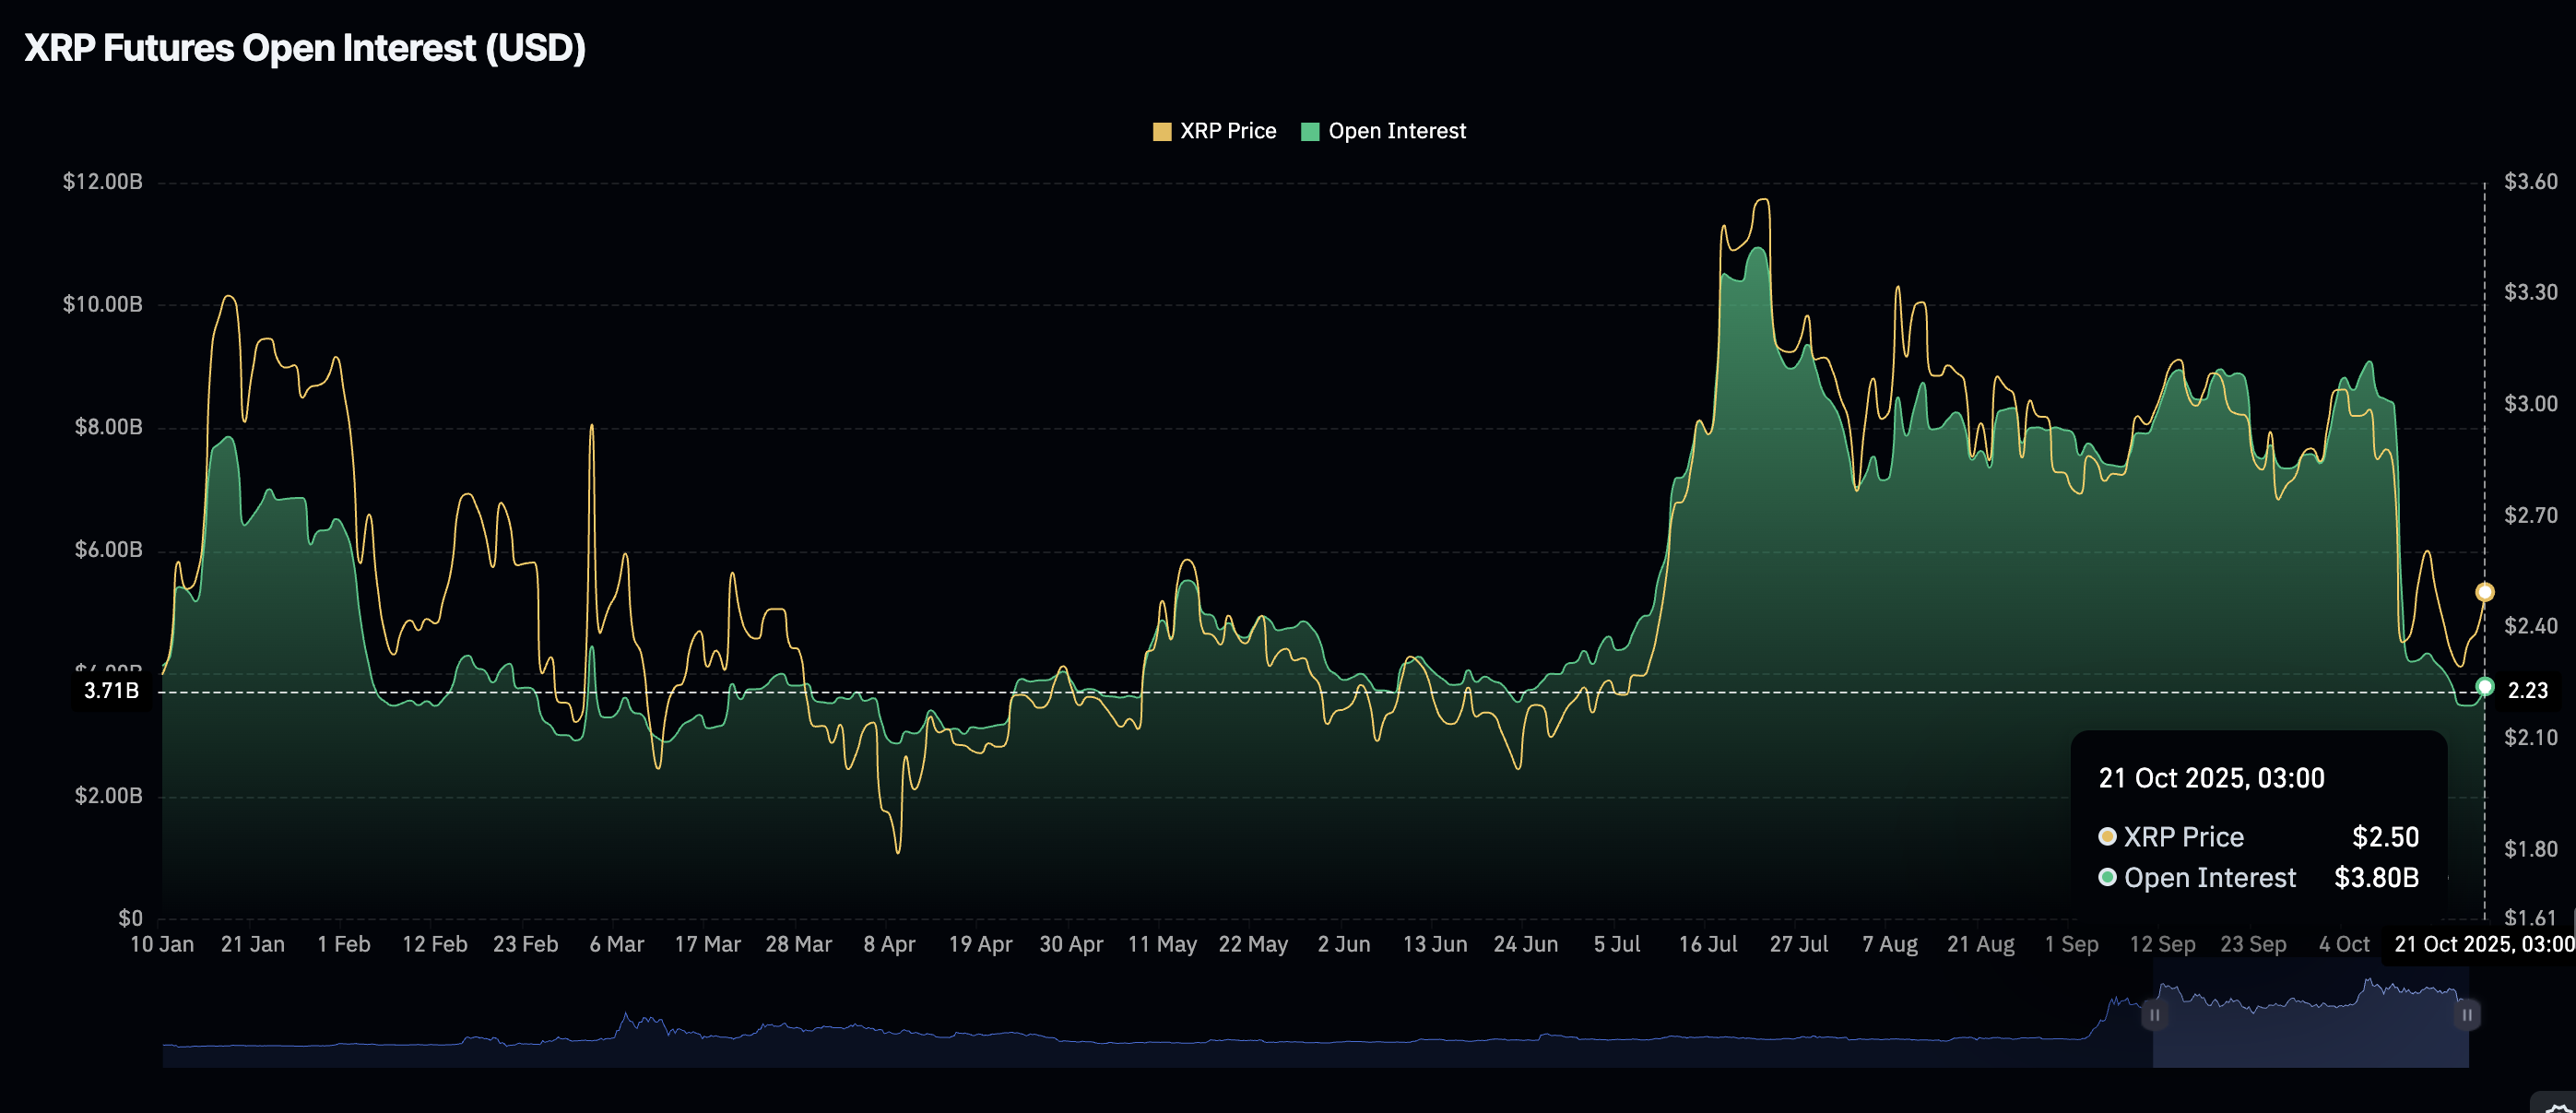
XRP Futures Open Interest | Source: CoinGlass
A sharp drawdown in the OI weighted funding rate to 0.0038% from 0.0068% on Monday suggests that traders are increasingly piling into short positions, citing negative sentiment surrounding XRP.
Still, the situation is not at extreme levels, considering the OI weighted funding rate remains positive on Tuesday. The next sessions could provide insight into the direction retail interest may take. A reversal would imply that sentiment is positively shifting to support a sustainable recovery in the price of XRP.
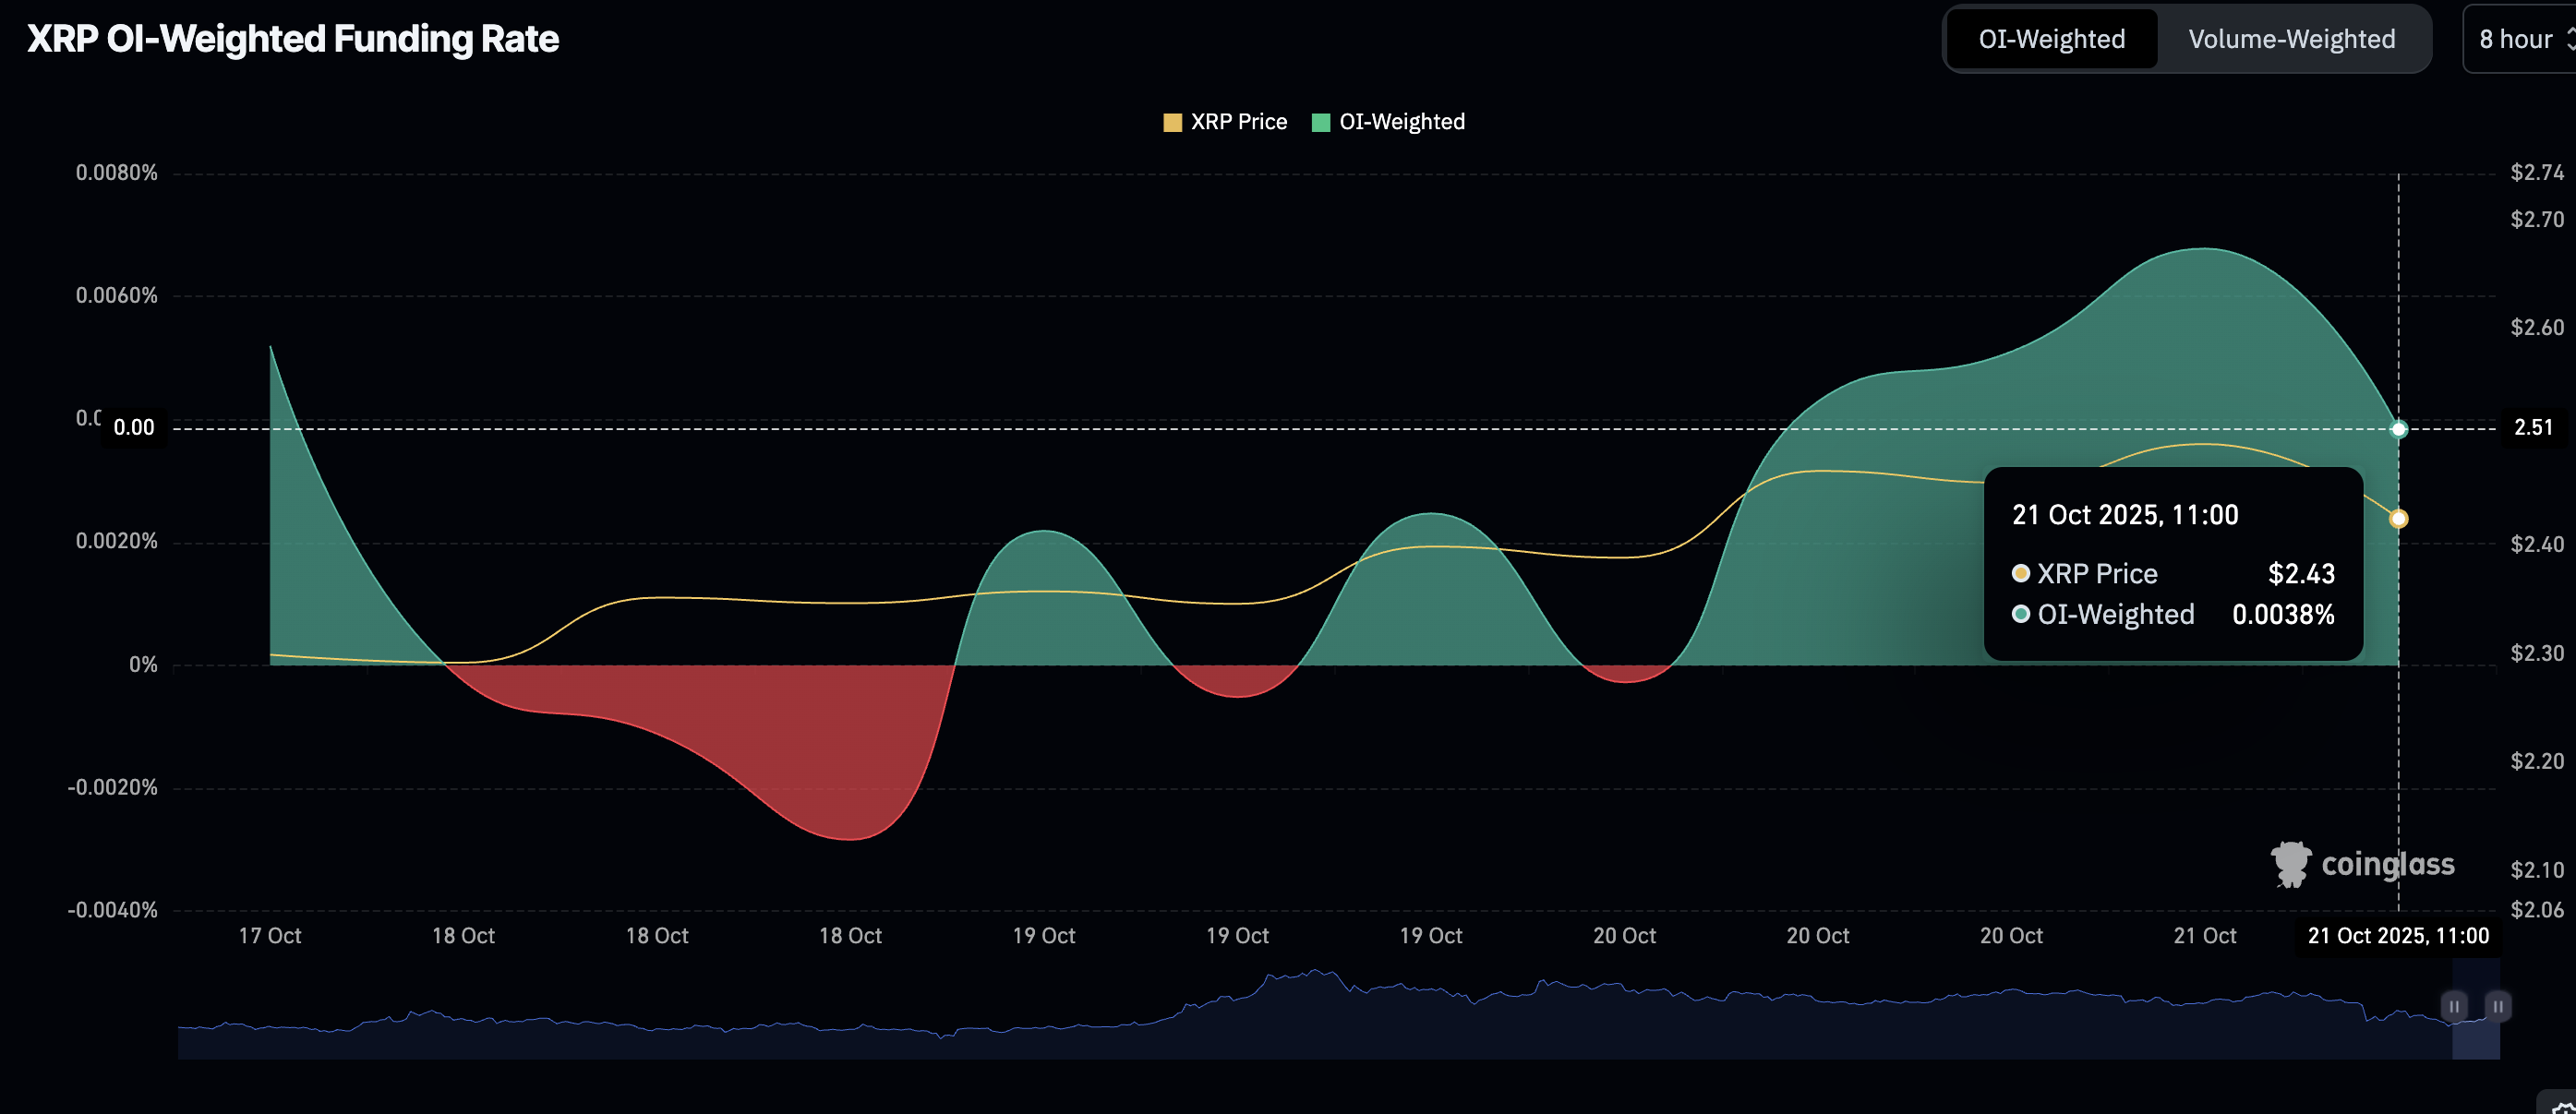
XRP OI weighted funding rate | Source: CoinGlass
Technical outlook: XRP bulls regain control
XRP is trading above the pivotal $2.50 level, supported by a sudden turnaround in risk appetite on Tuesday. From the daily chart, this optic marks the fourth consecutive day of recovery following Friday’s sell-off to $2.18.
Should the Moving Average Convergence Divergence (MACD) indicator on the daily chart confirm a buy signal, with the blue MACD line crossing above the red signal line, interest in XRP will surge, increasing the odds of a prolonged uptrend.
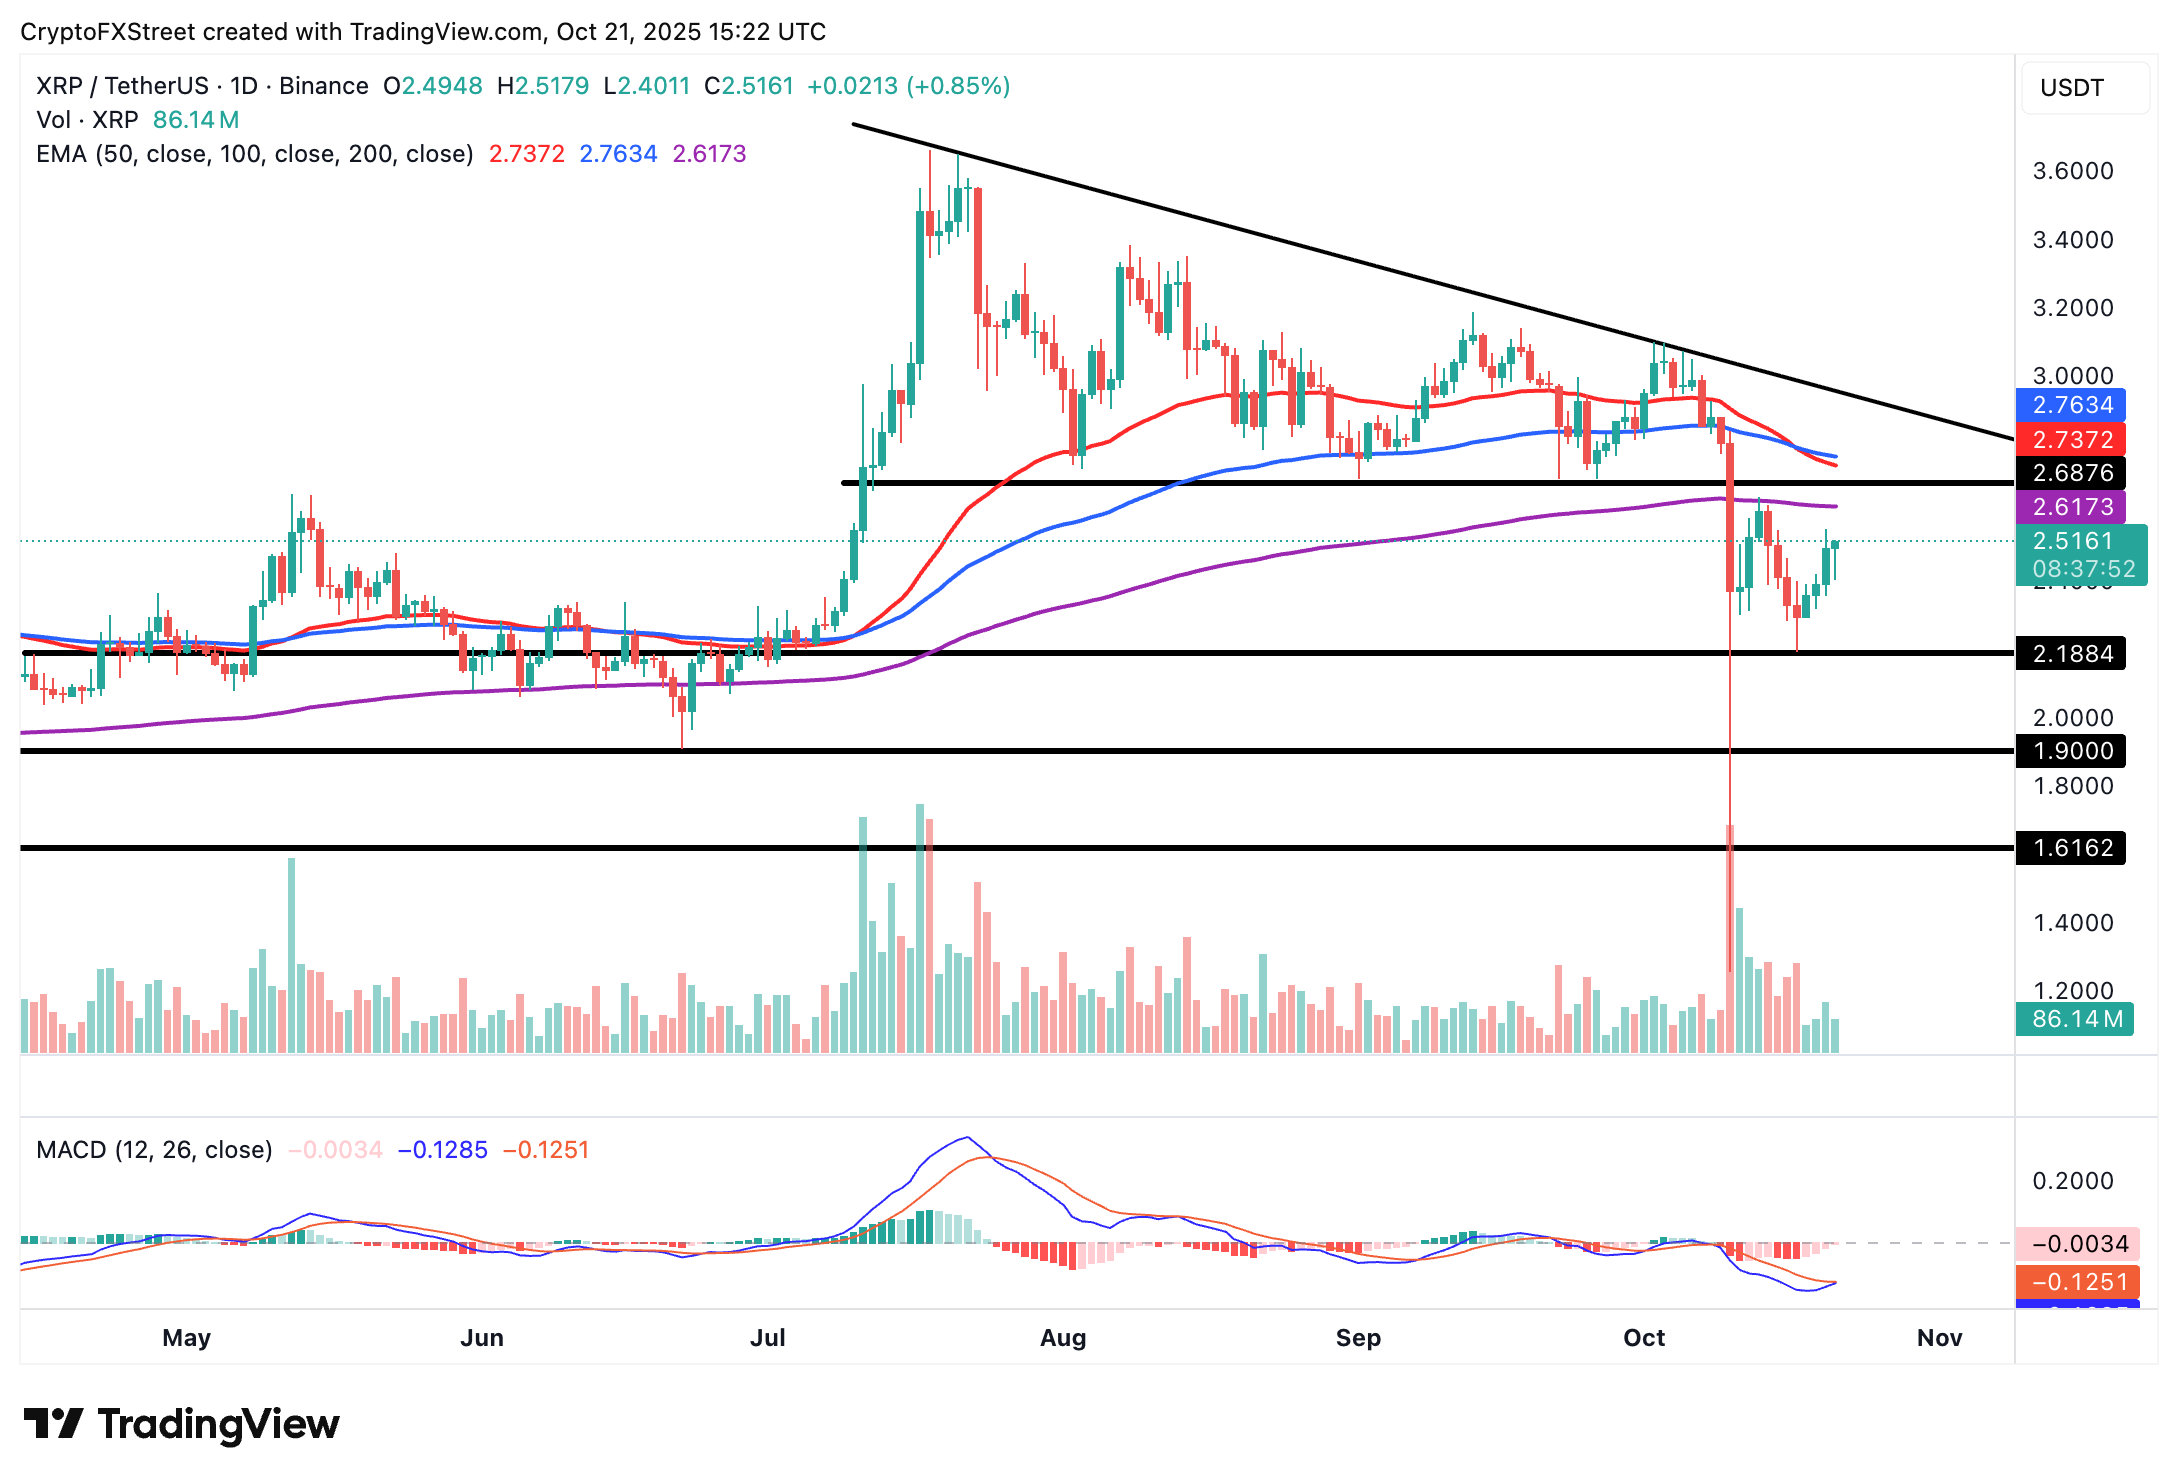
XRP/USDT daily chart
The 200-day Exponential Moving Average (EMA) at $2.61 represents the first key resistance likely to encourage early profit booking. Therefore, sustaining an uptrend above this level and the subsequent seller congestion at $2.70 would reinforce the bullish outlook.
Open Interest, funding rate FAQs
Higher Open Interest is associated with higher liquidity and new capital inflow to the market. This is considered the equivalent of increase in efficiency and the ongoing trend continues. When Open Interest decreases, it is considered a sign of liquidation in the market, investors are leaving and the overall demand for an asset is on a decline, fueling a bearish sentiment among investors.
Funding fees bridge the difference between spot prices and prices of futures contracts of an asset by increasing liquidation risks faced by traders. A consistently high and positive funding rate implies there is a bullish sentiment among market participants and there is an expectation of a price hike. A consistently negative funding rate for an asset implies a bearish sentiment, indicating that traders expect the cryptocurrency’s price to fall and a bearish trend reversal is likely to occur.
Recommended Articles


