

Can You Still Time Bitcoin? AI Bots Spot Entry Points
Bitcoin’s path is not linear. It moves up, corrects, and moves again, often within the same cycle. That idea gained attention after Geoff Kendrick, Global Head of Digital Asset Research at Standard Chartered, said in a BeInCrypto Expert Council discussion that dips below $60,000 look attractive.
However, he warned that Bitcoin could still fall toward $50,000 before recovering. That kind of range makes timing difficult. AI trading bots are now being used to track these swings.
Instead of guessing bottoms, they focus on when real accumulation occurs. BeInCrypto has developed a similar bot, Accumulation Cycle, using Pine Script, which we break down in this analysis.
Note: This AI trading bot highlights potential entry and exit zones based on market data. It does not guarantee profits or predict outcomes. This is not financial advice.
How AI Trading Bots Identify Real Buying Zones
Kendrick’s view clearly highlights the problem. Bitcoin can drop, recover, and drop again within the same cycle. That is exactly what the model is built for.

BeInCrypto’s Accumulation Cycle system does not predict the bottom. It waits for confirmation that strength has returned.
It uses a very specific mix of structure and momentum (proprietary logic):
- EMA (Exponential Moving Average): shows trend direction
- RSI (Relative Strength Index): tracks buying strength
In simple terms, three things must align. BTC price must reclaim a key level with a daily close. Momentum must start rising.
And the price must stabilize instead of breaking lower. Only then does an accumulation signal (A) appear.
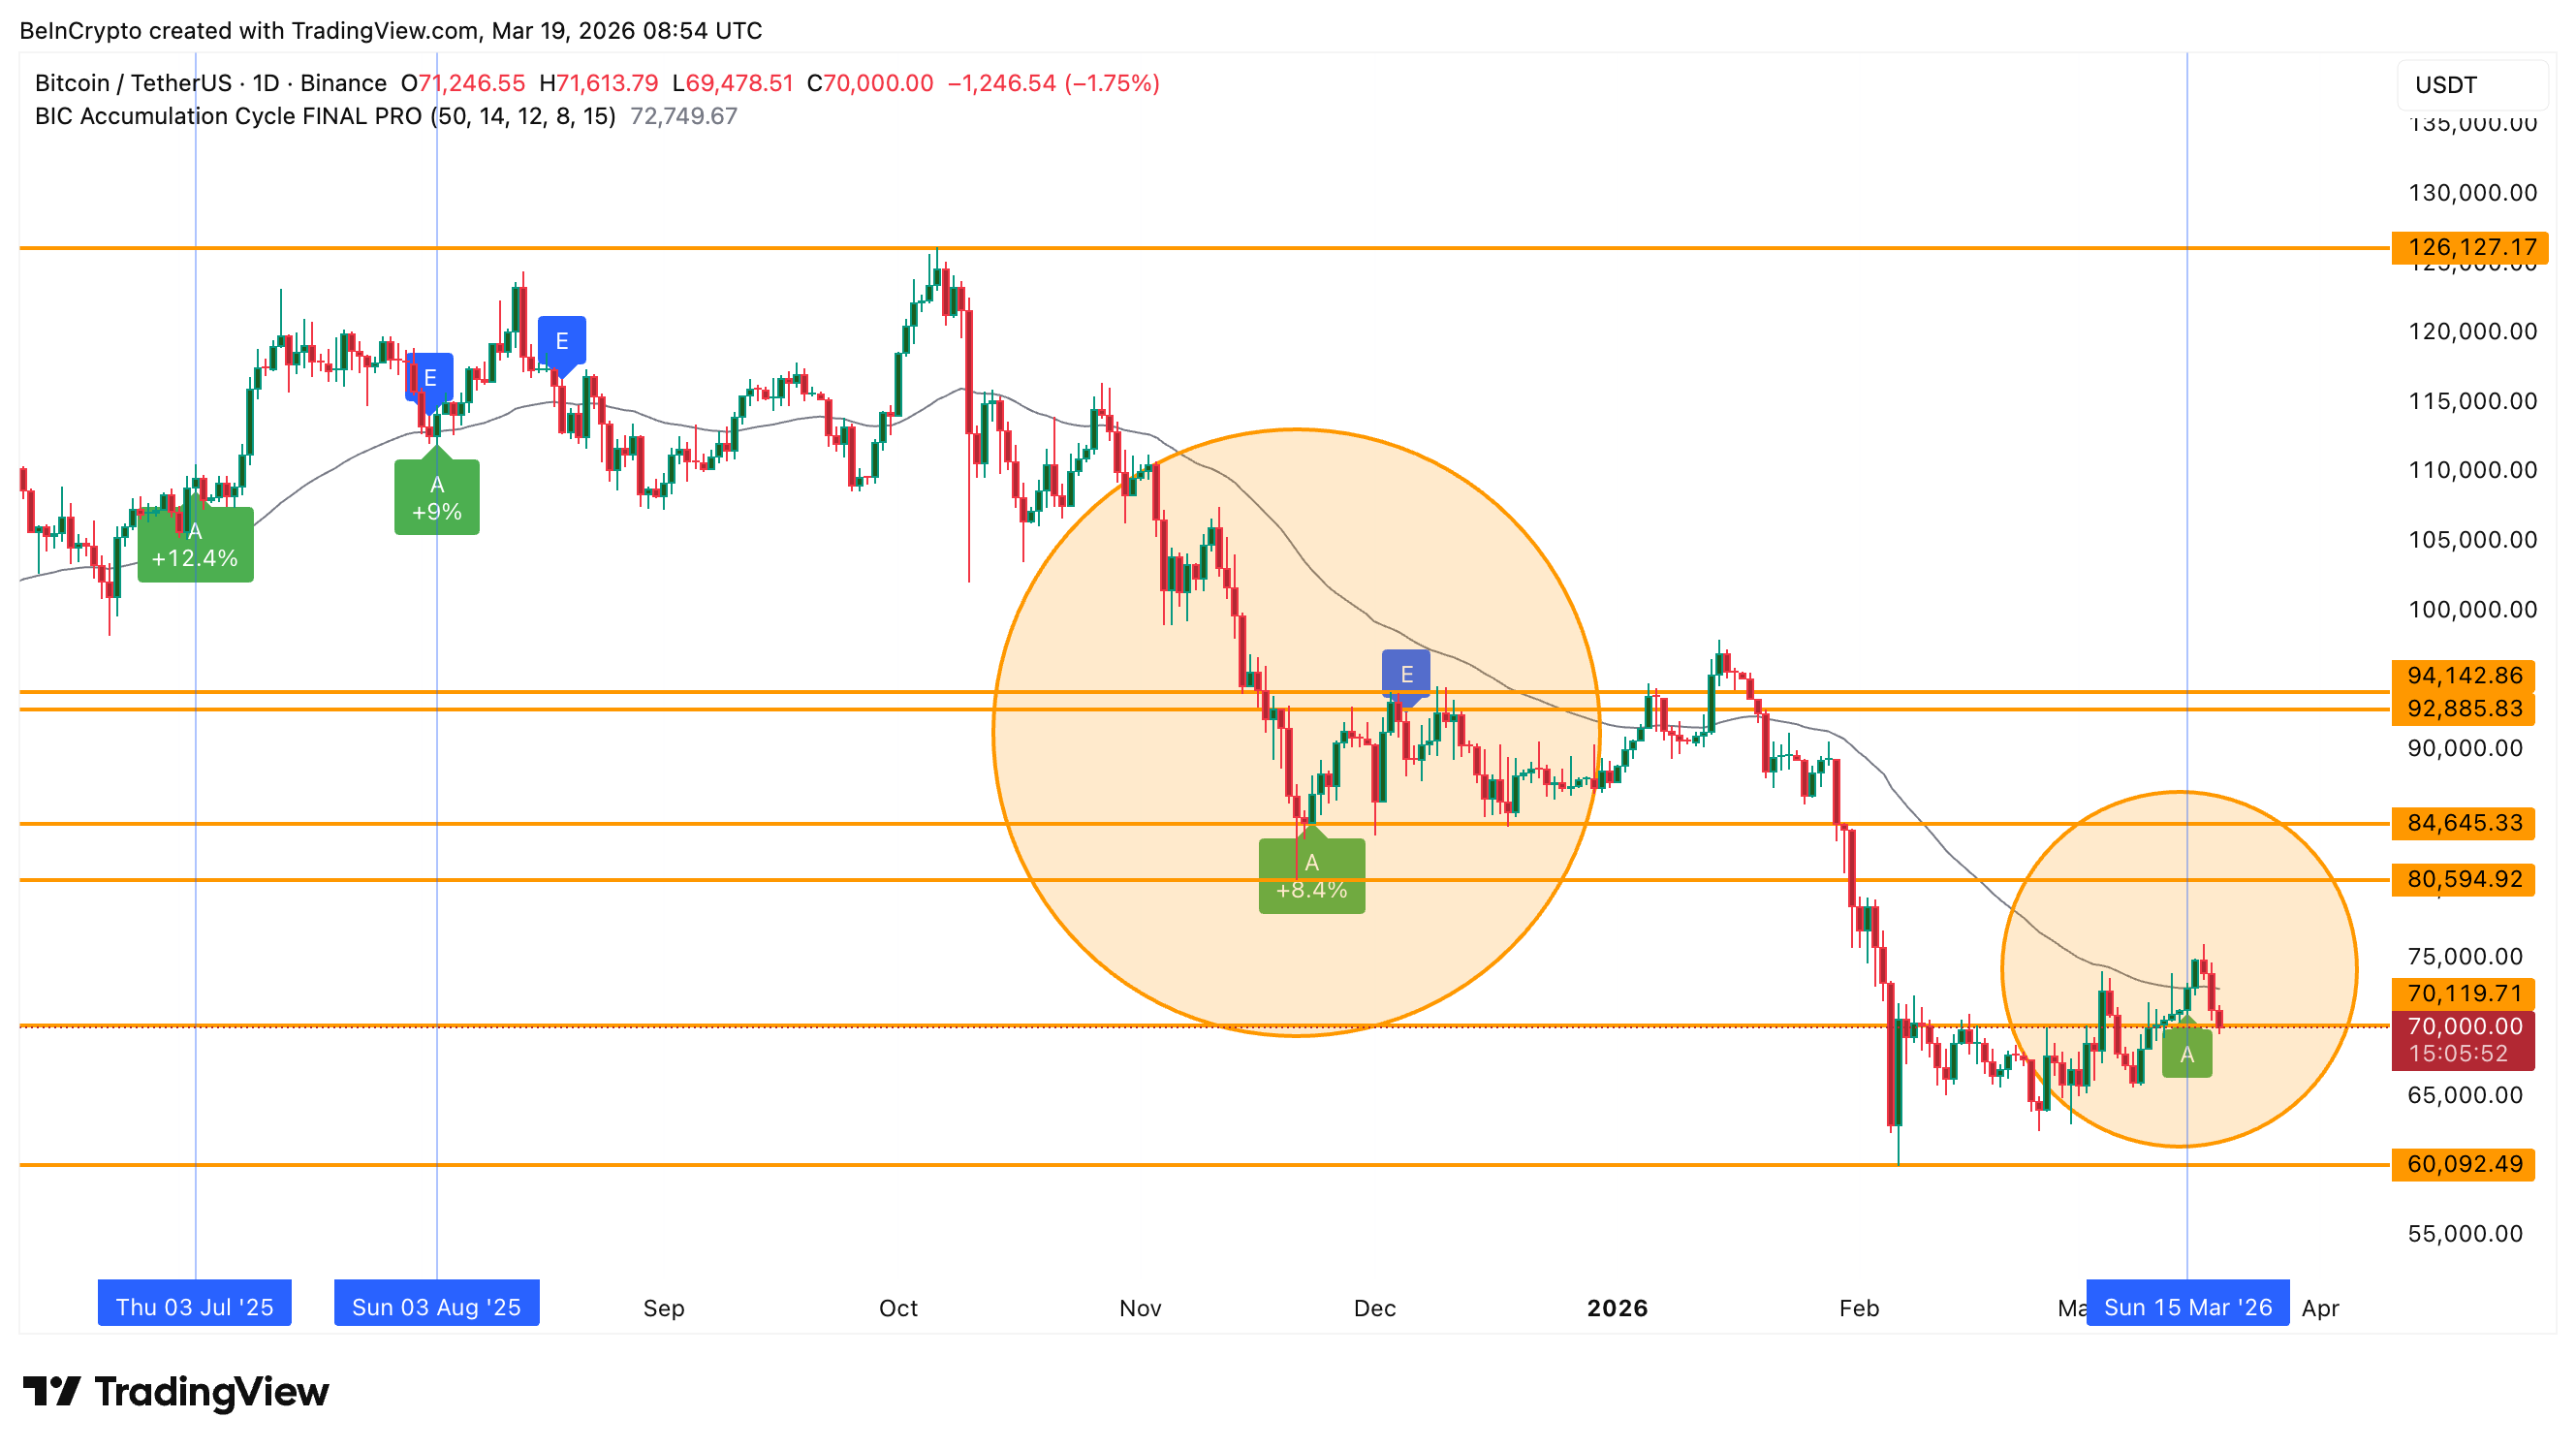
That is why Bitcoin’s February 2026 low near $60,000 did not trigger a signal. The market was still weak.
The signal only appeared after the price reclaimed $70,000 in mid-March 2026. That was the first sign of strength. The same logic applied in November, 2025.
 Bitcoin Price Alerts: TradingView
Bitcoin bottomed near $80,500, but the model stayed inactive. The signal only appeared after the $84,600 level was reclaimed with a daily close.
From there, the price moved toward $92,800, where the model marked the end of that cycle (E), capturing around an 8% move. It did not capture the exact top near $94,100. Across cycles, most signals fall in the 8% to 12% range, where moves are more stable.
The latest accumulation, which began in mid-March after reclaiming $70,000, remains active. It has no percentage yet because the ending signal has not appeared.
What This AI Trading Bot Has Already Captured
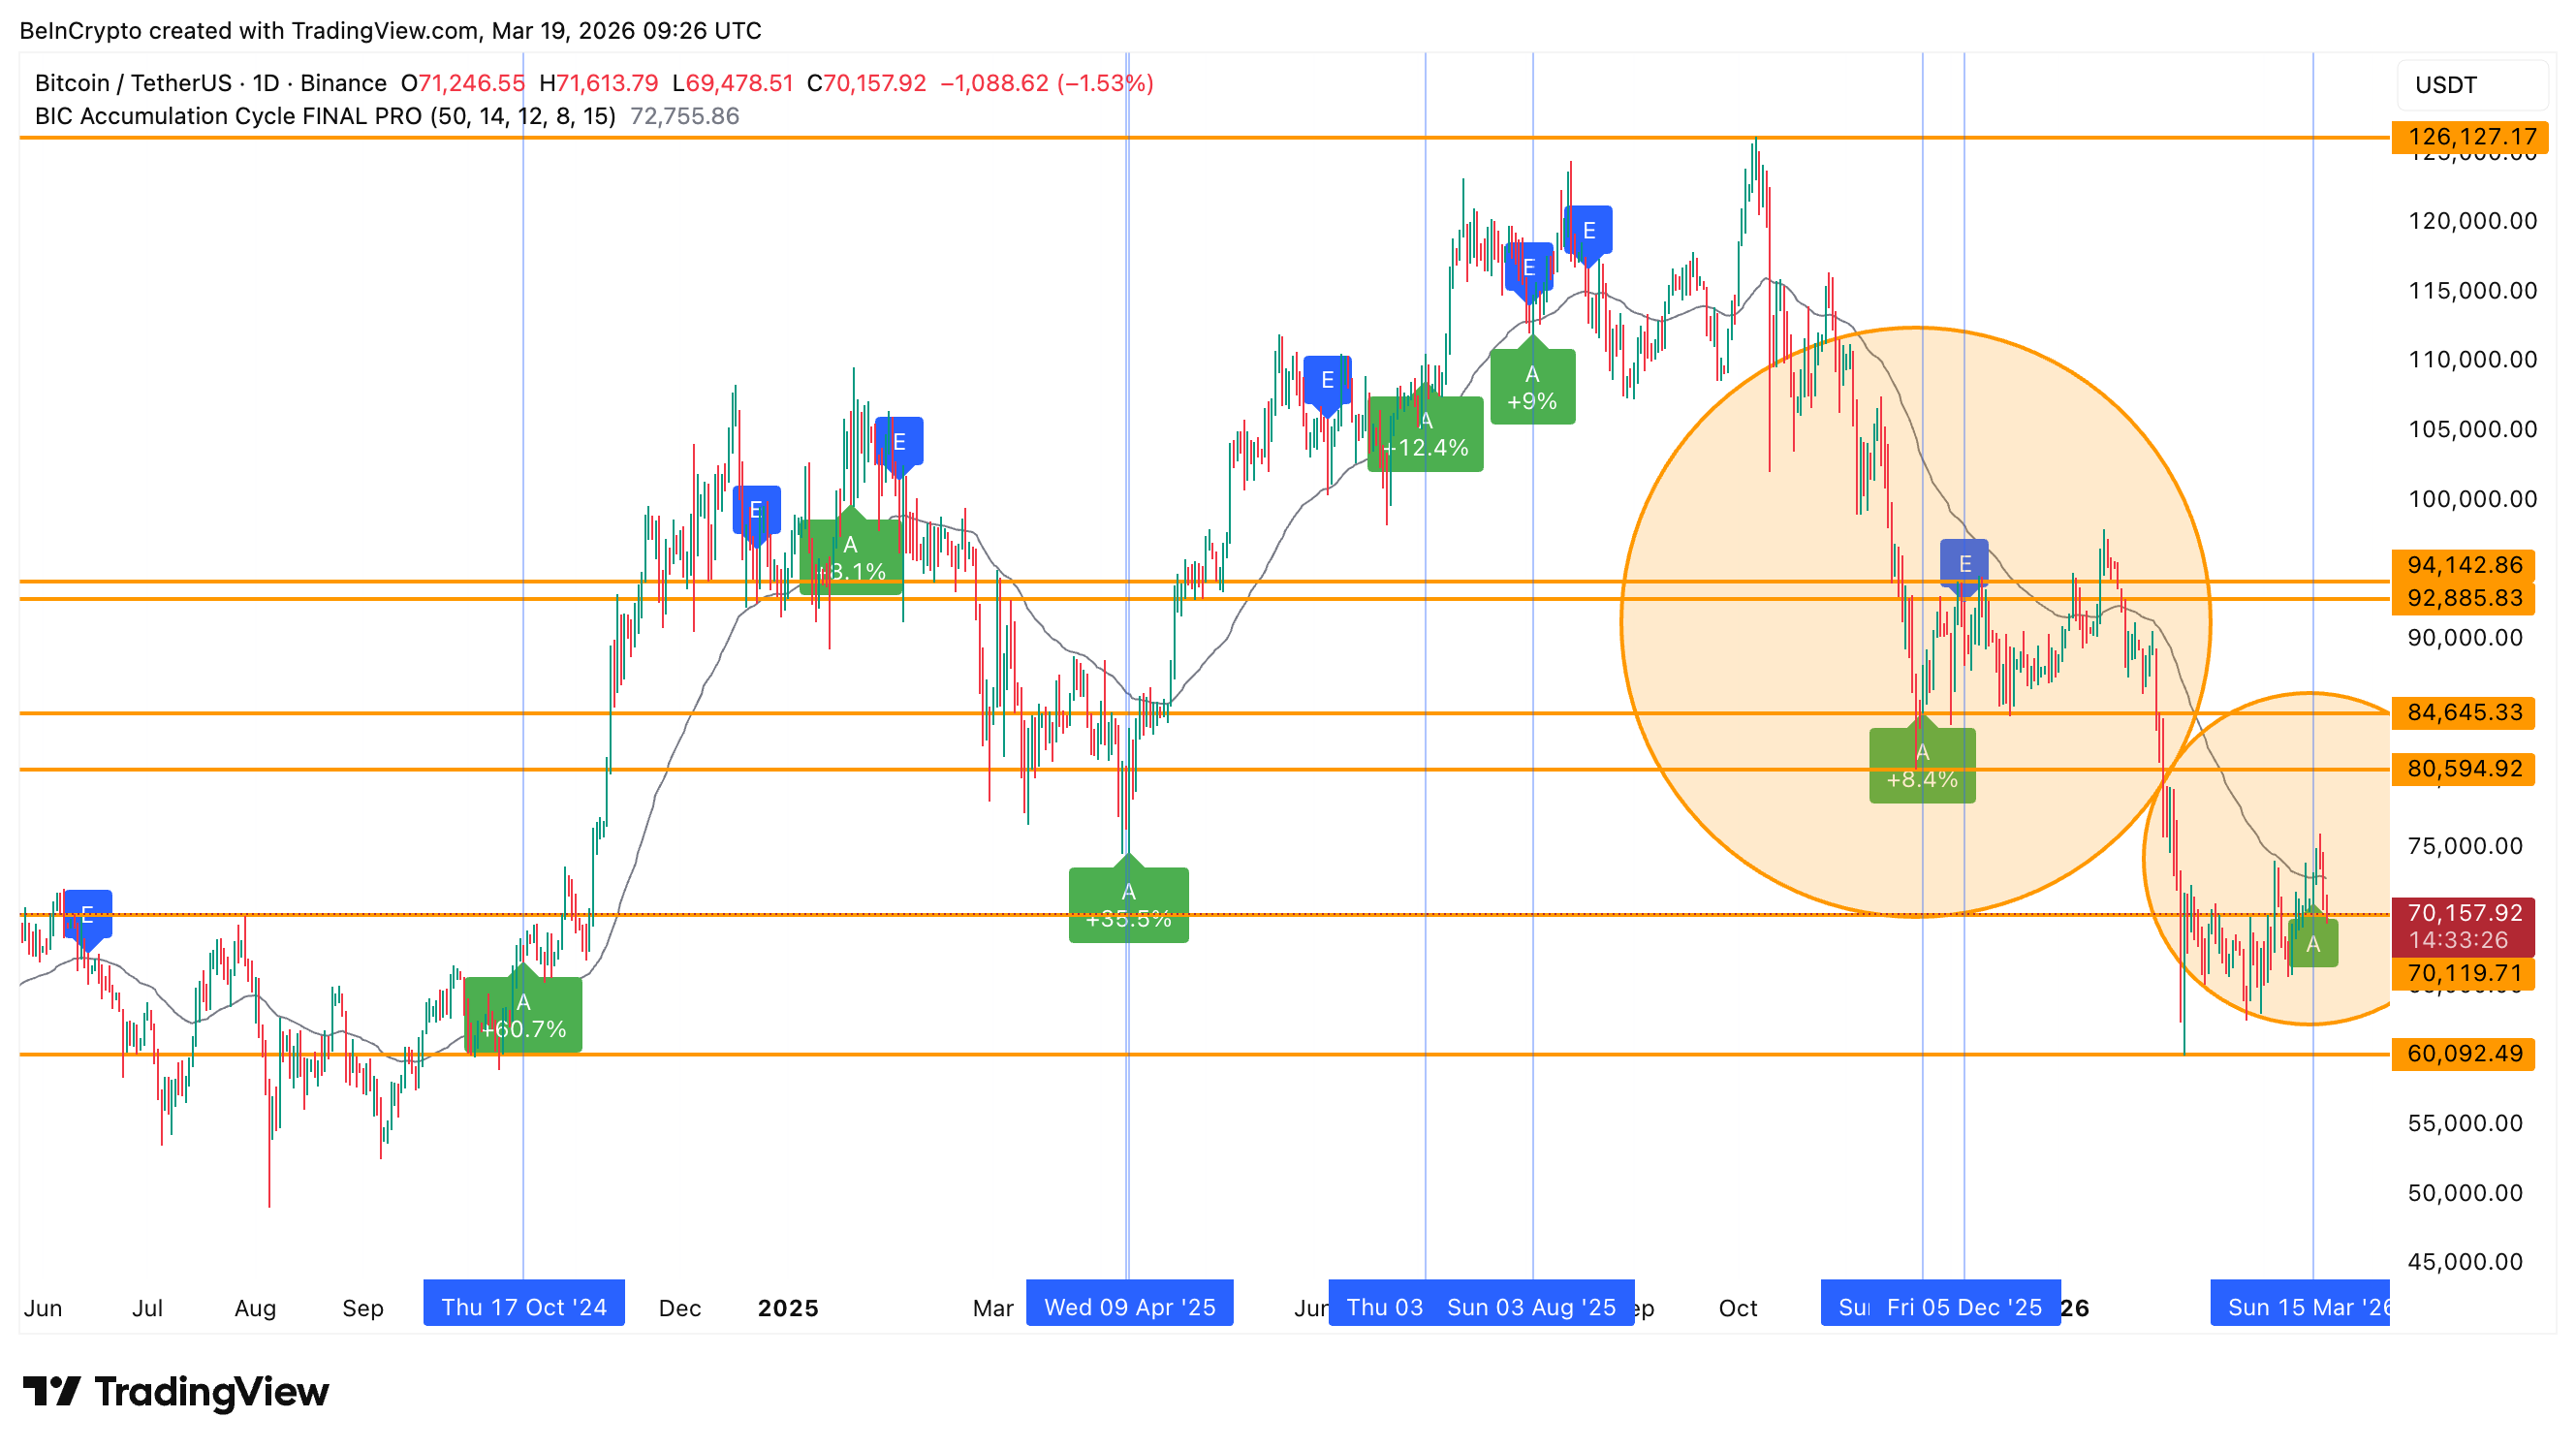
Looking back, the model has identified multiple strong cycles. In October 2024, it captured a move of around 60%. In April 2025, it identified another phase that led to a 35% rally. Each accumulation signal was backed by a clear ending.
 What AI Trading Bots Can Predict: TradingView
More recent cycles, including November and early 2026, delivered 8% to 12% moves.
Want more token insights like this? Sign up for Editor Harsh Notariya’s Daily Crypto Newsletter here.
Why It Does Not Track Exact Bottoms
The model avoids bottom picking by design. At market lows, selling pressure is still active, and momentum is weak. That makes early signals unreliable.
The market could even go lower in a bearish phase. This is why it ignored levels like $60,000 in February and $80,500 in November. It also shows that this AI trading bot doesn’t pick a bottom but the right trigger before a sign surfaces.
Instead, it waits for reclaim and momentum shift. That improves signal quality and reduces false entries.
On-Chain Data Verifies About Entries And Exits
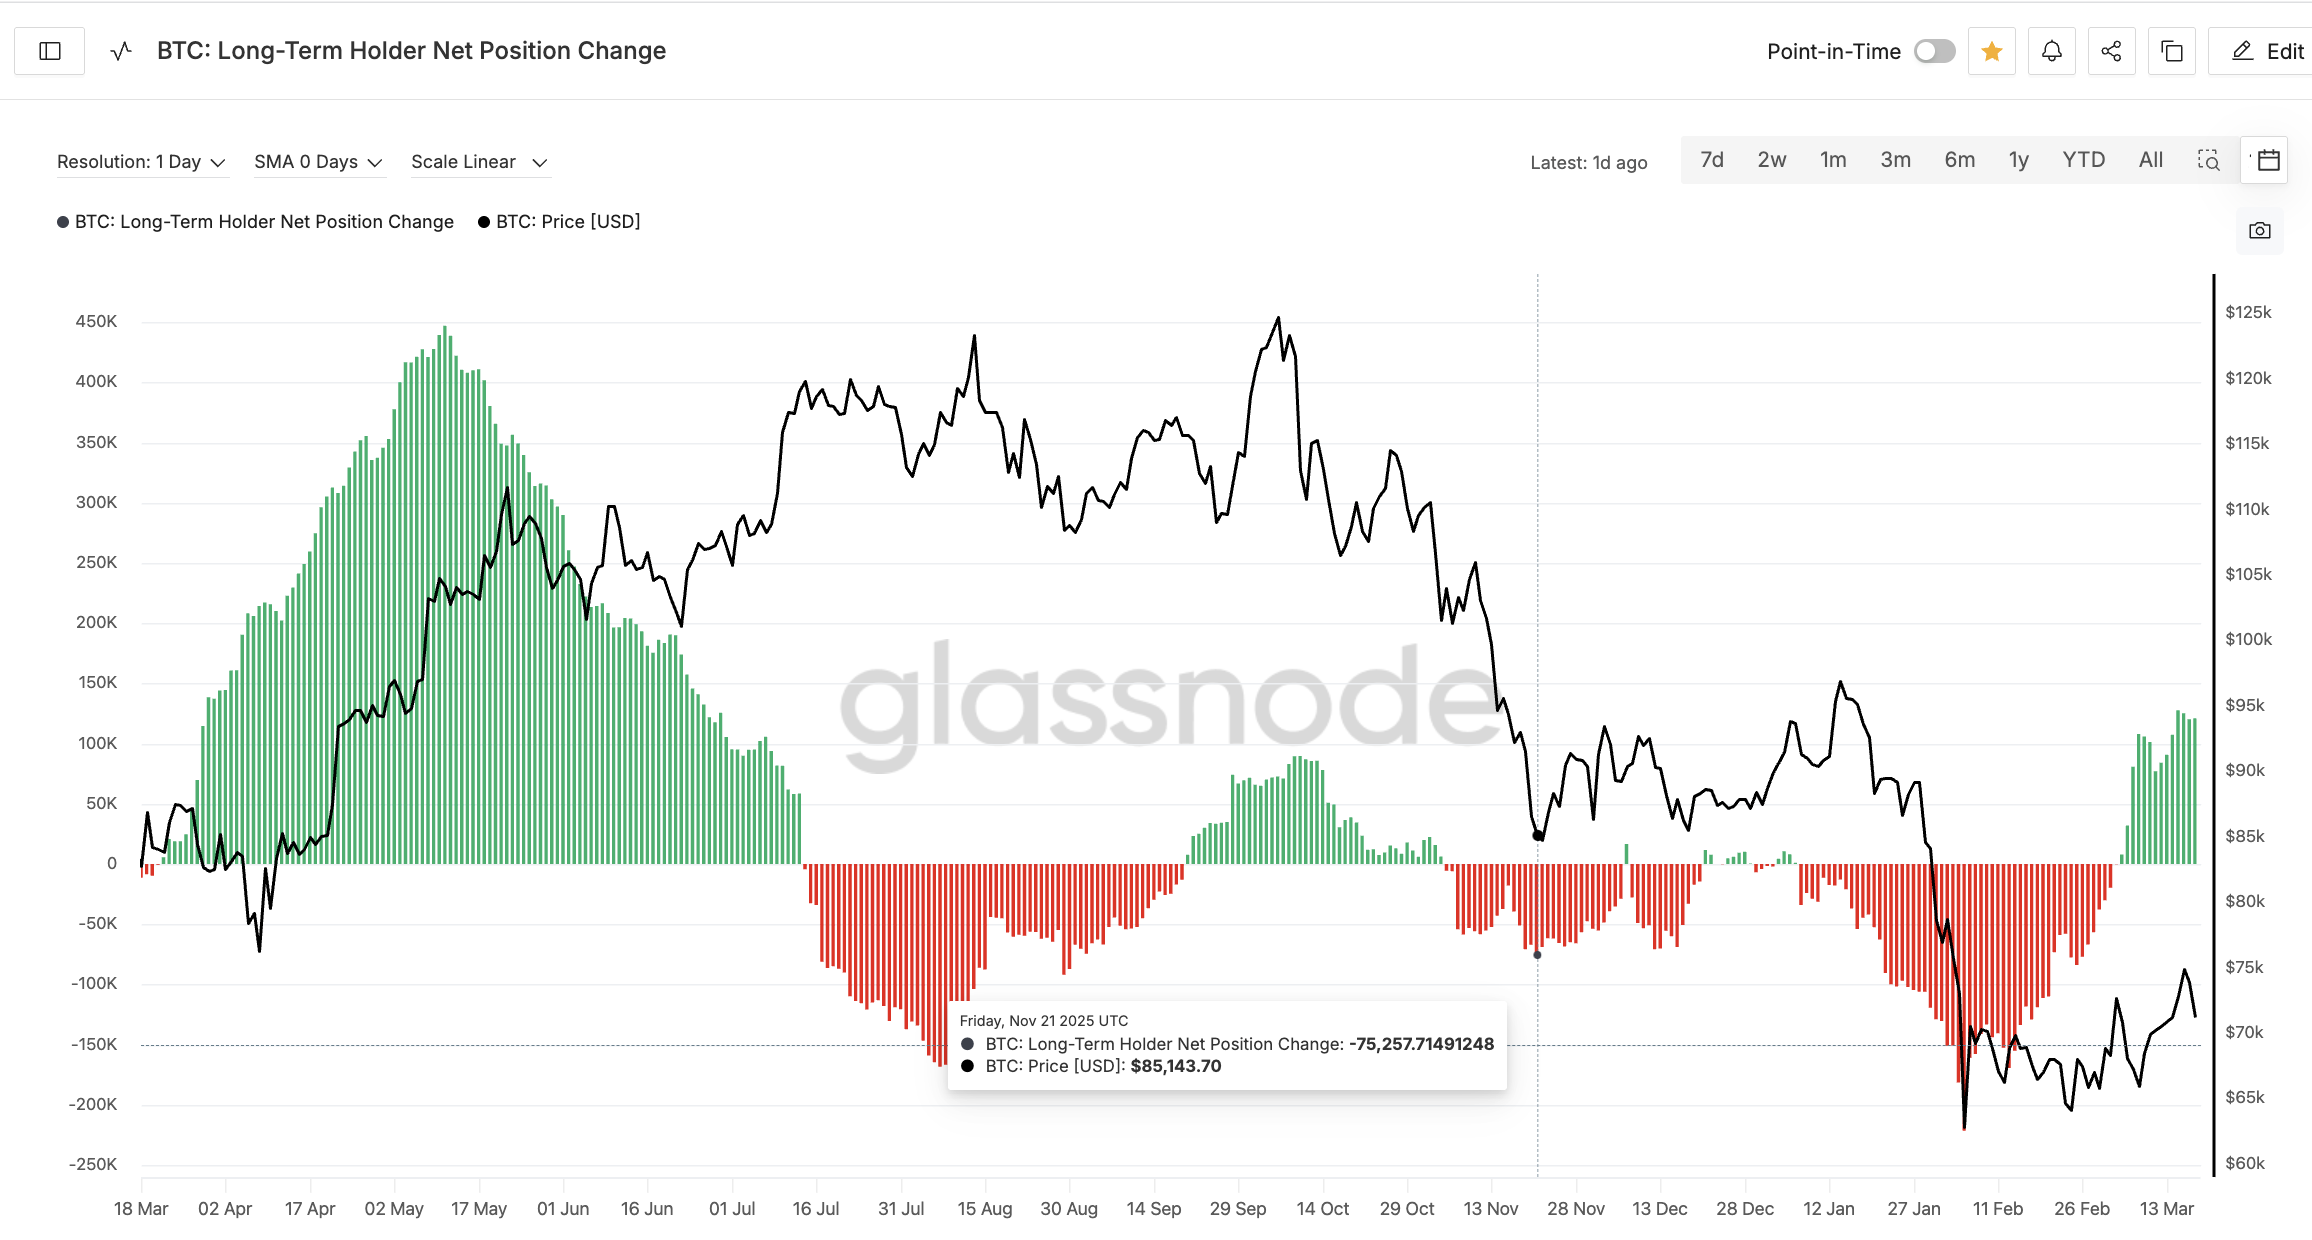
The signals align with long-term BTC holder behavior, one key on-chain sign. Glassnode’s Long-Term Holder Net Position Change metric, one used to track the positioning of holders sitting with BTC for 365 days or more, is used here.
During the November cycle, long-term holder selling peaked near 75,000 BTC. Selling pressure started easing before the signal appeared. Accumulation sign per BIC’s trading bot flashed on November 23, and the cycle ended near December 5. That was the phase when the long-term holders slowly reduced their selling. A bullish sign validating the accumulation trigger.
 On-Chain Data Meets Trading Bots: Glassnode
Shortly after, long-term holder activity briefly turned positive before selling resumed, aligning with the model’s exit signal.
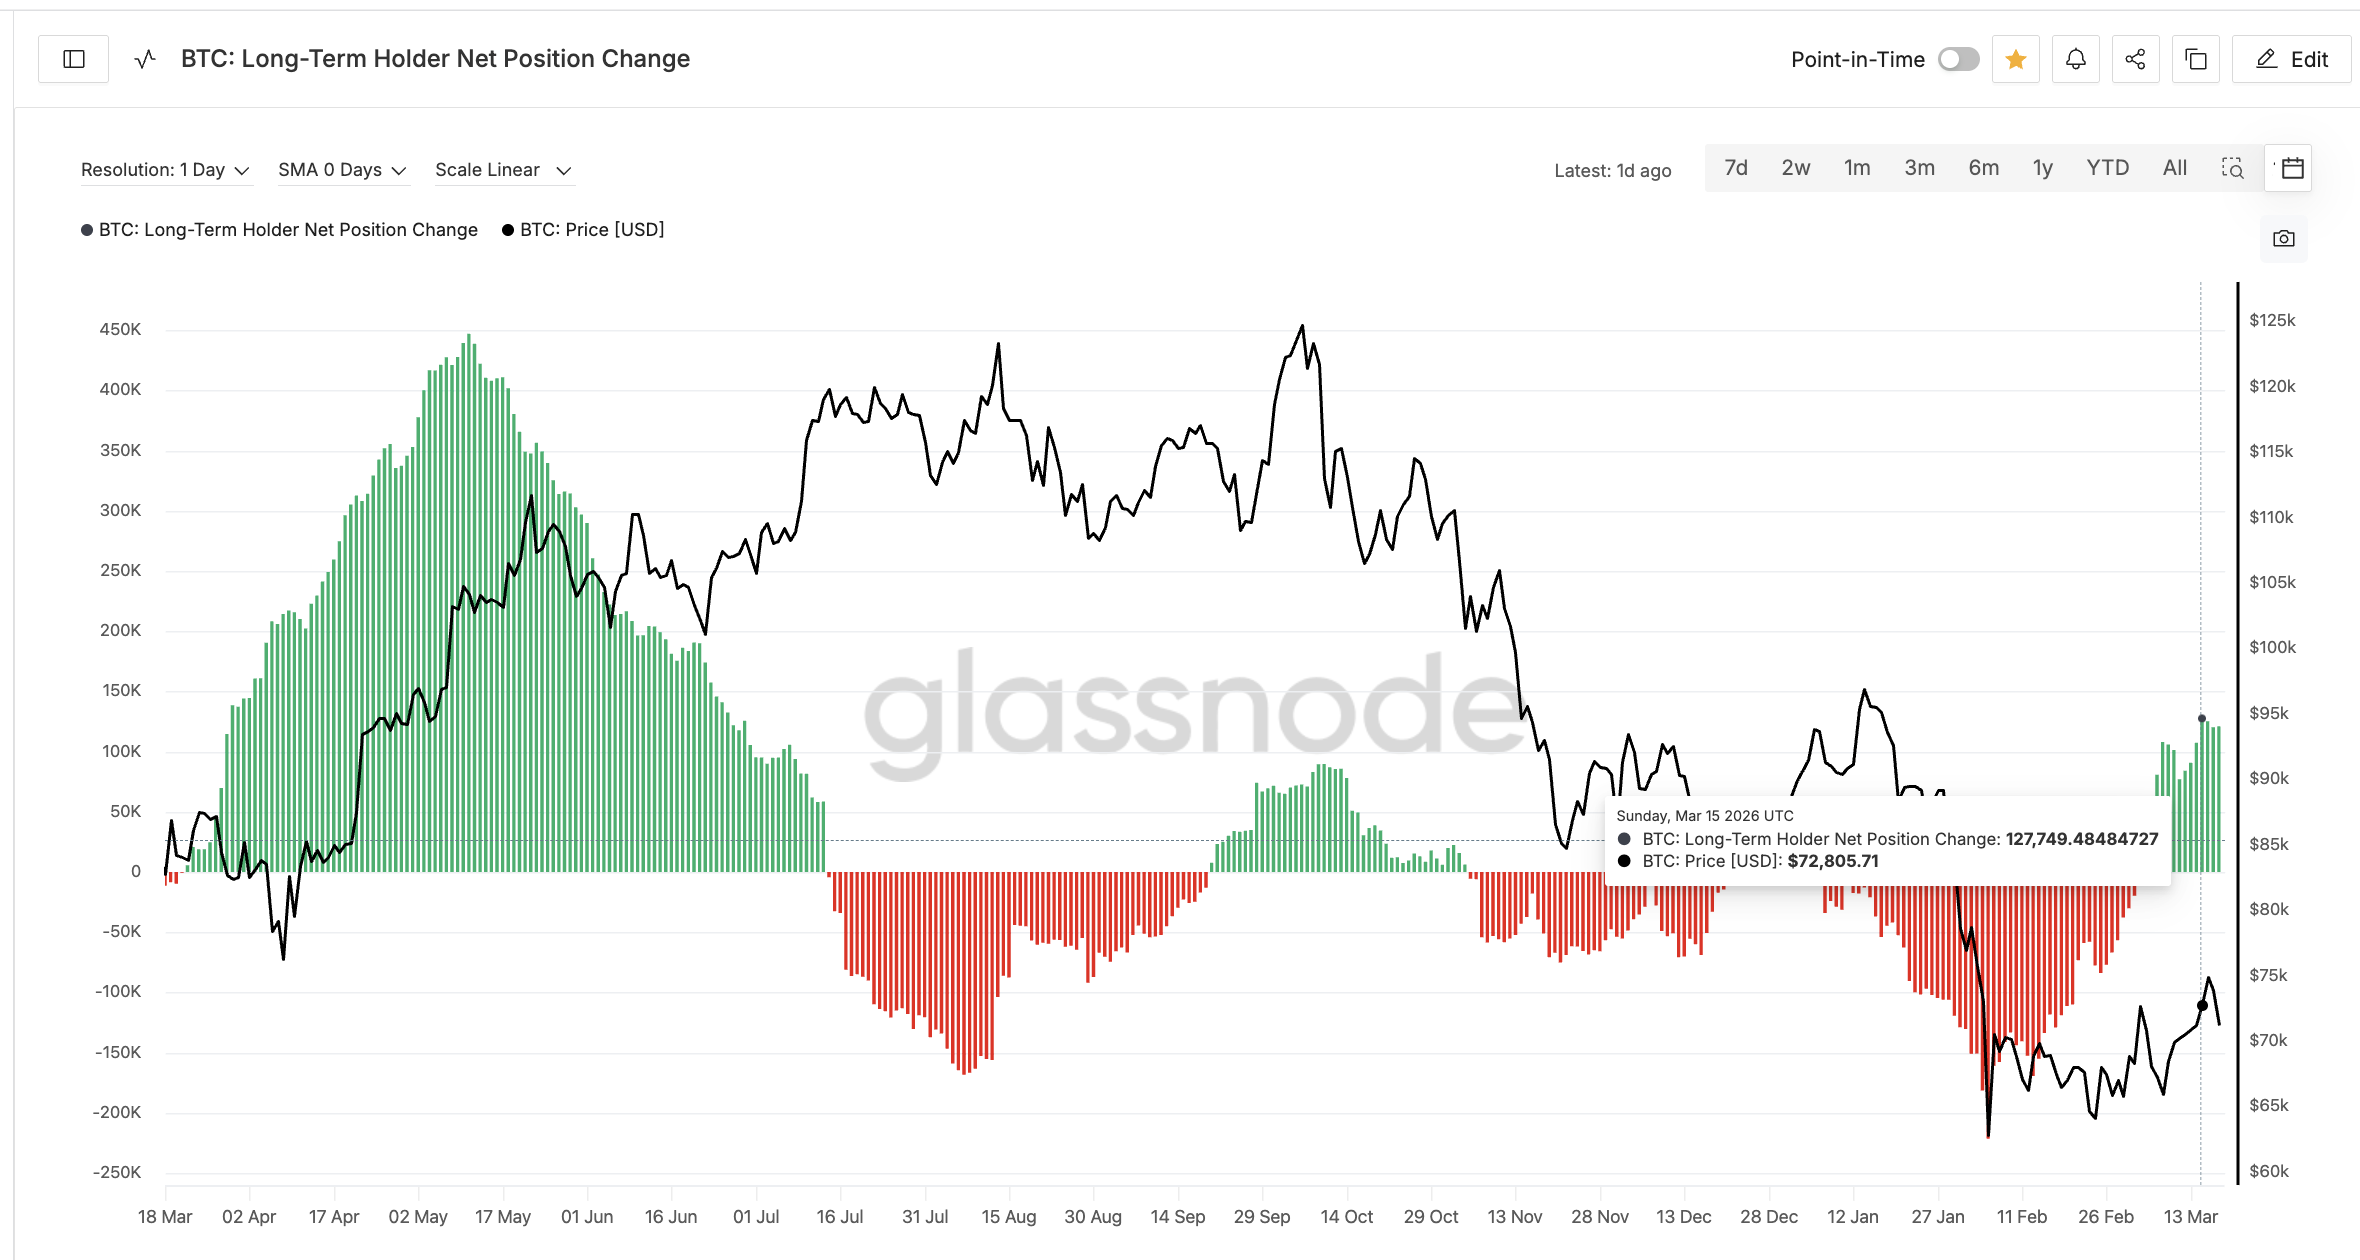
In the current cycle, the signal appeared around March 15, while the long-term holder net position change is now positive and rising.
 How Holders Validate Bot Logic: Glassnode
Even though the price has pulled back, the holder accumulation remains active. That is why no exit signal has appeared yet. The accumulation signal on the technical chart also remains active.
How To Use Alerts From AI Trading Bots
To use the model in real time, alerts can be set directly on TradingView. Add the indicator (BIC Accumulation Cycle Final Pro), then create alerts for both
- Accumulation Start (A) for entry
- Accumulation End (E) for exit
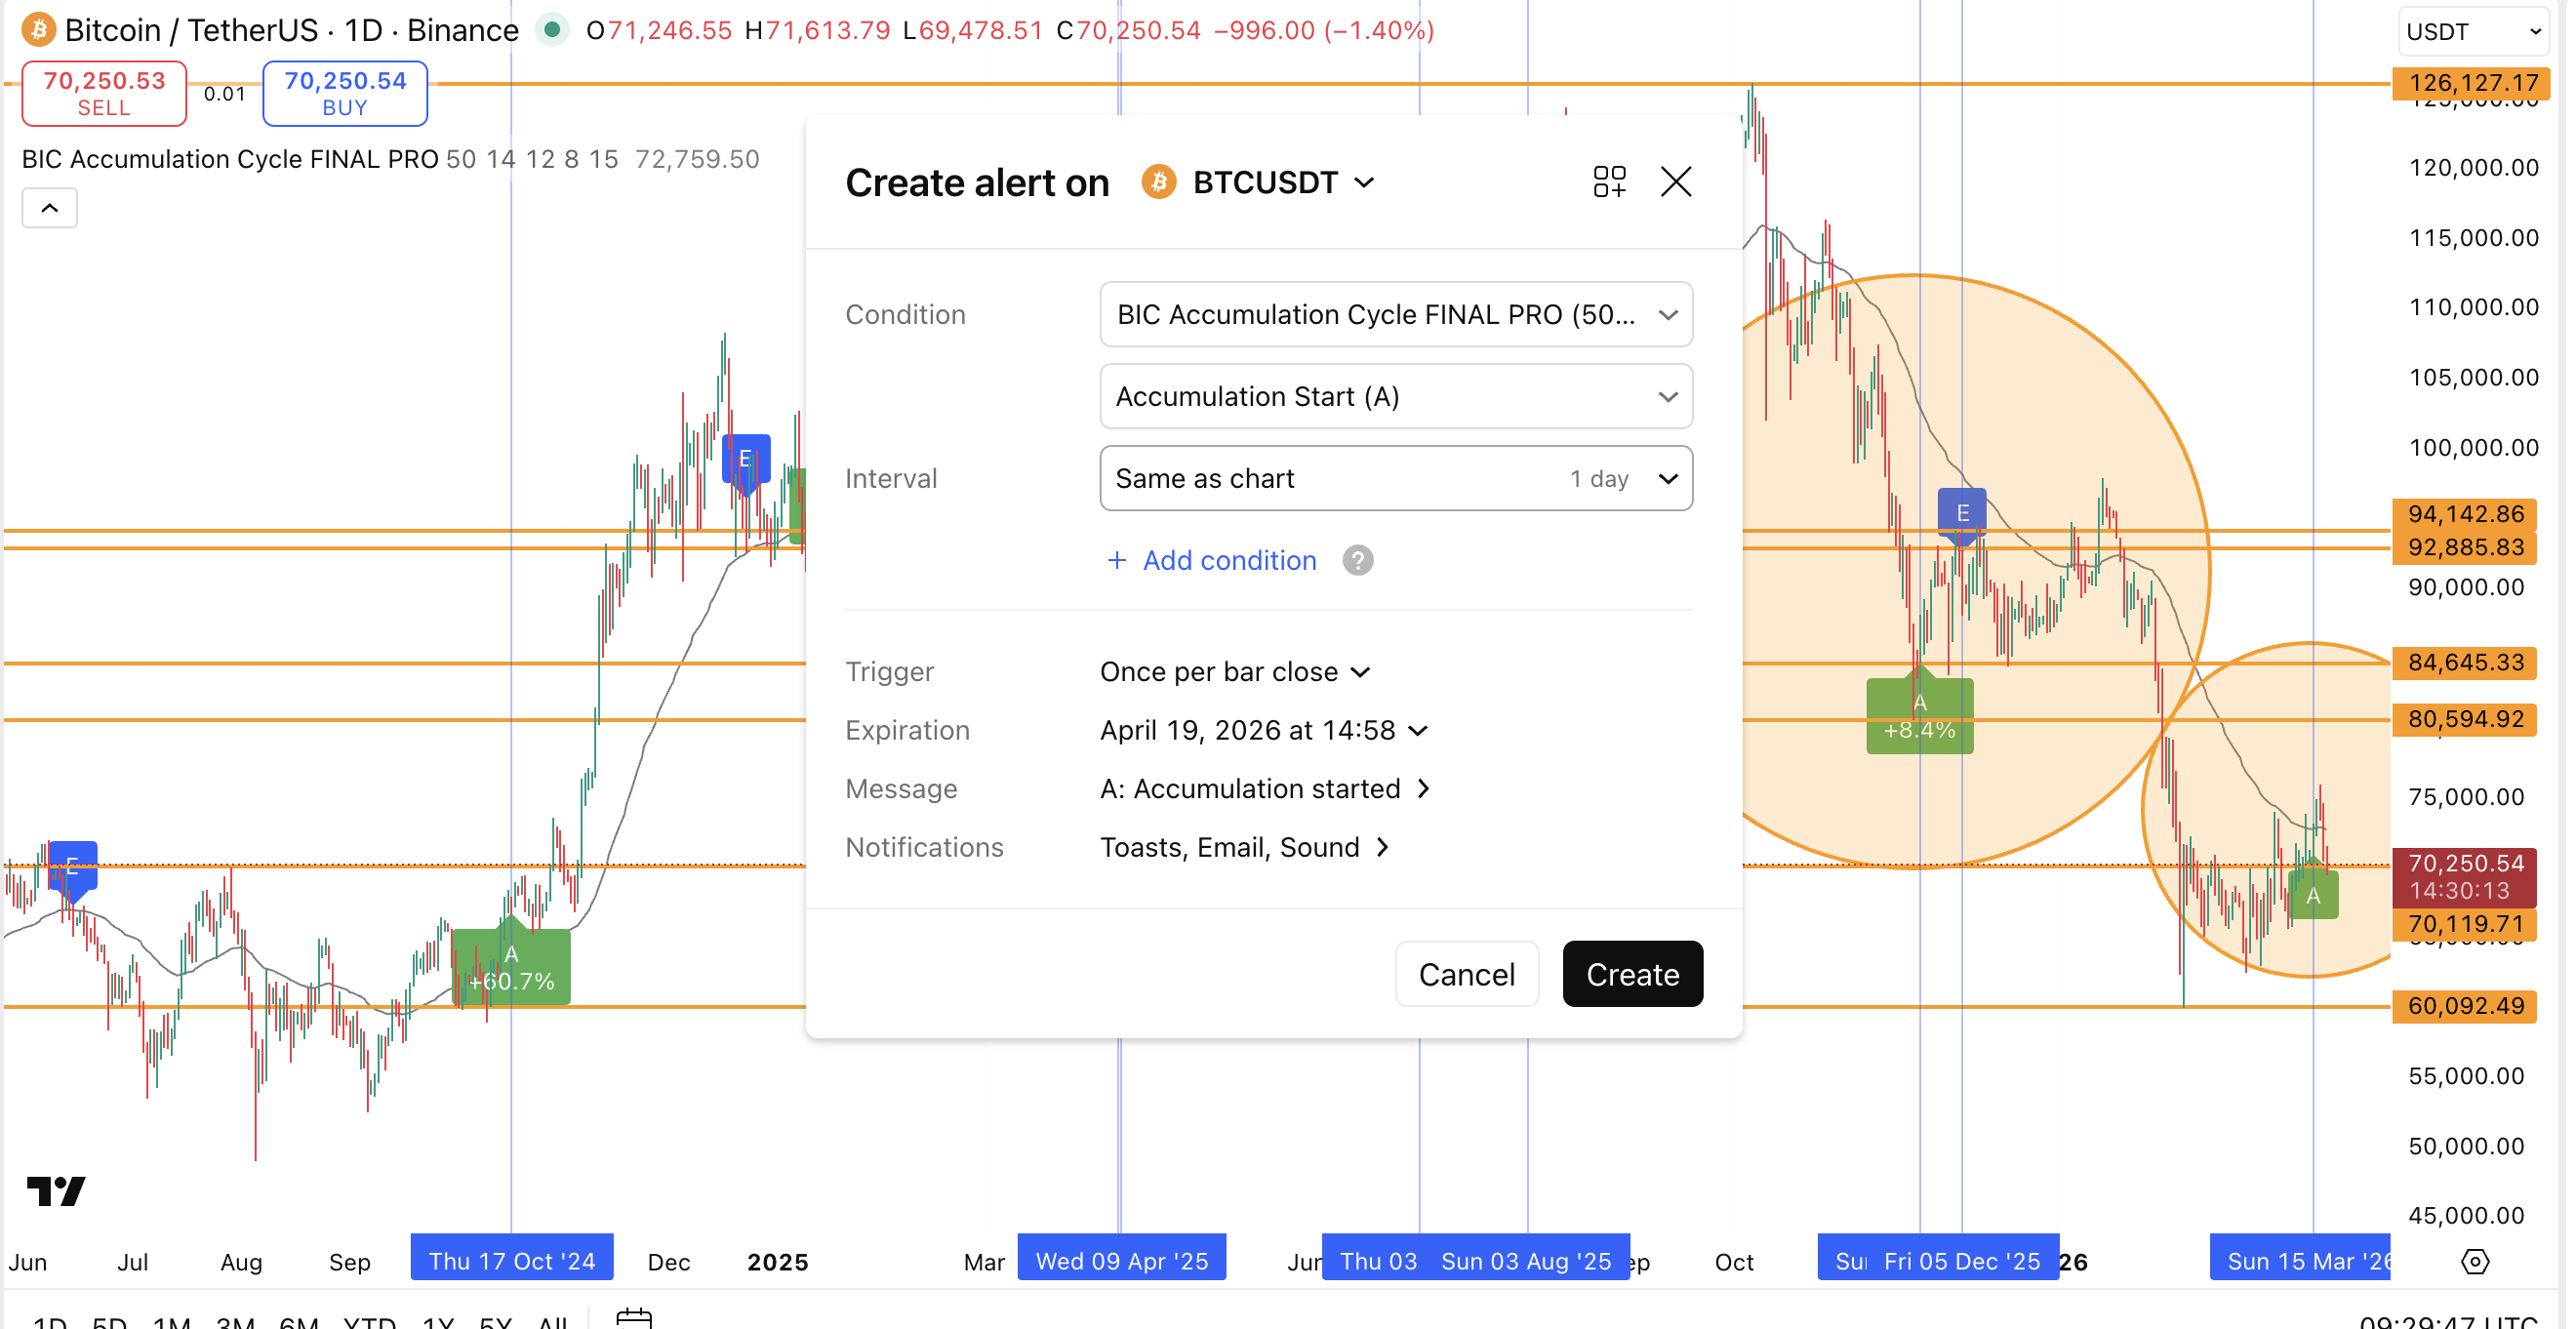 Setting Up Alerts: TradingView
Set the interval to match your chart and use once per bar close, so signals are confirmed.
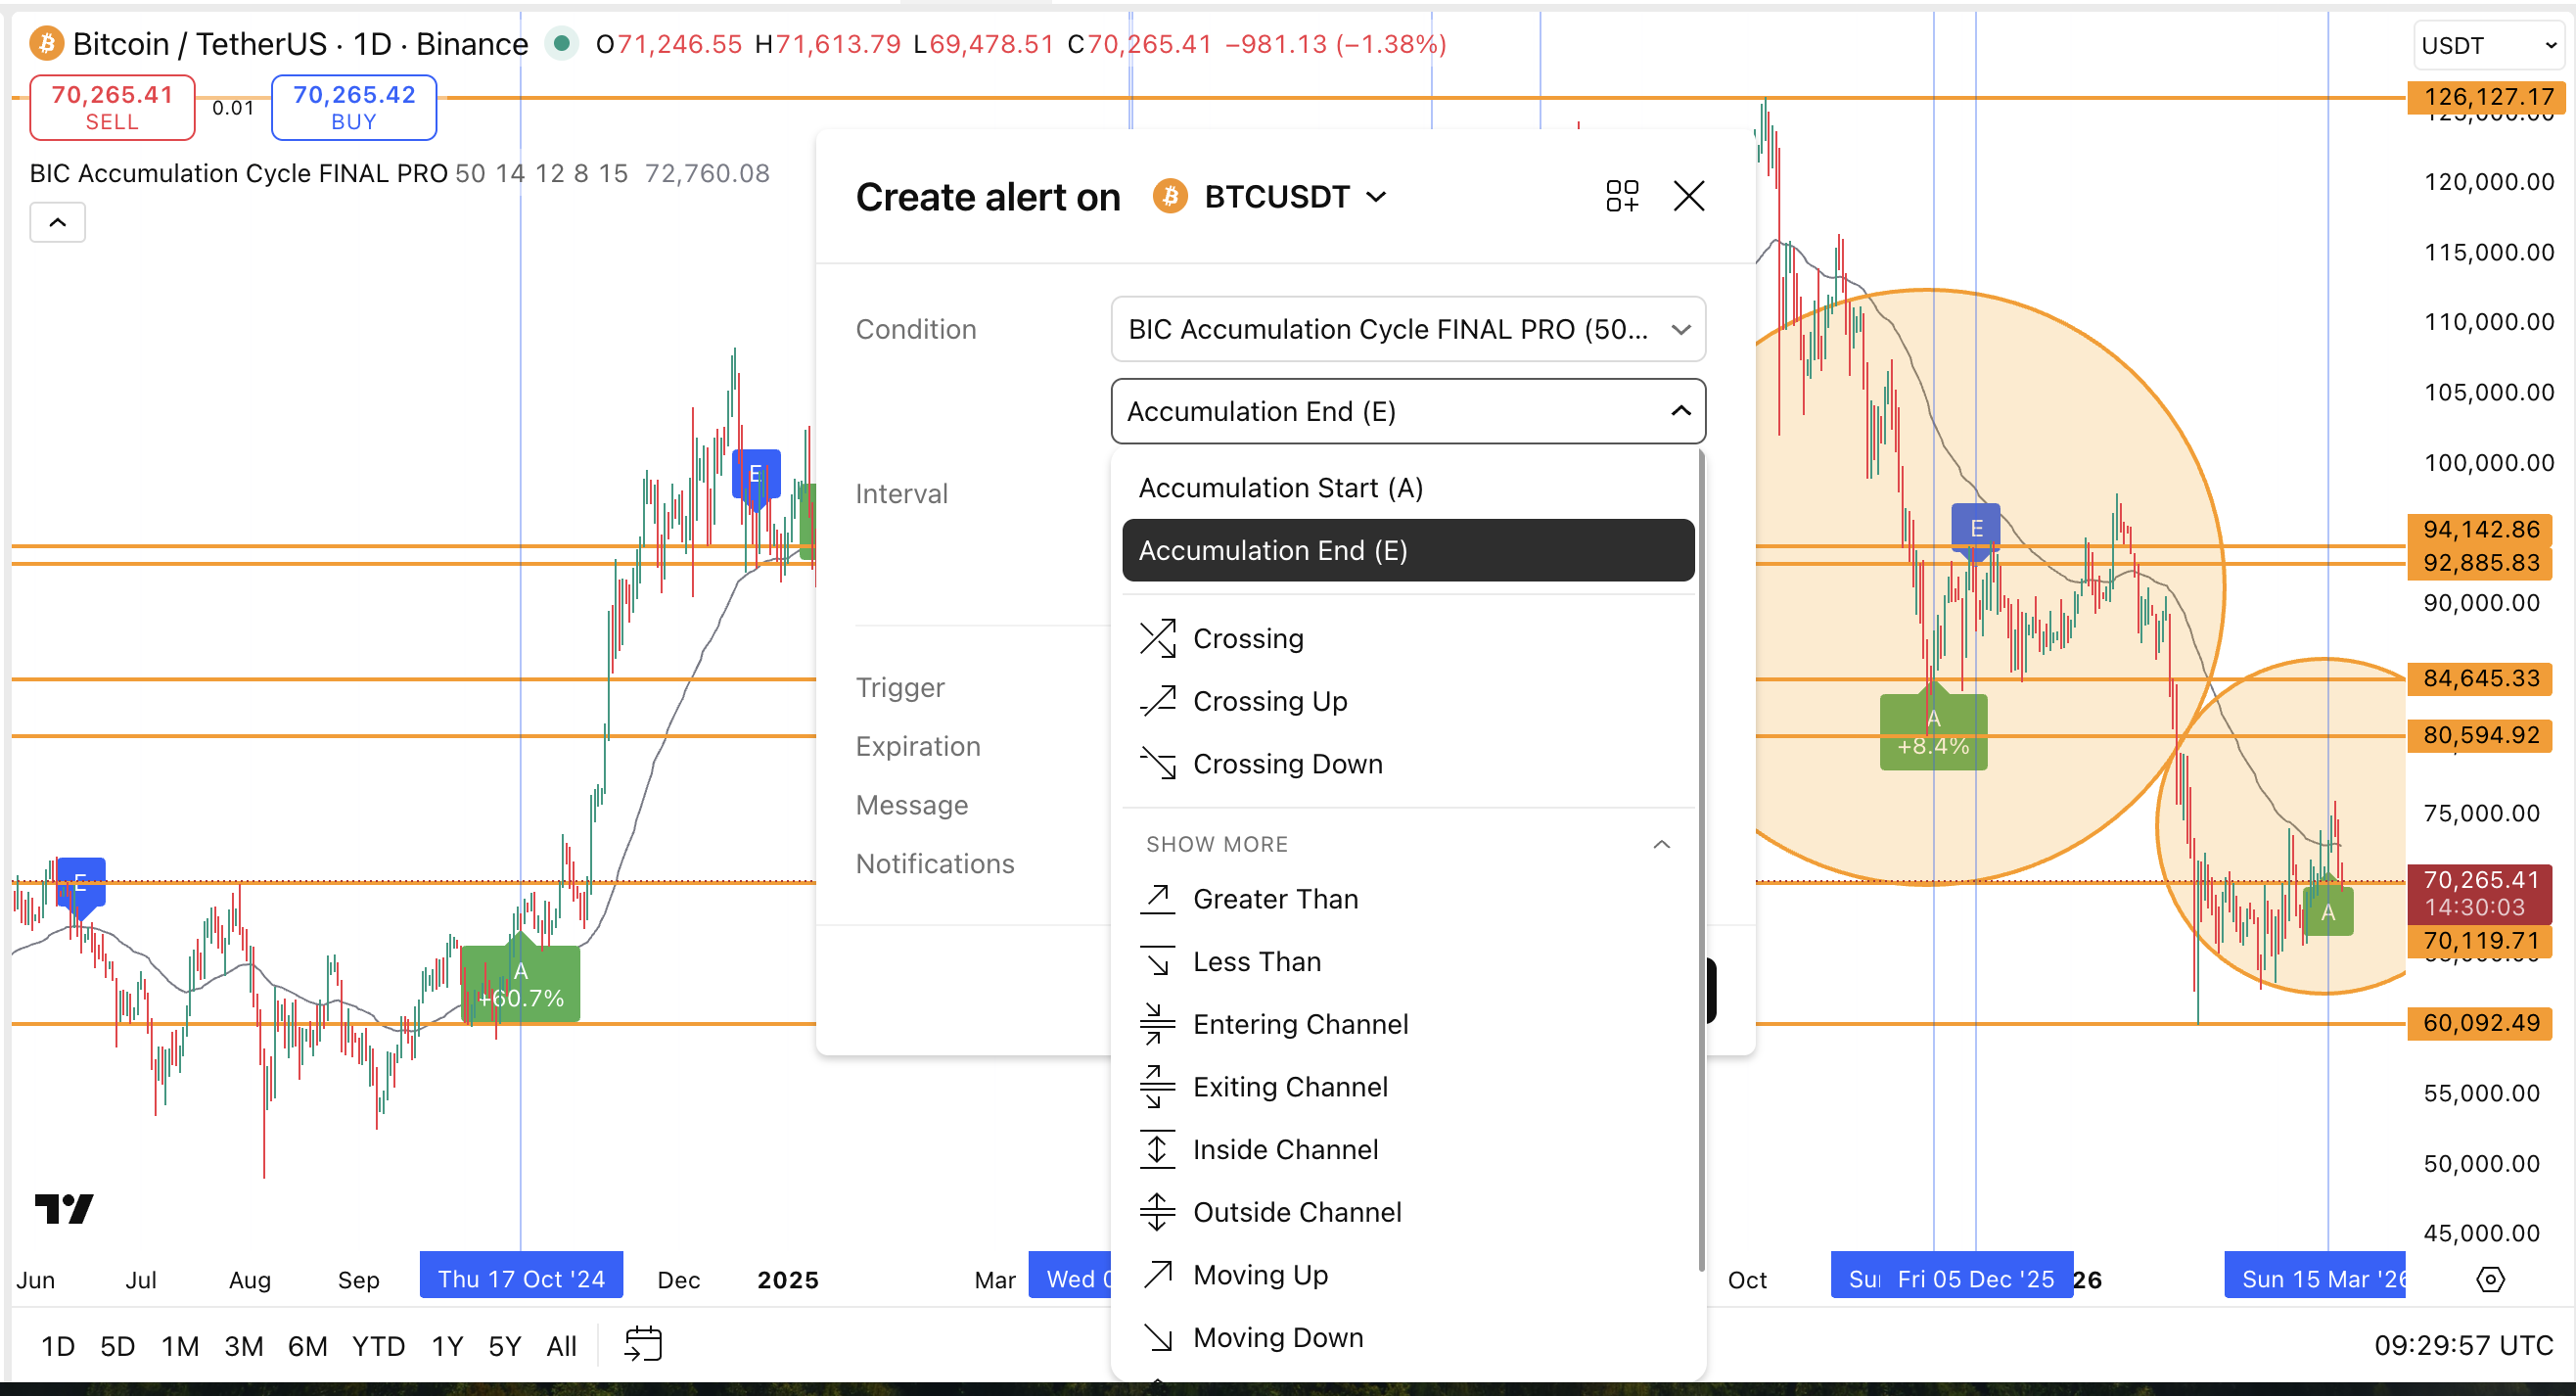 Accumulation Ending Alert: TradingView
Expiry should be set at least one to three months ahead, and extended if needed. Notifications can be received through the app, email, or sound.
If Bitcoin follows the path Kendrick outlined, moving between $50,000 and $100,000, the move will not be straight. It will include multiple swings.
Bitcoin can move from $60,000 to $75,000, correct again, and still remain in the same broader cycle.
AI trading bots like these focus on those swings. They track where strength begins and where it starts fading. That allows traders to act within the move instead of sitting through the entire cycle, round-tripping their portfolios.
Recommended Articles


