

Bitcoin Price Forecast: BTC stabilizes as Powell’s tone may drive the next market move
- Bitcoin price stabilizes at $74,000 on Wednesday, following a key technical breakout earlier this week.
- US-listed spot ETF recorded an inflow of nearly $200 million on Tuesday, marking the seventh consecutive day of positive flows.
- Traders should be cautious as the end of the two-day FOMC meeting could bring fresh volatility to risky assets such as BTC.
Bitcoin (BTC) price is steady around $74,000 as of writing on Wednesday, after a key technical breakout earlier this week. Institutional demand remains robust amid the ongoing war in the Middle East, with spot Exchange Traded Funds (ETFs) recording continuous inflows and supporting the Crypto King’s bullish price action. However, market participants remain cautious on Wednesday as the end of the two-day Federal Open Market Committee (FOMC) meeting, followed by Fed Chair Jerome Powell’s remarks, could spark volatility across risk assets, such as BTC.
The Middle East war could delay interest rate cut expectations
Bitcoin’s price is stabilizing around $74,000 on Wednesday, as market participants seem reluctant to place directional bets ahead of the crucial Federal Open Market Committee (FOMC) meeting later on Wednesday.
The Federal Reserve (Fed) is widely expected to keep rates unchanged at 3.50%–3.75%, with the CME FedWatch Tool chart below showing a 98.9% chance that the rates will remain unchanged.
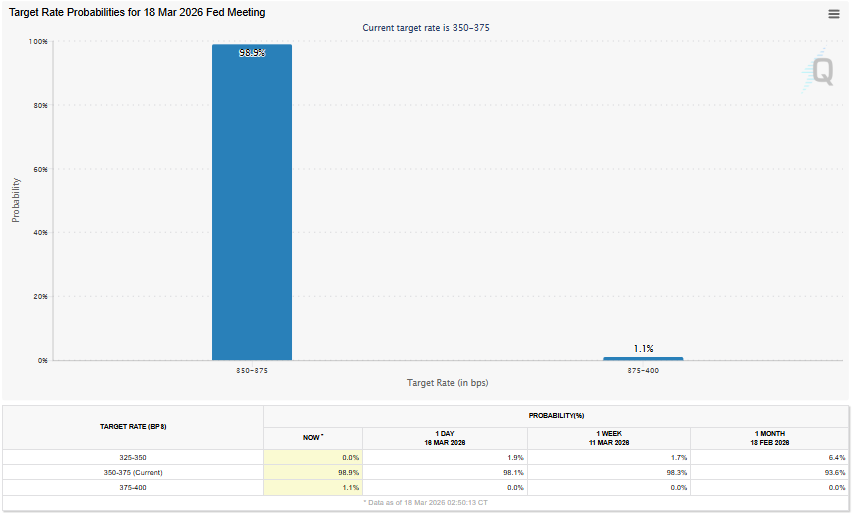
If the Fed keeps the rates steady, this would mark a second consecutive pause, reflecting a cautious stance amid increasing economic and geopolitical uncertainty.
Meanwhile, traders are now focused on Fed Chair Jerome Powell’s remarks on rising Oil prices due to the US-Israel war with Iran, which has reignited inflation concerns and may influence the central bank’s policy outlook in the future.
This forward projection by the central bank could bring in fresh volatility toward risky assets such as Bitcoin, which traders should watch for.
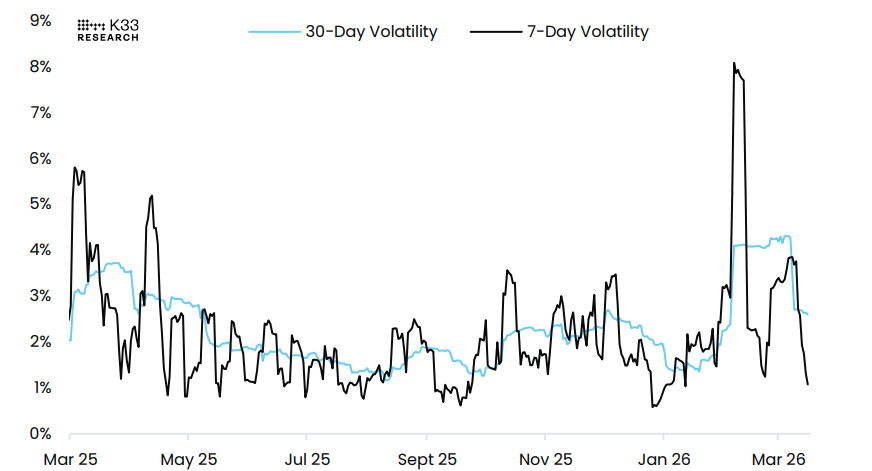
The Bitcoin volatility chart below shows that the eight consecutive days of modest gains from March 9 to 16 have pushed 7-day volatility down to around 1%, marking its lowest level in two months. Historically, such streaks are rare, and the current conditions of steady, low volatility signals controlled accumulation and suggest a sustainable trend. Meanwhile, the Fed’s rate decision and projections later on Wednesday could serve as a key catalyst, injecting fresh volatility into markets and shaping Bitcoin’s near-term trajectory.
Institutional demand remains strong
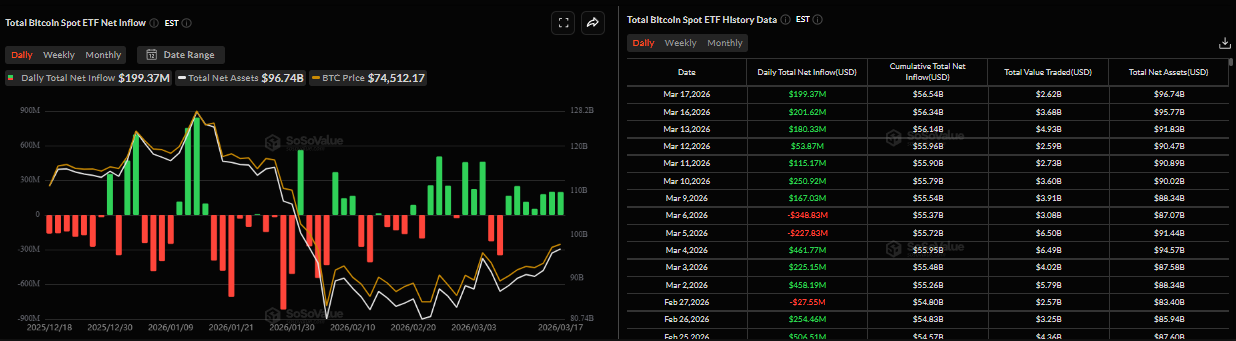
Institutional demand for Bitcoin has remained robust so far this week. According to SoSoValue data, spot Bitcoin ETFs recorded inflows of $199.37 million on Tuesday, marking the seventh consecutive day of positive flows since March 9. If these inflows continue and intensify, BTC could see a rally in the upcoming days.
BTC has outperformed other assets since the war
Bitcoin has gained nearly 13%, standing out against negative returns in both equities and Gold, as shown in the chart below.
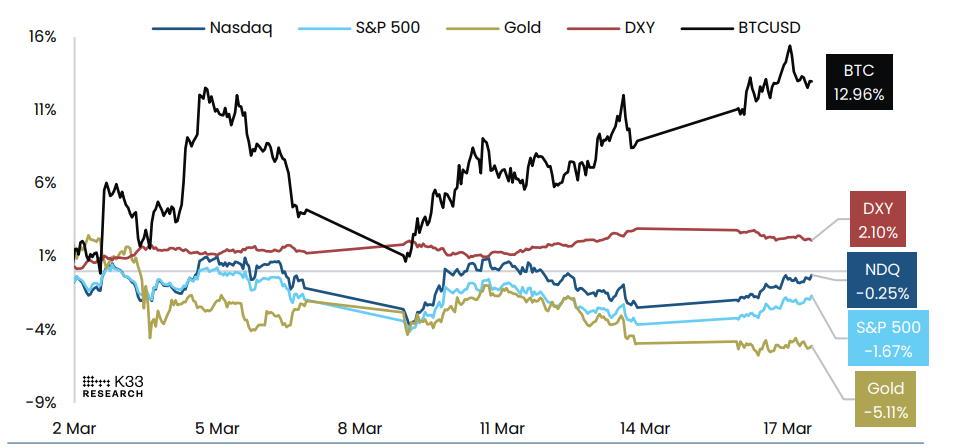
A K33 Research report on Tuesday stated that “Bitcoin’s performance remains the key divergence. Historically, risk-off environments tend to hit BTC hardest, yet that has not been the case here. Context is important. Unlike Gold, BTC had already underperformed for months, experiencing a 50% drawdown prior to the war.”
The analyst at K33 Research concluded, “We have argued that BTC was underowned, overshorted, and oversold, indicating it was already heavily de-risked. With positioning washed out, existing holders were less inclined to sell into weakness, and the post-war price action may be reinforcing a narrative of Bitcoin as a scarce alternative asset with improving relative momentum.”
Bitcoin Price Forecast: $78,000 technical target is still in play
Bitcoin price is stabilizing at around $74,000 on Wednesday. The near-term bias turns bullish as price breaks above the parallel channel, whose upper boundary had capped gains near $72,600 since early February, signalling a shift away from the prior sequence of lower highs.
The Relative Strength Index (RSI) at 59 holds above its midline, signaling firm but not overextended upside momentum, while the Moving Average Convergence Divergence (MACD) line remains above its signal line in positive territory, with a still-positive histogram reinforcing sustained buying pressure.
Initial support emerges at the former channel resistance around $72,600, which roughly aligns with the 50-day Exponential Moving Average at $72,900, now acts as a key pivot for the nascent breakout.
A deeper pullback would eye the $70,900 (near Sunday’s low), ahead of the lower band of the parallel channel near $65,900.
On the topside, immediate resistance aligns with the recent peak at $76,000 (Tuesday’s high). A daily close above this level would open the path toward the technical target for the channel breakout above $78,000, based on the channel’s width.
As long as price holds above $72,600 on a closing basis, the technical picture favors continuation of the advance rather than a return into the prior descending channel.
-1773827414096-1773827414097.png)
(The technical analysis of this story was written with the help of an AI tool.)
Bitcoin, altcoins, stablecoins FAQs
Bitcoin is the largest cryptocurrency by market capitalization, a virtual currency designed to serve as money. This form of payment cannot be controlled by any one person, group, or entity, which eliminates the need for third-party participation during financial transactions.
Altcoins are any cryptocurrency apart from Bitcoin, but some also regard Ethereum as a non-altcoin because it is from these two cryptocurrencies that forking happens. If this is true, then Litecoin is the first altcoin, forked from the Bitcoin protocol and, therefore, an “improved” version of it.
Stablecoins are cryptocurrencies designed to have a stable price, with their value backed by a reserve of the asset it represents. To achieve this, the value of any one stablecoin is pegged to a commodity or financial instrument, such as the US Dollar (USD), with its supply regulated by an algorithm or demand. The main goal of stablecoins is to provide an on/off-ramp for investors willing to trade and invest in cryptocurrencies. Stablecoins also allow investors to store value since cryptocurrencies, in general, are subject to volatility.
Bitcoin dominance is the ratio of Bitcoin's market capitalization to the total market capitalization of all cryptocurrencies combined. It provides a clear picture of Bitcoin’s interest among investors. A high BTC dominance typically happens before and during a bull run, in which investors resort to investing in relatively stable and high market capitalization cryptocurrency like Bitcoin. A drop in BTC dominance usually means that investors are moving their capital and/or profits to altcoins in a quest for higher returns, which usually triggers an explosion of altcoin rallies.
Recommended Articles


